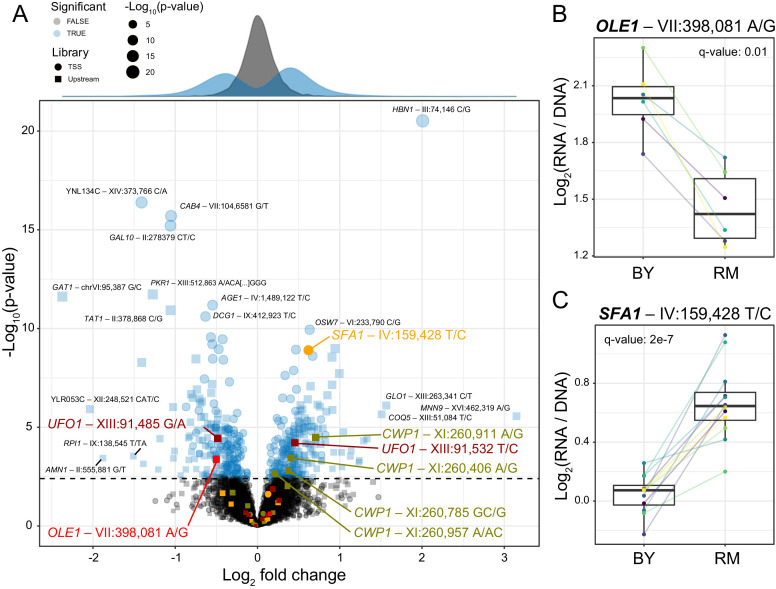
Figure 2. Identification of single causal variants.
(A) A scatterplot showing the effect size and significance for each variant. The genome-wide significance threshold is shown as a dashed horizontal line. Variants with the most significant effects, along with the genes they affect, are indicated. Variants and genes highlighted in color are described in the text. The histograms at the top shows the distribution of effect sizes for causal (blue) and non-causal (gray) variants. (B) A variant in the promoter of OLE1 known to affect OLE1 expression has a significant effect in the Upstream MPRA. The figure shows expression values for oligos carrying the two alleles. Colored lines and dots indicate different biological replicate experiments. Boxplots show the median as thick line, with the box showing the 25th and 75th percentiles. Whiskers show the largest value no further than 1.5 times the inter-quartile range; points beyond this range are shown as individual points. (C) As in (B) for a variant in the SFA1 promoter, which was detected in the TSS library. To identify individual causal variants, we tested each promoter variant for its effect on reporter gene expression. We detected 166 variants with significant effects in the TSS library and 293 variants in the Upstream library at a false discovery rate (FDR) of 5% (Figure 2—source data 1). The π1 statistic (Storey and Tibshirani, 2003) computed across all variants suggested that at least 26 and 31% of variants had effects on gene expression in the TSS and Upstream libraries, respectively, even if these variants could not all be detected with individual significance. There were 451 unique variants that reached significance across the two partially overlapping libraries (A, Figure 2—source data 2).


