. 2020 Nov 13;9:e56058. doi: 10.7554/eLife.56058

Figure 2. ZDHHC14 palmitoylates PSD93 in hippocampal neurons.

(A) Cultured hippocampal neurons were transduced with the indicated lentiviruses on day in vitro (DIV) nine and lysed on DIV16. Lysates were blotted with the indicated antibodies. Two ZDHHC14 bands were identified (indicated by arrow heads ‘1’ and ‘2’). (B) Quantified intensities of the indicated ZDHHC14 bands from A, normalized to band ‘1’ in the control virus condition (2-way ANOVA: Virus p<0.0001 [F(1)=618.7], band p<0.0001 [F(1)=72.17], interaction p<0.0001 [F(1)=51.64]; N = 5; Bonferroni posthoc test ****p<0.0001; 95% CI control versus 14sh#1 band 1 [–1.01,–0.81], control versus 14sh#1 band 2 [–0.60,–0.40]). (C) Cultured hippocampal neurons were lentivirally infected and lysed as in A and palmitoyl-proteins (isolated by ABE; left panels) and total protein levels in parent lysates (right panels) were assessed by western blotting with antibodies against PSD93 (top panel), GAP43 (middle panel, positive control palmitoylated protein), and Erk1/2 (bottom, negative control non-palmitoylated protein). (D) Quantified data from C, showing PSD93 (left) and GAP43 (right) palmitoyl/total levels, normalized to the control virus condition (PSD93: unpaired Student’s t-test ****p<0.0001, N = 12, 95% CI [0.44, 0.78]; GAP43: unpaired Student’s t-test p=0.40, N = 12, 95% CI [−0.063, 0.15]). (E) Quantified data from C, showing total PSD93 levels normalized to the control virus condition (unpaired Student’s t-test **p=0.0034, N = 12, 95% CI [0.12, 0.52]). Uncropped western blot images are in Figure 2—figure supplement 2.

Figure 2—source data 1. Source data for Figure 2B,D and E and for Figure 2—figure supplement 1B,D and E.

Figure 2.

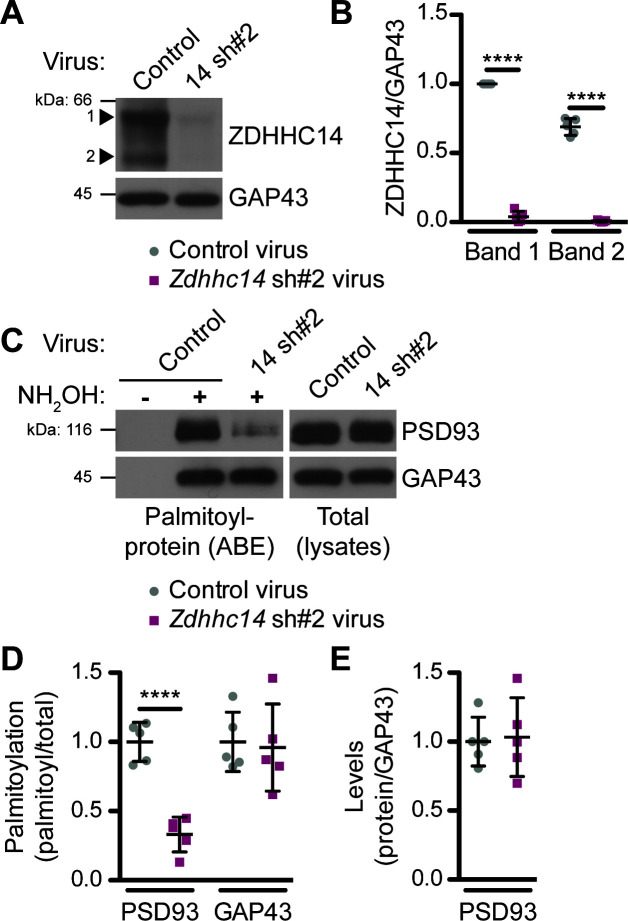
Figure 2—figure supplement 1. Additional Evidence that ZDHHC14 palmitoylates endogenous PSD93 in hippocampal neurons.

Figure 2—figure supplement 1.

(A) Hippocampal neurons were transduced with control or Zdhhc14 shRNA#2 (14 sh#2) lentivirus to knockdown Zdhhc14 on day in vitro (DIV) 9. Cultures were harvested on DIV16 and levels of ZDHHC14 (two bands, indicated by arrowheads) and GAP43 (loading control) were determined by western blotting. (B) Quantified intensity of the two ZDHHC14 bands from A, normalized to band ‘1’ in the control virus condition (2-way ANOVA: Virus p<0.0001 [F(1)=2614.0], band p<0.0001 [F(1)=114.3], interaction p<0.0001 [F(1)=75.41]; N = 5; Bonferroni post hoc test ****p<0.0001; 95% CI control versus 14sh#2 band 1 [–1.02,–0.90], control versus 14sh#2 band 2 [–0.74,–0.63]). (C) Palmitoyl-proteins (isolated by ABE; left panels) and total protein levels (in parent lysates; right panels) of PSD93 and GAP43, assessed by western blotting with the respective specific antibodies. (D) Quantifications of palmitoylation of PSD93 (left) and GAP43 (right) from C, normalized to the control virus condition (PSD93: unpaired Student’s t-test ****p<0.0001, N = 5, 95% CI [0.47, 0.86]; GAP43: unpaired Student’s t-test p=0.82, N = 5, 95% CI [−0.35, 0.43]). (E) Quantified PSD93 total levels from C, normalized to the control virus condition (unpaired Student’s t-test p=0.83, N = 5, 95% CI [−0.38, 0.31]). Uncropped western blot images are in Figure 2—figure supplement 2.
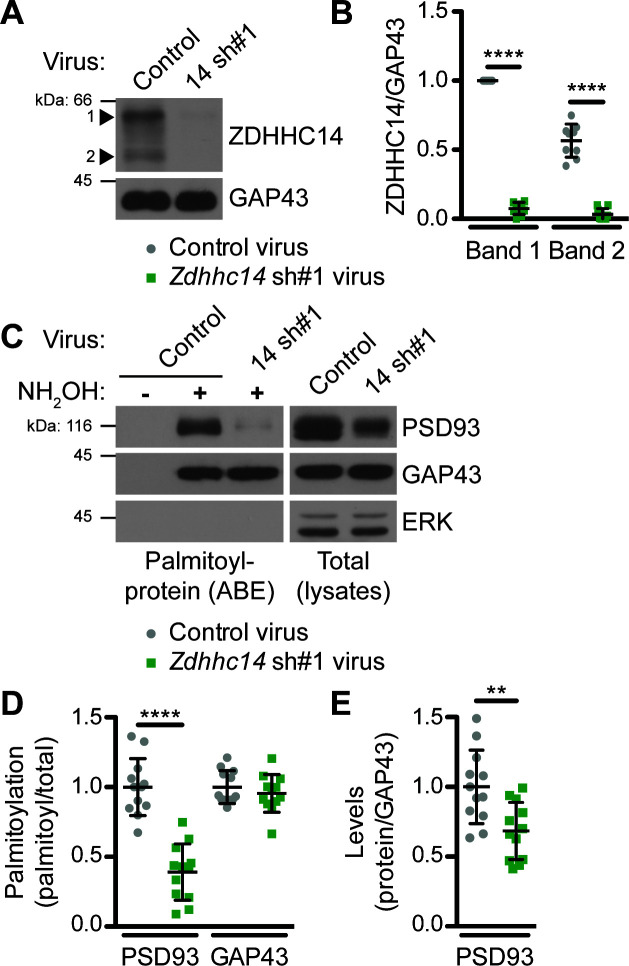
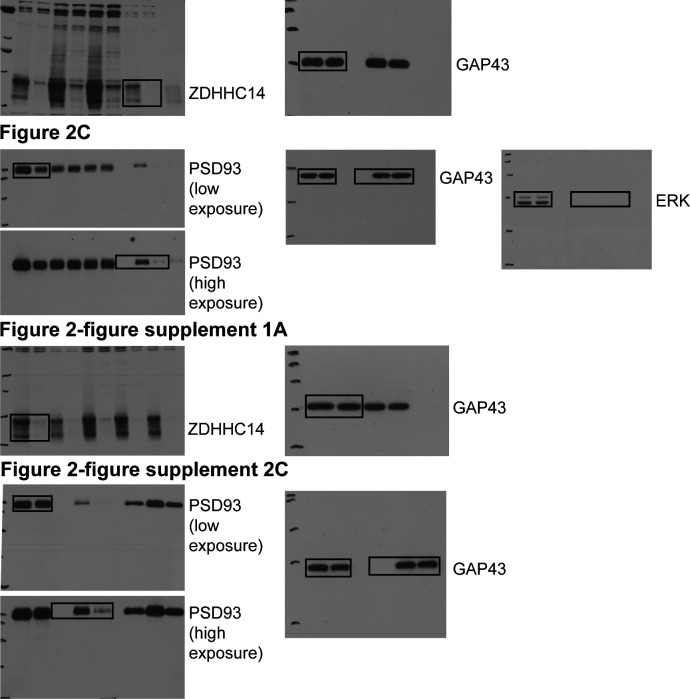
Figure 2—figure supplement 2. Uncropped Western blot images for Figure 2 and Figure 2—figure supplement 1.

Figure 2—figure supplement 2.

Bold titles indicate the figure that the uncropped images correspond to, boxes indicate cropped regions.