

Abstract
BACKGROUND
Marked progress is achieved in understanding the physiopathology of coronavirus disease 2019 (COVID-19), which caused a global pandemic. However, the CD4+ T cell population critical for antibody response in COVID-19 is poorly understood.
METHODS
In this study, we provided a comprehensive analysis of peripheral CD4+ T cells from 13 COVID-19 convalescent patients, defined as confirmed free of SARS-CoV-2 for 2 to 4 weeks, using flow cytometry and magnetic chemiluminescence enzyme antibody immunoassay. The data were correlated with clinical characteristics.
RESULTS
We observed that, relative to healthy individuals, convalescent patients displayed an altered peripheral CD4+ T cell spectrum. Specifically, consistent with other viral infections, cTfh1 cells associated with SARS-CoV-2–targeting antibodies were found in COVID-19 covalescent patients. Individuals with severe disease showed higher frequencies of Tem and Tfh-em cells but lower frequencies of Tcm, Tfh-cm, Tfr, and Tnaive cells, compared with healthy individuals and patients with mild and moderate disease. Interestingly, a higher frequency of cTfh-em cells correlated with a lower blood oxygen level, recorded at the time of admission, in convalescent patients. These observations might constitute residual effects by which COVID-19 can impact the homeostasis of CD4+ T cells in the long-term and explain the highest ratio of class-switched virus-specific antibody producing individuals found in our severe COVID-19 cohort.
CONCLUSION
Our study demonstrated a close connection between CD4+ T cells and antibody production in COVID-19 convalescent patients.
FUNDING
Six Talent Peaks Project in Jiangsu Province and the National Natural Science Foundation of China (NSFC).
Keywords: COVID-19, Immunology
Keywords: Adaptive immunity, Immunoglobulins, T cells

Introduction
Newly identified severe acute respiratory syndrome coronavirus 2 (SARS-CoV-2) has infected over 13 million people and caused more than 500,000 deaths globally (1–3). In the hospital, test-positive individuals with the virus are characterized as coronavirus disease 2019 (COVID-19) severe, moderate, or mild. Some patients develop acute respiratory distress syndrome (ARDS) and have low blood oxygen that requires intensive health care and a ventilator. Increasing evidence has shown that patients who recovered from COVID-19 developed protective neutralizing antibodies against SARS-CoV-2, raising hope for the development of effective antibody-based treatment as well as vaccinations for this contagious disease. Despite the fact that there have been a few studies that reviewed the broad immune defense toward COVID-19, the clear picture of adaptive immune cells that cooperatively impact this disease through antibody response is poorly studied.
A proportion of CD8+ T cells in both healthy individuals and patients with COVID-19 can recognize antigen from SARS-CoV-2 (4–6). However, CD8+ T cells often exhibit exhausted phenotypes in this disease (7, 8), together with markedly reduced cell counts in some severe patients. These facts raise concerns on the failure of CD8+ T cells to mediate cellular protection during the peak of the infection (9, 10). By contrast, clear evidence has shown that antibody treatment using convalescent plasma was effective for some patients with severe COVID-19, suggesting the existence of protective neutralizing antibodies made by individuals who recovered from this disease (11). Indeed, similar to patients infected by SARS and Middle East respiratory syndrome (MERS) (12–15), most patients with COVID-19 develop a virus-specific antibody response to SARS-CoV-2 (6, 16, 17). However, there are big gaps in understanding how T cells regulate effective antibody production as well as long-term humoral immune protection in COVID-19.
Human peripheral CD4+ T cells can be characterized as naive (CCR7+CD45RA+), central memory (CCR7+CD45RA–) and effector-memory (CCR7–CD45RA–) cells that respond differently during antigen re-exposure (18, 19). Patients recovered from SARS showed persistent memory CD4+ T cells that could be potentiated by spike protein (20). Mouse experiments also demonstrated boosting memory CD4+ T cells can protect mice from SARS and MERS infection (21). Thus, better understandings of these memory CD4+ T cells in COVID-19 convalescent patients could help us develop long-term host protection to this disease.
CD4+ T follicular helper (Tfh) cells are critical for high-affinity antibody response and successful vaccination during infection (22–24). Different from other CD4+ T cell lineage subsets, these cells are specialized in providing help to B cells for quality germinal center (GC) reaction (25). Human peripheral CXCR5+ circulating Tfh (cTfh) cells possess similar profiles and functionality to their bona fide counterparts in secondary lymphoid organs (26). A case report for one recovered COVID-19 patient showed the progressively increased frequency of CXCR5+ICOS+PD-1+ peripheral blood Tfh cells up to 20 days from onset of infection (5). Recent single-cell analysis also revealed the existence of Tfh cells in the bronchoalveolar lavage fluid (BALF) of patients with severe COVID-19 (27). Although less characterized, the majority of peripheral antigen-specific CD4+ T cells that were shown to correlate with antibody production in COVID-19 convalescent individuals may represent cTfh cells (4, 6). cTfh cells can be further defined as central memory like or effector memory like based on the expression of CCR7 and PD-1 (28–30). In particular, CCR7loPD-1+ effector memory–like cTfh cells in the peripheral circulation can indicate the bona fide Tfh cell activity and foster an antibody response against reexposure of antigen (29). Correspondingly, CXCR3+ subsets of cTfh cells were classified as cTfh1 cells and positively correlate with neutralizing antibody responses during HIV infection and induce virus-specific B cell response upon influenza vaccination (31, 32). On the contrary, regulatory T follicular (Tfr) cells can suppress the GC response required for high-affinity antibody formation (33–35). The immune profile of these Tfh-related cells in COVID-19 is largely unknown. Therefore, there is an urgent need to understand the role of these cells in COVID-19.
In this study, we provide a comprehensive analysis of CD4+ T cells in COVID-19 convalescent patients, defined as those patients who were confirmed free of SARS-CoV-2 for 2 to 4 weeks, and find that relative to healthy individuals, convalescent patients display an altered peripheral CD4+ T cell spectrum. Specifically, consistent with other viral infections, cTfh1 cells associate with the titers of SARS-CoV-2–targeting antibody, which is found to skew with disease severity. Individuals with more severe disease showed higher frequency of Tem and Tfh-em cells but a lower frequency of Tcm, Tfh-cm, and Tnaive cells, relative to healthy individuals and patients with mild and moderate disease. Interestingly, a higher frequency of cTfh-em cells correlated with a lower blood oxygen level in convalescent patients. These observations may give rise to the highest ratio of virus-specific IgG- or IgA-producing individuals in the group of patients with severe COVID-19 disease compared with those in the moderate and mild disease groups.
Results
Altered peripheral CD4+ T cell spectrum in COVID-19 convalescent patients.
To investigate the immune profile of CD4+ helper T cells, we collected blood samples from 13 convalescent patients who visited the hospital for reexamination 2 to 4 weeks after being confirmed free of SARS-CoV-2. The clinical characteristics of these convalescent patients at study entry are presented in Table 1, and their hospital COVID-19 diagnoses information presented in Supplemental Table 1; supplemental material available online with this article; https://doi.org/10.1172/JCI141054DS1 We also compared the clinical characteristics of these convalescent patients and 13 healthy individuals who participated in our study (Table 2). Most of the clinical metadata are comparable, including the similar median age (48 to 53 years, P = 0.7345) of healthy individuals and COVID-19 convalescent patients (Table 2).
Table 1. Clinical and pathological characteristics of COVID-19 convalescent patients.
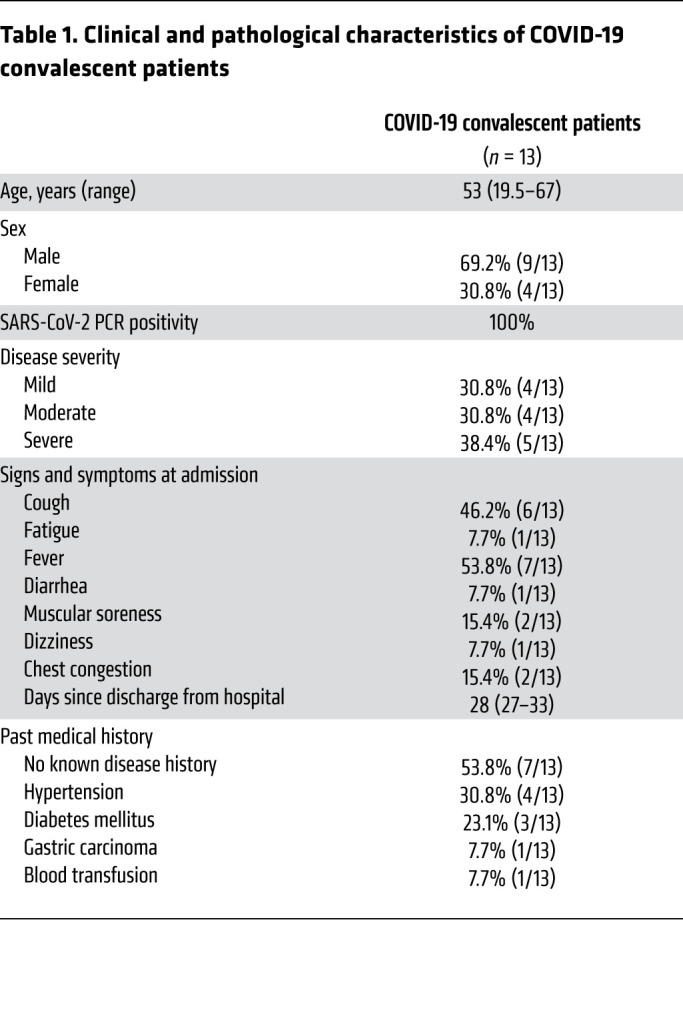
Table 2. Comparison of laboratory parameters between healthy individuals and COVID-19 convalescent patients.

To characterize CD4+ T cells, we first isolated peripheral blood mononuclear cells (PBMCs) from patients and healthy individuals for subsequent antibody staining. Using multicolor flow cytometry, we separated CD4+ T cells into naive (CD45RA+CCR7+), central memory (CD45RA–CCR7+), and effector memory (CD45RA–CCR7–) stages (Figure 1A) (18). Among these stages, we saw comparable naive CD4+ T cells between healthy individuals and convalescent patients with COVID-19 (Figure 1B). Interestingly, we noticed an about 2-fold reduction of the frequency of central memory CD4+ T cells, while there was an approximately 1.5-fold increase of effector-memory CD4+ T cells in convalescent patients (Figure 1B).
Figure 1. Peripheral CD4+ T cell subsets in COVID-19 convalescent patients.

Blood samples were collected from COVID-19 convalescent patients (n = 13) and healthy individuals (n = 13). PBMCs were isolated for antibody staining and FACs phenotyping of CD4+ T cells. (A) Gating strategies on naive CD4+ T cells (CD45RA+CCR7+), central-memory CD4+ T cells (CD45RA–CCR7+), and effector-memory CD4+ T cells (CD45RA–CCR7–). (B) Statistical analysis of the frequency of CD4+ Tnaive, CD4+ Tcm, and CD4+ Tem cells between healthy individuals and COVID-19 convalescent patients. (C) Gating strategies on different peripheral circulating CD4+ T cell subsets, including CD25–CD45RA–CXCR5+ cTfh cells, CCR7hiPD-1– central-memory cTfh (cTfh-cm) cells, CCR7loPD-1+ effector-memory cTfh (cTfh-em) cells, CXCR3+CCR6– cTfh (cTfh1) cells, CXCR3–CCR6– cTfh (cTfh2) cells, and CXCR3–CCR6+ cTfh (cTfh17) cells. Within CD3+CD8–CD4+ circulating T cells, Th1 cells were defined as CD25–CD45RA–CXCR3+CCR6– cells, Th2 cells as CD25–CD45RA–CXCR3–CCR6– cells, and Th17 cells as CD25–CD45RA–CXCR3–CCR6+ cells. Circulating Treg cells were defined as CD25+CD45RA–CD127– cells and cTfr cells as CD25+CD45RA–CD127–CXCR5hiPD-1hi cells. (D) FACs plot showing the representative cTfh-cm and cTfh-em cells between healthy individuals and COVID-19 convalescent patients. Quantifications on the frequency of these cells within cTfh cells (E) and CD4+ T cells (F). (G) Frequency of cTfh1, cTfh2, and cTfh17 cells within cTfh cells in healthy individuals and COVID-19 convalescent patients. (H) Statistical analysis showing the differences of the frequencies of Treg and cTfr cells between healthy individuals and COVID-19 convalescent patients, and the same analysis on Th1, Th2, and Th17 cells (I). (J) Histogram showing the PD-1 expression on Th1, Th2, and Th17 cells between healthy individuals and COVID-19 convalescent patients. HC, healthy control individuals (n = 13); CP, COVID-19 convalescent patients (n = 13). Each dot represents an individual subject. Bars represent the mean values. *P < 0.05 and **P < 0.01 by unpaired and 2-tailed Student’s t test.
To evaluate the peripheral presence of different subsets of CD4+ T cells, we established gating strategies based on the combination of signature surface molecules (Figure 1C). No difference was observed in the overall frequency of circulating Tfh cells between healthy individuals and COVID-19 convalescent patients (Supplemental Figure 1A). CCR7loPD-1+ effector-memory–like circulating Tfh (Tfh-em) cells can indicate the Tfh cell activity in the GCs of secondary lymphoid organs and can quickly differentiate into mature Tfh cells to potentiate an antibody response (28, 29). Indeed, within cTfh cells, the frequency of CCR7loPD-1+ Tfh-em cells is preferentially higher in convalescent patients compared with healthy individuals, and a correspondingly lower frequency of CCR7hiPD-1– central-memory–like circulating Tfh (Tfh-cm) cells has been found in COVID-19 convalescent patients (Figure 1D). Statistical analysis further confirmed these notions (Figure 1, E and F). These data suggest that the ongoing GC response may exist in convalescent patients after confirmation that they are virus free.
CXCR3+ Tfh cells in peripheral circulation positively correlate with the development of a protective antibody response against influenza (31). To study such connection in COVID-19 convalescent patients, we compared the expression of CXCR3 and CCR6 within cTfh cells to that in healthy individuals (Figure 1C). In line with the results from the influenza vaccination (31), the frequency of CXCR3+CCR6– cTfh1 cells is about 1.5-fold higher in COVID-19 convalescent patients than in healthy individuals (Figure 1G). This observation suggests that even in the recovery stage, patients with COVID-19 may have prolonged, cTfh1 cell–mediated viral-specific antibody production. Moreover, we also saw increased frequency of CXCR3–CCR6– cTfh 2 cells in COVID-19 convalescent patients. CXCR3–CCR6+ cTfh17 cells provide superior help to naive B cells for antibody production (26). However, we noticed a preferential loss of CXCR3–CCR6+ cTfh17 cells in COVID-19 convalescent patients (Figure 1G). Together, these data highlighted that cTfh cells were more activated in COVID-19 convalescent patients than in healthy individuals, and may regulate prolonged or memory antibody protection against SARS-CoV-2.
Treg cells and Tfr cells play important roles in constraining antibody response. In COVID-19 convalescent patients, we found a negligible difference in the frequency of peripheral Treg cells but a largely reduced frequency of CD45RA–CD127–CD25+CXCR5hiPD-1hi circulating Tfr cells (Figure 1H). Th1, Th2, and Th17 cells were examined by gating on CD25–CD45RA–CXCR5– CD4+ T cells and through surface expression of CXCR3 and CCR6 (Figure 1C). There is about a 2-fold increase of Th2 cells in COVID-19 convalescent patients, but trivial changes in Th1 and Th17 cells (Figure 1I). In line with other reports, the overall expression of PD-1 on these subsets is higher in convalescent patients (Figure 1J), whereby increased PD-1 expression can lead to either cell exhaustion or increased help to B cells. Collectively, our data suggest a widely altered spectrum of peripheral CD4+ T cells in COVID-19 convalescent patients.
Increased production of inflammatory cytokines in convalescent patients.
To understand the microenvironment where peripheral CD4+ T cells receive constant stimuli and which may lead to the altered spectrum, we measured 21 cytokines and chemokines that have large impacts on CD4+ T cells. Although in the recovery stage, COVID-19 convalescent patients generally have a cytokine profile in which inflammatory cytokine production is mildly increased (Figure 2A). In particular, we observed an around 4-fold higher level of IL-6 production (0.6192 to 2.233, mean; P = 0.0699) in COVID-19 convalescent patients (Figure 2B). A higher level of IL-1β (~1.8-fold, P = 0.0173) and a comparable level of IFN-γ was noticed in convalescent patients (Figure 2B). We also noticed that around 46% of COVID-19 convalescent patients displayed higher TNF-α (~2-fold, P = 0.0243, t test; P = 0.0456, Mann-Whitney U test), and surprisingly, exhibited a higher plasma level of CXCL11 (interferon inducible T cell alpha chemoattractant [ITAC]), the ligand that has the highest binding affinity to CXCR3 (~5 fold, 9.426 to 52.41, mean; P = 0.038, t test; P = 0.0338, Mann-Whitney U test) (Figure 2B) (36). It is possible that some convalescent patients may still have an ongoing GC reaction in lymph nodes due to long-term retention of virus proteins by FDC, thus these subsets of patients show increased cytokine production. There are trends of increased plasma levels of IL-5 and IL-21 in convalescent patients, whereas most of the other signature cytokines for Th2, Th17, and Treg cells remain intact (Figure 2B and Supplemental Figure 1B). Together, these findings described the peripheral cytokine profile related to CD4+ T cells and revealed that the plasma level of CXCL11 is preferentially higher in COVID-19 convalescent patients.
Figure 2. Peripheral cytokines and chemokines related to CD4+ T cells in COVID-19 convalescent patients.

Blood samples were collected from COVID-19 convalescent patients (n = 13) and healthy individuals (n = 13). Plasma samples were obtained after processing the blood to examine cytokines and chemokines using multiplex assay (Luminex xMAP). (A) Twenty-one cytokines and chemokines related to CD4+ T cells were detected. Unsupervised clustering was applied to generate the heatmap of cytokine profile between healthy individuals and COVID-19 convalescent patients. (B) Statistical analysis of proinflammatory cytokines, including IL-1β, IL-6, TNF-α, IFN-γ, and CXCL11. Plasma levels of IL-4, IL-5, IL-13, IL-17A, and IL-21 were measured and the differences between healthy individuals and COVID-19 convalescent patients were analyzed. Each dot represents an individual subject. Bars represent the mean values. *P < 0.05 and **P < 0.01 by unpaired and 2-tailed Student’s t test. Nonparametric Mann-Whitney U tests were used to determine the difference in highly skewed distributions such as IL-6, TNF-α, and CXCL11.
CXCR3-expressing cTfh1 cells correlate with a higher titer of SARS-CoV-2–specific antibody.
To understand antibody production in COVID-19 convalescent patients, we used plasma to measure SARS-CoV-2–specific IgG, IgM, and IgA. Viral nucleocapsid and spike proteins were purified and used for the detection. In line with recent reports, we observed higher viral-specific IgG, IgM, and IgA in convalescent patients compared with healthy individuals (Figure 3A). There were negligible differences on antibody production between sexual phenotypes or correlated to age (Figure 3B, Supplemental Figure 2A, Supplemental Figure 3A, and Supplemental Figure 4A).
Figure 3. cTfh1 cells correlate with a higher titer of SARS-CoV-2–specific antibody.

Blood samples were collected from COVID-19 convalescent patients (n = 13) and healthy individuals (n = 13). Plasma samples were obtained after processing the blood to detect the antibodies specific to SARS-CoV-2 using chemiluminescent immunoassays. (A) IgG, IgM, and IgA were measured. (B) Statistical analysis of the IgG, IgM, and IgA antibody production between male and female participants, including both healthy individuals and COVID-19 convalescent patients. (C) Correlation analysis on cTfh1 cells, cTfh2 cells, cTfh17 cells, and SARS-CoV-2–specific IgG antibody titer. (D) Correlation between cTfh1 cells, cTfh2 cells, cTfh17 cells, and SARS-CoV-2–specific IgM antibody titer. (E) Correlation analysis on cTfh1 cells, cTfh2 cells, cTfh17 cells, and SARS-CoV-2–specific IgA antibody titer. (F) Correlation between cTfr cells and SARS-CoV-2–specific IgG, IgM and IgA antibody titer. Each dot represents an individual subject. Bars represent the mean values. Measured chemiluminescence values divided by the cutoff (S/CO) were used to present the antibody level. *P < 0.05 and **P < 0.01 by unpaired and 2-tailed Student’s t test or 2-tailed Pearson correlation coefficient.
cTfh1 cells shape memory B cell response and correlate with the quantity and avidity of neutralizing antibody reaction during HIV, influenza, and ZIKV viral infections (31, 32, 37–39). To examine this correlation in COVID-19, we performed Pearson correlation coefficient analysis on data from convalescent patients. As shown in Figure 3C, cTfh1 cells positively correlate with the magnitude of viral-specific IgG (R = 0.5614, P = 0.0459), whereas cTfh2 cells do not show any correlation (R = 0.2953, P = 0.3273). Although not statistically significant, there is a trend of negative correlation between cTfh17 cells and the magnitude of viral-specific IgG (R = –0.4352, P = 0.1372) (Figure 3C). Similar results were found on viral-specific IgM (Figure 3D). We also noticed a mild correlation between cTfh1 cells and viral-specific IgA in patient blood (R = 0.5043, P = 0.0789), but not from cTfh2 and cTfh17 cells (Figure 3E). No correlations between cTfh cells, cTfh-em/cTfh-cm cells, and antibody titers were noticed (Supplemental Figure 2, B and C; Supplemental Figure 3, B and C; and Supplemental Figure 4, B and C). Of note, we did not observe correlations among other CD4+ T cell subsets, including CXCR3+ Th1 cells and antibody titers (Supplemental Figure 2, D and E; Figure 3, D and E; and Figure 4, D and E). Interestingly, we found a trend of inverse correlation between cTfr cells and the magnitude of SARS-CoV-2–specific IgG and IgM antibody titers, as well as a statistical difference (R = –0.5649, P = 0.0443) on such correlation between cTfr cells and SARS-CoV-2–specific IgA (Figure 3F). These results indicate that regulatory cells constraining antibody response may be the limiting factor of viral-specific antibody production in COVID-19 convalescent patients (Figure 3F). Taken together, these results revealed that cTfh1 cells are vital for the titer of high-quality antibodies against SARS-CoV-2.
Figure 4. Peripheral CD4+ T cells in different groups of COVID-19 convalescent patients.

COVID-19 convalescent patients were categorized into mild (n = 4), moderate (n = 4), and severe (n = 5) groups based on their diagnosis certificates during admission at hospital. (A) Representative chest CT images of patients during admission and convalescence. (B) Ages of convalescent patients in different groups. (C) Blood oxygen level indicated by PaO2/FiO2 in convalescent patients of different groups. (D) Statistics showing the peripheral CD4+ T cell subsets in healthy individuals and different groups of COVID-19 convalescent patients. Healthy individuals (n = 13). (E) Correlation of peripheral CD4+ T cell subsets and PaO2/FiO2 in convalescent patients. Each dot represents an individual subject. Box plot show minimum to maximum. *P < 0.05 and **P < 0.01 by 1-way ANOVA test (B–D) or 2-tailed Pearson correlation coefficient (E). Two-tailed, nonparametric Mann-Whitney U tests were used in highly skewed distributions (D: Tnaive, Tfh-cm, Tfh-em, Tfr).
Peripheral CD4+ T cells in COVID-19 convalescent patients recovering from different disease severities.
To further investigate the connection between peripheral CD4+ T cells and the clinical characteristics of COVID-19, 13 COVID-19 convalescent patients were categorized into mild (n = 4), moderate (n = 4), and severe (n = 5) groups based on their diagnosis certificates during hospital admission, which are in line with the Diagnosis and Treatment Protocol for COVID-19 (Trial Version 7) and the WHO guidance. The representative chest CT images at both admission and convalescence from individuals in each group are shown in Figure 4A. In our cohort, more elderly patients were in the group with severe disease (Figure 4B). We also retrospectively looked into the data of arterial oxygen tension (PaO2) over inspiratory oxygen fraction (FiO2) from each convalescent patient, measured during hospital admission, to understand the blood oxygen levels at the time (n = 12; we were without record of this measurement for one convalescent patient classified as moderate). Statistical analysis showed that a PaO2/FiO2 index lower than 300 mmHg was consistently found in all convalescent patients in the severe group (Figure 4C). We did not have access to the measurement of PaO2/FiO2 in healthy individuals.
Previous disease severity may have long-term residual effects on the homeostasis of peripheral CD4+ T cells in individuals recovered from COVID-19. To establish the connection between CD4+ T cell and disease severity, we studied the representation of peripheral CD4+ T cells in each group of convalescent patients. We found that Tnaive and Tcm cells remained low in the moderate group and were further reduced in the severe group of convalescent patients, whereas Tem cells were increased in the severe group (Figure 4D). Similar trends were found with Tfh-cm and Tfh-em cells in convalescent patients (Figure 4D). However, the subpopulations of Tfh cells (cTfh1, cTfh2, and cTfh17) are not significantly changed among different groups of severity (Figure 4D), despite their overall changes compared with healthy individuals. Meanwhile, low frequency of Tfr cells was observed in all convalescent patients, although such low frequency is not further reduced in severe group (Figure 4D). The frequency of Treg cells remained largely unaffected while we did see more Th2 cells in the severe group (Supplemental Figure 5A). These results suggest that there are close connections between severity of COVID-19 and the homeostasis of Tfh, Tfr, and Th2 cells in the convalescent stage. Residual effects from the peak period of COVID-19 may also potentiate the generation of Tem cells and the reduction of Tcm and Tnaive cells.
To understand whether blood oxygen level is one of the factors that contributes to the residual effect that has affected the homeostasis of peripheral CD4+ T cells in COVID-19 convalescent patients, we conducted a correlation analysis between PaO2/FiO2 index and peripheral CD4+ T cells. No significant differences were found on the correlation analysis between PaO2/FiO2 and the frequencies of Tnaive, Tcm, and Tem cells (Figure 4E). However, we noticed that the frequency of cTfh-cm cells positively correlated with PaO2/FiO2 (R = 0.519, P = 0.08), whereas the frequency of cTfh-em cells had a tight and negative correlation with PaO2/FiO2 (R = –0.721, P < 0.01) (Figure 4E). Of note, PaO2/FiO2 is not strongly correlated with the frequency of cTfr cells, Tfh subpopulations (cTfh1, cTfh2, and cTfh17), and other CD4+ subsets (Figure 4E and Supplemental Figure 5B). Notably, we considered other factors that may contribute to the residual effect, but we did not find strong correlation, for example, between age and the frequency of peripheral CD4+ T cells, except the reduction of Tnaive cells and the increase of Tem cells were significantly correlated with the age factor in convalescent patients (Supplemental Figure 5C).
Antibody response in different groups of COVID-19 convalescent patients.
To understand the potential consequences of increased frequency of cTfh-em cells in the severe group, we evaluated the titers of IgG, IgM, and IgA but did not see differences among patient groups (Figure 5A and Supplemental Figure 5D). Using the cutoff value of 1 (blue dash line in Figure 5A and Supplemental Figure 5D) generated from large numbers of testing, we classified the convalescent patients as positive (greater than 1) or negative to each antibody type based on the antibodies they produced (40). Intriguingly, the IgM and/or IgG positive ratio in different groups of convalescent patients were clearly different in our cohort, where more IgM+ patients were found in the mild group and more IgG+ patients were observed in the severe group (Figure 5B). Similar observations were noticed with IgA (Supplemental Figure 5E). These data may imply that the activity of class switching and the generation of memory B cells that requires activated Tfh cells are particularly high in those who had severe COVID-19.
Figure 5. Antibody response in different groups of COVID-19 convalescent patients.

(A) Antibody titer of SARS-CoV-2–specific IgG and IgM from convalescent patients in different groups. (B) Ratio of IgM+ (grey), IgG+ (red), IgM+ IgG+ (orange), and IgM– IgG– (white) individuals (based on the produced antibody type) in mild, moderate, and severe groups. Percentages in the central circle represent the ratio of IgG+ individuals in each group.
Discussion
Emerging evidence revealed that patients who recovered from COVID-19 produced robust antibodies against SARS-CoV-2, which required participation from T and B cells. Here, we showed that in COVID-19 convalescent patients who were recently discharged from the hospital, peripheral CD4+ helper T cells were more activated as effector memory cells. Correspondingly, we showed that convalescent patients had a higher frequency of effector memory cTfh cells. One subset of cTfh cells, CXCR3+ cTfh1 cells, positively correlates with plasma virus–specific IgG and IgM titers in convalescent patients, which is in line with the observations found in influenza, HIV, and ZIKA virus infections. Convalescent patients diagnosed as being in severe condition in the hospital exhibited higher frequencies of Tem and Tfh-em cells and lower frequencies of Tcm, Tfh-cm, and Tnaive cells than those convalescent patients diagnosed as being in moderate and mild condition. Of note, the frequency of Tfh-em cells negatively correlates with blood oxygen level (PaO2/FiO2, mmHg), and these cells may contribute to the production of class-switched IgG antibody in COVID-19 convalescent patients. Thus, our study depicts the immune profile of peripheral CD4+ T cell subsets and demonstrates the close association between Tfh cells and the virus-specific antibody production in COVID-19 convalescent patients.
Memory CD4+ T cells provide superior protection upon virus reinfection. Our data suggested that 2 to 4 weeks after being declared virus-free, most convalescing patients showed increased frequency of effector memory–like CD4+ T cells, which is in line with the previous report on preprints (41). This observation indicates that CD4+ T cells might actively respond to the reformed host microenvironment after COVID-19 for a prolonged period of time. Responses might include clearing the latent SARS-CoV-2 in the reservoir cells or the formation of tissue resident memory (Trm) response in the lung or other damaged tissues. In fact, CD4+ Trm response is well characterized in infections such as influenza or mouse lymphocytic choriomeningitis virus (42, 43). We acknowledge the limitation that the study on memory cells should include more parameters, such as Ki-67, CD127, CD62L, or BCL-2 (44, 45). Nevertheless, in this study, patients were strictly discharged from the hospital only after being tested with at least 2 negative nucleic acid qPCR results for SARS-CoV-2, and blood samples were collected from convalescent patients around 50 days after infection. Thus, due to the lack of antigen and the infection phase, we cautiously consider that most effector memory– or central memory–like CD4+ T cells are presumed memory cells (44, 46).
One key observation from our data is the increased frequency of cTfh-em and cTfh1 cells in COVID-19 convalescent patients. It has thus inspired us to interrogate whether these increases are connected with antibody production or clinical characteristics. Indeed, CXCR3+ cTfh1 cells are positively associated with the magnitude of SARS-CoV-2–specific antibody titers. Most human SARS-CoV-2–specific IgG shows strong activity in neutralizing virus (6, 47, 48). Our results imply that future immunomodulation of cTfh1 cells might have profound impacts on the production of neutralizing antibody production in patients with COVID-19. Moreover, our data suggest that CXCL11, the ligand with highest binding affinity to CXCR3, is highly accumulated in COVID-19 convalescent patients. This observation is consistent with reports showing that the other 2 CXCR3 ligands, CXCL9 and CXCL10, are highly produced in both active or recovered patients with COVID-19 (49, 50), while CXCL11 is far less studied in this disease. There could be multiple reasons that increased peripheral level of CXCL11 may be related to different T cell responses in COVID-19 convalescent patients. Both CXCL11 and CXCR3 are induced following IFN-γ and IFN-β (51), therefore they are likely related to the overall activated Th1 response, where we noticed increased PD-1 expression in Th1 cells. It is also possible that as a high-affinity chemoattractant, high CXCL11 may coordinate the distribution of circulating Tfh cells into tissues to form resident memory, whereby they could quickly respond to antigen reexposure at barriers, such as inducible bronchus-associated lymphoid tissue, and provide help to local resident memory B cells and CD8+ T cells for protection (52–56). Single-cell analysis has supported this speculation with data showing the existence of infiltrated Tfh cells in the airway of patients with COVID-19 (27). Of note, although higher PD-1 expression was observed in Th1 cells, which may lead to their function as helpers to B cells (57), we did not see a statistically increased frequency of these cells and their correlation to antibody production in convalescent patients.
Interestingly, our data showed that the frequency of cTfh-em cells is preferentially higher and the frequency of cTfh-cm cells is lower in convalescent patients compared with healthy individuals, accompanied by similar results on Tem and Tcm cells. Indeed, this observation is supported by a recent study on preprints (58). Based on the hospital admission diagnoses of illness, COVID-19 convalescent patients were assigned into severe, moderate, and mild groups. Using this categorizing strategy, we revealed that convalescent patients in the severe group displayed the highest frequency of cTfh-em cells but the lowest frequency of cTfh-cm cells compared with those frequencies in convalescent patients in the mild or moderate groups. Although we did not see antibody titer changes among these 3 groups where cTfh-em cells might have had an impact, we noticed that the ratio of patients producing SARS-CoV-2 IgG or IgA antibody was higher in convalescent patients previously diagnosed with severe condition. This result suggests that Ig class switching to IgG and/or IgA and ongoing GC response that requires participation of activated Tfh cells in secondary lymphoid organs might be essential for patients to recuperate from severe COVID-19. Meanwhile, IgM antibody was found to be preferentially produced by convalescent patients who had mild symptoms in the hospital. This might suggest that the ability to produce virus-specific IgM antibody early after infection could result in mild symptoms and faster recovery. We acknowledge that our sample size is limited due to the availability and accessibility of patient samples. More studies are encouraged to elucidate these important connections.
Blood oxygen level is used to estimate the disease severity and the requirement of a ventilator. We found that cTfh-em cells negatively correlate with recorded PaO2/FiO2. These data not only support the notion of increased frequency of cTfh-em cells in convalescent patients with severe disease, but also indicate that low blood oxygen, which can cause hypoxia, may have a large impact on the homeostasis of cTfh-em cells in patients after COVID-19. The metabolic profiles of the microenvironment from both active and recovered COVID-19 individuals are largely unknown. Our data, however, have revealed that hypoxia might constitute the residual effects of COVID-19, which could regulate the frequency and duration of activated cTfh cells and impact their relationship with antibody production. In fact, GC response is in favor of hypoxia (59). And hypoxia can trigger glycolysis that supports the effector memory T cells as well as the long-lived Tfh cells (60–62). Notably, we did not rule out other important possibilities that can give rise to a higher frequency of cTfh-em cells in severe patients after recovery. It has been reported that similar to patients infected by SARS-CoV-1, patients with severe COVID-19 have a higher virus load and longer duration of viral shedding period than mild patients (63, 64). Higher titer and prolonged shedding of virus might enhance the activation and duration of antigen presentation to Tfh cells (65, 66), which could lead to the increased frequency of cTem and cTfh-em cells in patients with severe COVID-19 after recovery. While undetectable, there might also be latent SARS-CoV-2 virus in the reservoir cells in severe patients that could lead to prolonged activation of T cells (67, 68). These observations constitute important compartments of COVID-19 immunology (69), and are factors that need to be considered in future antibody-based therapeutics and vaccination design for this contagious disease.
Methods
COVID-19 convalescent patients.
Blood samples from 13 laboratory-confirmed COVID-19 convalescent patients were collected from the Fifth People’s Hospital of Wuxi, China, from March to April 2020. The Fifth People’s Hospital of Wuxi is the city’s designated hospital for treating patients with COVID-19. All enrolled patients were confirmed to be convalescent by a negative-detection virus test and being symptom free before being allowed to be discharged from the hospital. All patient data were anonymized before study inclusion (Supplemental Table 1).
The illness of COVID-19 has been defined as mild, moderate, or severe based on the WHO interim guidance (WHO reference WHO/2019-nCoV/clinical/2020.4) and the Diagnosis and Treatment Protocol for COVID-19 (Trial Version 7).
Healthy individuals.
Thirteen healthy individuals were enrolled from the Affiliated Hospital of Jiangnan University, Wuxi, China. All healthy individuals had no known history of any significant systemic diseases, including, but not limited to, autoimmune disease, diabetes, allergic disease, kidney or liver disease, or malignancy. Overall clinical characteristics of COVID-19 convalescent patients and healthy individuals are provided in Table 1 and Table 2.
Isolation of human PBMCs.
Blood samples from healthy individuals (n = 13) and COVID-19 convalescent patients (n = 13) were collected in EDTA-2K tubes (BD Biosciences). Blood was diluted with PBS (1:1) and then gently loaded to a Ficoll-Paque Plus (GE) layer at the ratio of 1:1 followed by density gradient centrifugation (400g, 20°C, 20 minutes). Plasma samples were aliquoted and stored at –80°C after density gradient centrifugation. FBS containing 10% dimethyl sulfoxide was used to resuspend the cell after thorough wash. Cells were then cryopreserved in liquid nitrogen until further use.
Measurement of basic clinic parameters.
Kappa light chain (KAP), lambda light chain (LAM), complement 3 (C3), complement 4 (C4), anti-streptolysin O (ASO), and C reactive protein (CRP) in plasma were tested using the IMMAGE 800 Immunochemistry System (Beckman Coulter) according to the manufacturer’s instructions. Briefly, plasma samples were mixed with antibodies specific to each protein to form immune complexes during antigen-antibody reaction. Increased rates of light scattered from particles in reaction solution were measured. The intensity of the scattered light was converted to the concentration of each protein in the sample. The result was evaluated by comparison with standards.
Measurement of cytokine and chemokine using MILLIPLEX assay.
Aliquots of plasma samples were evaluated using a human high-sensitivity T cell panel (21-plex) kit (MILLIPLEX, Merck), according to the manufacturer’s instructions. Plasma samples were mixed with beads coated with capture antibodies specific for CX3CL1, GM-CSF, IFN-γ, IL-1β, IL-2, IL-4, IL-5, IL-6, IL-7, IL-8 (CXCL8), IL-10, IL-12, IL-13, IL-17A, IL-21, IL-23, CXCL11, MIP-1α (CCL3), MIP-1β (CCL4), MIP-3α (CCL20), and TNF-α and incubated overnight (16–18 hours) at 4°C. Beads were washed and incubated with biotin-labeled detection antibodies for 1 hour at room temperature (20°C–25°C), followed by a final incubation with streptavidin-phycoerythrin for 30 minutes at room temperature (20°C–25°C). After the final wash, beads were resuspended with Sheath Fluid until analyzed by Luminex MAGPIX. Analysis was performed using MILLIPLEX Analyst 5.1.
Measurement of SARS-CoV-2–specific IgG, IgM, and IgA antibodies.
The concentrations of anti–SARS-CoV-2 IgG and IgM in plasma samples were measured by magnetic chemiluminescence enzyme immunoassay kits (Bioscience), according to the manufacturer’s protocols. The measurement was developed from a double-antibody sandwich immunoassay. There are 3 main components: alkaline phosphatase–conjugated anti-human IgG/IgM antibody, the recombinant antigens containing the nucleoprotein and a peptide from the spike protein of SARS-CoV-2 conjugated with FITC, and anti-FITC antibody–conjugated magnetic particles. The tests were conducted on an automated magnetic chemiluminescence analyzer (Axceed 260, Bioscience) according to the manufacturer’s instructions.
A SARS-CoV-2–specific IgA detection kit using the chemiluminescent method was developed by Kangrun Biotech, in which the receptor binding domain of spike protein was coated onto magnetic particles to catch SARS-CoV-2–specific IgA in patient samples. A secondary antibody that recognizes human IgA was used for detection. The detected chemiluminescent signal over background signal was calculated as relative light units (RLU). The method has been validated in a large cohort of serum samples showing high sensitivities and specificities (40). Patient serum samples were collected by centrifugation and diluted 40 times using the dilution buffer before testing.
Cut-off index (S/CO) is the ratio of RLU signal divided by cut-off value. The cut-off values were recommended by the company according to large numbers of testing. A S/CO value greater than 1 suggests a positive result in antibody testing. The antibody level was measured with chemiluminescence values divided by the cutoff (S/CO) and calculated as log2 (S/CO + 1) (Figure 3 and Figure 5).
Antibody staining and flow cytometry.
Before antibody staining, frozen PBMCs were thawed and carefully washed. Cells were then resuspended in complete RPMI containing 10% FBS, 10 mM HEPES, 1× Penicillin-streptomycin-glutamate (PSG) solution (Gibco), 1 mM sodium pyruvate, 55 μM 2-mercaptoethanol). Around 1 × 10⁶ cells were plated with FACs buffer, which was PBS containing 2% heat-inactivated FBS (Gibco). Fc-receptor blocking antibodies (Human BD Fc Block; Becton Dickinson) were used to block nonspecific staining on human lymphocytes for 15 minutes on ice.
For surface staining, cells were washed once with FACs buffer and incubated for 30 minutes at 25°C in the dark with the following monoclonal antibodies at predetermined optimal dilutions, and 7-Aminoactinomycin D (7-AAD) was used to exclude dead cells, CD8-FITC (1:200), CD279-PerCP Cy5.5 (1:50), CD25-PE CF594 (1:100), CD197-PE Cy7 (1:50), CD185-Alexa Fluor 647 (1:50), CD4-Alexa Fluor 700 (1:100), CD3-BV510 (1:100), TIM-3-PE (1:100), CD127-BV421 (1:100), CD196-PE (1:100), CD45RA-APC/Cyanine7 (1:200), and CD183-BV421 (1:100). Following surface staining, cells were washed twice with FACs buffer and kept at 4°C throughout the acquisition by NAVIOS flow cytometer (Beckman Coulter). Data were analyzed using FlowJo (version 10) software. Antibody information is presented in Supplemental Table 2.
Quantification and statistics.
An algorithm from Heatmap.2 (gplots package version 3.0.1.1) was used to generate a heatmap of the plasma level of proteins via R version 3.6.1. Statistical analysis on all experimental data was performed by unpaired and 2-tailed Student’s t test, 1-way ANOVA (groups over 2), or 2-tailed Pearson correlation coefficient analysis using GraphPad Prism 8.0 software. Two-tailed, nonparametric Mann-Whitney U tests were used in highly skewed distributions. All values were expressed as the mean; bar graphs indicate the mean value; box plots represent minimum to maximum. Mann-Whitney U test was used to examine basic clinical characteristics of all participants. Differences were considered to be statistically different at *P < 0.05, **P < 0.01.
Study approval.
This study was conducted in accordance with the Declaration of Helsinki. All experimental procedures were approved by the ethics committee at Fifth People’s Hospital of Wuxi (2020-034-1). Written informed consent was waived by the ethics committee of the designated hospital (Fifth People’s Hospital of Wuxi) for emerging infectious diseases. The medical ethical committee at the Affiliated Hospital of Jiangnan University approved the collection of samples from 13 healthy individuals (IEC2020052601). Written informed consent was obtained from all healthy subjects included in the study.
Author contributions
PZ conceived and oversaw the study. PZ designed the experiments. FG, YD, and DZ performed the experiments. PZ, FG, TZ, LC, DZ, HW, TJ, YD, and ML analyzed the data. TJ, HP, and DY participated in scientific discussion. PZ wrote and revised the manuscript and led the submission.
Supplementary Material
Acknowledgments
We thank the patients and healthy individuals for their participation in our study. We thank Carola G. Vinuesa for constructive suggestions on the manuscript revision. This study was supported by Six Talent Peaks Project in Jiangsu Province (2017-WSN-186 to FG), and the National Natural Science Foundation of China (NSFC) grant 81970759 (to TZ and PZ).
Version 1. 08/25/2020
In-Press Preview
Version 2. 11/03/2020
Electronic publication
Version 3. 12/01/2020
Print issue publication
Footnotes
Conflict of interest: The authors have declared that no conflict of interest exists.
Copyright: © 2020, American Society for Clinical Investigation.
Reference information: J Clin Invest. 2020;130(12):6588–6599.https://doi.org/10.1172/JCI141054.
Contributor Information
Fang Gong, Email: gongfang2004@163.com.
Yaping Dai, Email: daiyapingcat@qq.com.
Ting Zheng, Email: ting081226@hotmail.com.
Liang Cheng, Email: 86818443@qq.com.
Dan Zhao, Email: zhdan123@mail.ustc.edu.cn.
Hao Wang, Email: howard.wang@anu.edu.au.
Min Liu, Email: liu_min1118@163.com.
Hao Pei, Email: peihao1008@126.com.
Tengchuan Jin, Email: jint@ustc.edu.cn.
Di Yu, Email: di.yu@uq.edu.au.
Pengcheng Zhou, Email: pengcheng.zhou@anu.edu.au.
References
- 1.Dong E, Du H, Gardner L. An interactive web-based dashboard to track COVID-19 in real time. Lancet Infect Dis. 2020;20(5):533–534. doi: 10.1016/S1473-3099(20)30120-1. [DOI] [PMC free article] [PubMed] [Google Scholar]
- 2.Wang C, Horby PW, Hayden FG, Gao GF. A novel coronavirus outbreak of global health concern. Lancet. 2020;395(10223):470–473. doi: 10.1016/S0140-6736(20)30185-9. [DOI] [PMC free article] [PubMed] [Google Scholar]
- 3.Zhu N, et al. A novel coronavirus from patients with pneumonia in China, 2019. N Engl J Med. 2020;382(8):727–733. doi: 10.1056/NEJMoa2001017. [DOI] [PMC free article] [PubMed] [Google Scholar]
- 4.Grifoni A, et al. Targets of T cell responses to SARS-CoV-2 coronavirus in humans with COVID-19 disease and unexposed individuals. Cell. 2020;181(7):1489–1501.e15. doi: 10.1016/j.cell.2020.05.015. [DOI] [PMC free article] [PubMed] [Google Scholar]
- 5.Thevarajan I, et al. Breadth of concomitant immune responses prior to patient recovery: a case report of non-severe COVID-19. Nat Med. 2020;26(4):453–455. doi: 10.1038/s41591-020-0819-2. [DOI] [PMC free article] [PubMed] [Google Scholar]
- 6.Ni L, et al. Detection of SARS-CoV-2-specific humoral and cellular immunity in COVID-19 convalescent individuals. Immunity. 2020;52(6):971–977.e3. doi: 10.1016/j.immuni.2020.04.023. [DOI] [PMC free article] [PubMed] [Google Scholar]
- 7.Zheng HY, et al. Elevated exhaustion levels and reduced functional diversity of T cells in peripheral blood may predict severe progression in COVID-19 patients. Cell Mol Immunol. 2020;17(5):541–543. doi: 10.1038/s41423-020-0401-3. [DOI] [PMC free article] [PubMed] [Google Scholar]
- 8.Zheng M, et al. Functional exhaustion of antiviral lymphocytes in COVID-19 patients. Cell Mol Immunol. 2020;17(5):533–535. doi: 10.1038/s41423-020-0402-2. [DOI] [PMC free article] [PubMed] [Google Scholar]
- 9.Xu Z, et al. Pathological findings of COVID-19 associated with acute respiratory distress syndrome. Lancet Respir Med. 2020;8(4):420–422. doi: 10.1016/S2213-2600(20)30076-X. [DOI] [PMC free article] [PubMed] [Google Scholar]
- 10.Chen G, et al. Clinical and immunological features of severe and moderate coronavirus disease 2019. J Clin Invest. 2020;130(5):2620–2629. doi: 10.1172/JCI137244. [DOI] [PMC free article] [PubMed] [Google Scholar]
- 11.Shen C, et al. Treatment of 5 critically ill patients with COVID-19 with convalescent plasma. JAMA. 2020;323(16):1582–1589. doi: 10.1001/jama.2020.4783. [DOI] [PMC free article] [PubMed] [Google Scholar]
- 12.Ko JH, et al. Serologic responses of 42 MERS-coronavirus-infected patients according to the disease severity. Diagn Microbiol Infect Dis. 2017;89(2):106–111. doi: 10.1016/j.diagmicrobio.2017.07.006. [DOI] [PMC free article] [PubMed] [Google Scholar]
- 13.Vijay R, Perlman S. Middle East respiratory syndrome and severe acute respiratory syndrome. Curr Opin Virol. 2016;16:70–76. doi: 10.1016/j.coviro.2016.01.011. [DOI] [PMC free article] [PubMed] [Google Scholar]
- 14.Li G, Chen X, Xu A. Profile of specific antibodies to the SARS-associated coronavirus. N Engl J Med. 2003;349(5):508–509. doi: 10.1056/NEJM200307313490520. [DOI] [PubMed] [Google Scholar]
- 15.Hsueh PR, Huang LM, Chen PJ, Kao CL, Yang PC. Chronological evolution of IgM, IgA, IgG and neutralisation antibodies after infection with SARS-associated coronavirus. Clin Microbiol Infect. 2004;10(12):1062–1066. doi: 10.1111/j.1469-0691.2004.01009.x. [DOI] [PMC free article] [PubMed] [Google Scholar]
- 16.Long QX, et al. Antibody responses to SARS-CoV-2 in patients with COVID-19. Nat Med. 2020;26(6):845–848. doi: 10.1038/s41591-020-0897-1. [DOI] [PubMed] [Google Scholar]
- 17.Cao Y, et al. Potent neutralizing antibodies against SARS-CoV-2 identified by high-throughput single-cell sequencing of convalescent patients’ B cells. Cell. 2020;182(1):73–84.e16. doi: 10.1016/j.cell.2020.05.025. [DOI] [PMC free article] [PubMed] [Google Scholar]
- 18.Sallusto F, Lenig D, Förster R, Lipp M, Lanzavecchia A. Two subsets of memory T lymphocytes with distinct homing potentials and effector functions. Nature. 1999;401(6754):708–712. doi: 10.1038/44385. [DOI] [PubMed] [Google Scholar]
- 19.Sallusto F, Geginat J, Lanzavecchia A. Central memory and effector memory T cell subsets: function, generation, and maintenance. Annu Rev Immunol. 2004;22:745–763. doi: 10.1146/annurev.immunol.22.012703.104702. [DOI] [PubMed] [Google Scholar]
- 20.Yang LT, et al. Long-lived effector/central memory T-cell responses to severe acute respiratory syndrome coronavirus (SARS-CoV) S antigen in recovered SARS patients. Clin Immunol. 2006;120(2):171–178. doi: 10.1016/j.clim.2006.05.002. [DOI] [PMC free article] [PubMed] [Google Scholar]
- 21.Zhao J, et al. Airway memory CD4(+) T cells mediate protective immunity against emerging respiratory coronaviruses. Immunity. 2016;44(6):1379–1391. doi: 10.1016/j.immuni.2016.05.006. [DOI] [PMC free article] [PubMed] [Google Scholar]
- 22.Vinuesa CG, Linterman MA, Yu D, MacLennan IC. Follicular helper T cells. Annu Rev Immunol. 2016;34:335–368. doi: 10.1146/annurev-immunol-041015-055605. [DOI] [PubMed] [Google Scholar]
- 23.Crotty S. T follicular helper cell differentiation, function, and roles in disease. Immunity. 2014;41(4):529–542. doi: 10.1016/j.immuni.2014.10.004. [DOI] [PMC free article] [PubMed] [Google Scholar]
- 24.Locci M, et al. Human circulating PD-1+CXCR3-CXCR5+ memory Tfh cells are highly functional and correlate with broadly neutralizing HIV antibody responses. Immunity. 2013;39(4):758–769. doi: 10.1016/j.immuni.2013.08.031. [DOI] [PMC free article] [PubMed] [Google Scholar]
- 25.Ueno H, Banchereau J, Vinuesa CG. Pathophysiology of T follicular helper cells in humans and mice. Nat Immunol. 2015;16(2):142–152. doi: 10.1038/ni.3054. [DOI] [PMC free article] [PubMed] [Google Scholar]
- 26.Morita R, et al. Human blood CXCR5(+)CD4(+) T cells are counterparts of T follicular cells and contain specific subsets that differentially support antibody secretion. Immunity. 2011;34(1):108–121. doi: 10.1016/j.immuni.2010.12.012. [DOI] [PMC free article] [PubMed] [Google Scholar]
- 27.Bost P, et al. Host-viral infection maps reveal signatures of severe COVID-19 patients. Cell. 2020;181(7):1475–1488.e12. doi: 10.1016/j.cell.2020.05.006. [DOI] [PMC free article] [PubMed] [Google Scholar]
- 28.Chevalier N, et al. CXCR5 expressing human central memory CD4 T cells and their relevance for humoral immune responses. J Immunol. 2011;186(10):5556–5568. doi: 10.4049/jimmunol.1002828. [DOI] [PubMed] [Google Scholar]
- 29.He J, et al. Circulating precursor CCR7(lo)PD-1(hi) CXCR5+CD4+ T cells indicate Tfh cell activity and promote antibody responses upon antigen reexposure. Immunity. 2013;39(4):770–781. doi: 10.1016/j.immuni.2013.09.007. [DOI] [PubMed] [Google Scholar]
- 30.Gong F, Zheng T, Zhou P. T Follicular helper cell subsets and the associated cytokine IL-21 in the pathogenesis and therapy of asthma. Front Immunol. 2019;10:2918. doi: 10.3389/fimmu.2019.02918. [DOI] [PMC free article] [PubMed] [Google Scholar]
- 31.Bentebibel SE, et al. Induction of ICOS+CXCR3+CXCR5+ TH cells correlates with antibody responses to influenza vaccination. Sci Transl Med. 2013;5(176):176ra32. doi: 10.1126/scitranslmed.3005191. [DOI] [PMC free article] [PubMed] [Google Scholar]
- 32.Koutsakos M, et al. Circulating TFH cells, serological memory, and tissue compartmentalization shape human influenza-specific B cell immunity. Sci Transl Med. 2018;10(428):eaan8405. doi: 10.1126/scitranslmed.aan8405. [DOI] [PubMed] [Google Scholar]
- 33.Chung Y, et al. Follicular regulatory T cells expressing Foxp3 and Bcl-6 suppress germinal center reactions. Nat Med. 2011;17(8):983–988. doi: 10.1038/nm.2426. [DOI] [PMC free article] [PubMed] [Google Scholar]
- 34.Linterman MA, et al. Foxp3+ follicular regulatory T cells control the germinal center response. Nat Med. 2011;17(8):975–982. doi: 10.1038/nm.2425. [DOI] [PMC free article] [PubMed] [Google Scholar]
- 35.Cañete PF, et al. Regulatory roles of IL-10-producing human follicular T cells. J Exp Med. 2019;216(8):1843–1856. doi: 10.1084/jem.20190493. [DOI] [PMC free article] [PubMed] [Google Scholar]
- 36.Cole KE, et al. Interferon-inducible T cell alpha chemoattractant (I-TAC): a novel non-ELR CXC chemokine with potent activity on activated T cells through selective high affinity binding to CXCR3. J Exp Med. 1998;187(12):2009–2021. doi: 10.1084/jem.187.12.2009. [DOI] [PMC free article] [PubMed] [Google Scholar]
- 37.Liang H, et al. ZIKV infection induces robust Th1-like Tfh cell and long-term protective antibody responses in immunocompetent mice. Nat Commun. 2019;10(1):3859. doi: 10.1038/s41467-019-11754-0. [DOI] [PMC free article] [PubMed] [Google Scholar]
- 38.Martin-Gayo E, et al. Circulating CXCR5+CXCR3+PD-1lo Tfh-like cells in HIV-1 controllers with neutralizing antibody breadth. JCI Insight. 2017;2(2):e89574. doi: 10.1172/jci.insight.89574. [DOI] [PMC free article] [PubMed] [Google Scholar]
- 39.Baiyegunhi O, et al. Frequencies of circulating Th1-biased T follicular helper cells in acute HIV-1 infection correlate with the development of HIV-specific antibody responses and lower set point viral load. J Virol. 2018;92(15):e00659-18. doi: 10.1128/JVI.00659-18. [DOI] [PMC free article] [PubMed] [Google Scholar]
- 40.Ma H, et al. Serum IgA, IgM, and IgG responses in COVID-19. Cell Mol Immunol. 2020;17(7):773–775. doi: 10.1038/s41423-020-0474-z. [DOI] [PMC free article] [PubMed] [Google Scholar]
- 41. doi: 10.1101/2020.04.11.20062349. Weiskopf D, et al. Phenotype of SARS-CoV-2-specific T cells in COVID-19 patients with acute respiratory distress syndrome. medRxiv. Published May 29, 2020. Accessed September 23, 2020. [DOI] [PMC free article] [PubMed]
- 42.Teijaro JR, Turner D, Pham Q, Wherry EJ, Lefrançois L, Farber DL. Cutting edge: Tissue-retentive lung memory CD4 T cells mediate optimal protection to respiratory virus infection. J Immunol. 2011;187(11):5510–5514. doi: 10.4049/jimmunol.1102243. [DOI] [PMC free article] [PubMed] [Google Scholar]
- 43.Teijaro JR, Verhoeven D, Page CA, Turner D, Farber DL. Memory CD4 T cells direct protective responses to influenza virus in the lungs through helper-independent mechanisms. J Virol. 2010;84(18):9217–9226. doi: 10.1128/JVI.01069-10. [DOI] [PMC free article] [PubMed] [Google Scholar]
- 44.Mahnke YD, Brodie TM, Sallusto F, Roederer M, Lugli E. The who’s who of T-cell differentiation: human memory T-cell subsets. Eur J Immunol. 2013;43(11):2797–2809. doi: 10.1002/eji.201343751. [DOI] [PubMed] [Google Scholar]
- 45.Mueller SN, Gebhardt T, Carbone FR, Heath WR. Memory T cell subsets, migration patterns, and tissue residence. Annu Rev Immunol. 2013;31:137–161. doi: 10.1146/annurev-immunol-032712-095954. [DOI] [PubMed] [Google Scholar]
- 46.Kaech SM, Cui W. Transcriptional control of effector and memory CD8+ T cell differentiation. Nat Rev Immunol. 2012;12(11):749–761. doi: 10.1038/nri3307. [DOI] [PMC free article] [PubMed] [Google Scholar]
- 47. doi: 10.1101/2020.05.13.092619. Robbiani DF, et al. Convergent antibody responses to SARS-CoV-2 infection in convalescent individuals. bioRxiv. Published May 22, 2020. Accessed September 23, 2020. [DOI] [PMC free article] [PubMed]
- 48.Poh CM, et al. Potent neutralizing antibodies in the sera of convalescent COVID-19 patients are directed against conserved linear epitopes on the SARS-CoV-2 spike protein. Nat Commun. doi: 10.1038/s41467-020-16638-2. doi: 10.1038/s41467-020-16638-2. [published online ahead of print June 1, 2020]. [DOI] [PMC free article] [PubMed] [Google Scholar]
- 49.Yang Y, et al. Plasma IP-10 and MCP-3 levels are highly associated with disease severity and predict the progression of COVID-19. J Allergy Clin Immunol. 2020;146(1):119–127.e4. doi: 10.1016/j.jaci.2020.04.027. [DOI] [PMC free article] [PubMed] [Google Scholar]
- 50.Liao M, et al. Single-cell landscape of bronchoalveolar immune cells in patients with COVID-19. Nat Med. 2020;26(6):842–844. doi: 10.1038/s41591-020-0901-9. [DOI] [PubMed] [Google Scholar]
- 51.Rani MR, Foster GR, Leung S, Leaman D, Stark GR, Ransohoff RM. Characterization of beta-R1, a gene that is selectively induced by interferon beta (IFN-beta) compared with IFN-alpha. J Biol Chem. 1996;271(37):22878–22884. doi: 10.1074/jbc.271.37.22878. [DOI] [PubMed] [Google Scholar]
- 52.Moyron-Quiroz JE, et al. Role of inducible bronchus associated lymphoid tissue (iBALT) in respiratory immunity. Nat Med. 2004;10(9):927–934. doi: 10.1038/nm1091. [DOI] [PubMed] [Google Scholar]
- 53.Kelsen SG, et al. Lymphoid follicle cells in chronic obstructive pulmonary disease overexpress the chemokine receptor CXCR3. Am J Respir Crit Care Med. 2009;179(9):799–805. doi: 10.1164/rccm.200807-1089OC. [DOI] [PMC free article] [PubMed] [Google Scholar]
- 54.Allie SR, et al. The establishment of resident memory B cells in the lung requires local antigen encounter. Nat Immunol. 2019;20(1):97–108. doi: 10.1038/s41590-018-0260-6. [DOI] [PMC free article] [PubMed] [Google Scholar]
- 55.Laidlaw BJ, et al. CD4+ T cell help guides formation of CD103+ lung-resident memory CD8+ T cells during influenza viral infection. Immunity. 2014;41(4):633–645. doi: 10.1016/j.immuni.2014.09.007. [DOI] [PMC free article] [PubMed] [Google Scholar]
- 56. doi: 10.1101/2020.02.28.970400. Son YM, et al. Tissue-resident CD4+ T helper cells assist protective respiratory mucosal B CD8+ T cell memory responses. bioRxiv. Published February 28, 2020. Accessed September 23, 2020. [DOI] [PMC free article] [PubMed]
- 57.Caielli S, et al. A CD4+ T cell population expanded in lupus blood provides B cell help through interleukin-10 and succinate. Nat Med. 2019;25(1):75–81. doi: 10.1038/s41591-018-0254-9. [DOI] [PMC free article] [PubMed] [Google Scholar]
- 58. doi: 10.1101/2020.05.20.106401. Mathew D, et al. Deep immune profiling of COVID-19 patients reveals patient heterogeneity distinct immunotypes with implications for therapeutic interventions. bioRxiv. Published May 23, 2020. Accessed September 23, 2020. [DOI] [PMC free article] [PubMed]
- 59.Cho SH, et al. Germinal centre hypoxia and regulation of antibody qualities by a hypoxia response system. Nature. 2016;537(7619):234–238. doi: 10.1038/nature19334. [DOI] [PMC free article] [PubMed] [Google Scholar]
- 60.Xu Y, et al. Glycolysis determines dichotomous regulation of T cell subsets in hypoxia. J Clin Invest. 2016;126(7):2678–2688. doi: 10.1172/JCI85834. [DOI] [PMC free article] [PubMed] [Google Scholar]
- 61.Zeng H, et al. mTORC1 and mTORC2 kinase signaling and glucose metabolism drive follicular helper T cell differentiation. Immunity. 2016;45(3):540–554. doi: 10.1016/j.immuni.2016.08.017. [DOI] [PMC free article] [PubMed] [Google Scholar]
- 62.Künzli M, et al. Long-lived T follicular helper cells retain plasticity and help sustain humoral immunity. Sci Immunol. 2020;5(45):eaay5552. doi: 10.1126/sciimmunol.aay5552. [DOI] [PubMed] [Google Scholar]
- 63.Liu Y, et al. Viral dynamics in mild and severe cases of COVID-19. Lancet Infect Dis. 2020;20(6):656–657. doi: 10.1016/S1473-3099(20)30232-2. [DOI] [PMC free article] [PubMed] [Google Scholar]
- 64.Wang Y, et al. Kinetics of viral load and antibody response in relation to COVID-19 severity. J Clin Invest. 2020;null(10):138759. doi: 10.1172/JCI138759. [DOI] [PMC free article] [PubMed] [Google Scholar]
- 65.Fazilleau N, et al. Lymphoid reservoirs of antigen-specific memory T helper cells. Nat Immunol. 2007;8(7):753–761. doi: 10.1038/ni1472. [DOI] [PubMed] [Google Scholar]
- 66.Deenick EK, et al. Follicular helper T cell differentiation requires continuous antigen presentation that is independent of unique B cell signaling. Immunity. 2010;33(2):241–253. doi: 10.1016/j.immuni.2010.07.015. [DOI] [PMC free article] [PubMed] [Google Scholar]
- 67.Baumjohann D, et al. Persistent antigen and germinal center B cells sustain T follicular helper cell responses and phenotype. Immunity. 2013;38(3):596–605. doi: 10.1016/j.immuni.2012.11.020. [DOI] [PubMed] [Google Scholar]
- 68.Vinuesa CG. HIV and T follicular helper cells: a dangerous relationship. J Clin Invest. 2012;122(9):3059–3062. doi: 10.1172/JCI65175. [DOI] [PMC free article] [PubMed] [Google Scholar]
- 69.Vabret N, et al. Immunology of COVID-19: current state of the science. Immunity. 2020;52(6):910–941. doi: 10.1016/j.immuni.2020.05.002. [DOI] [PMC free article] [PubMed] [Google Scholar]
Associated Data
This section collects any data citations, data availability statements, or supplementary materials included in this article.