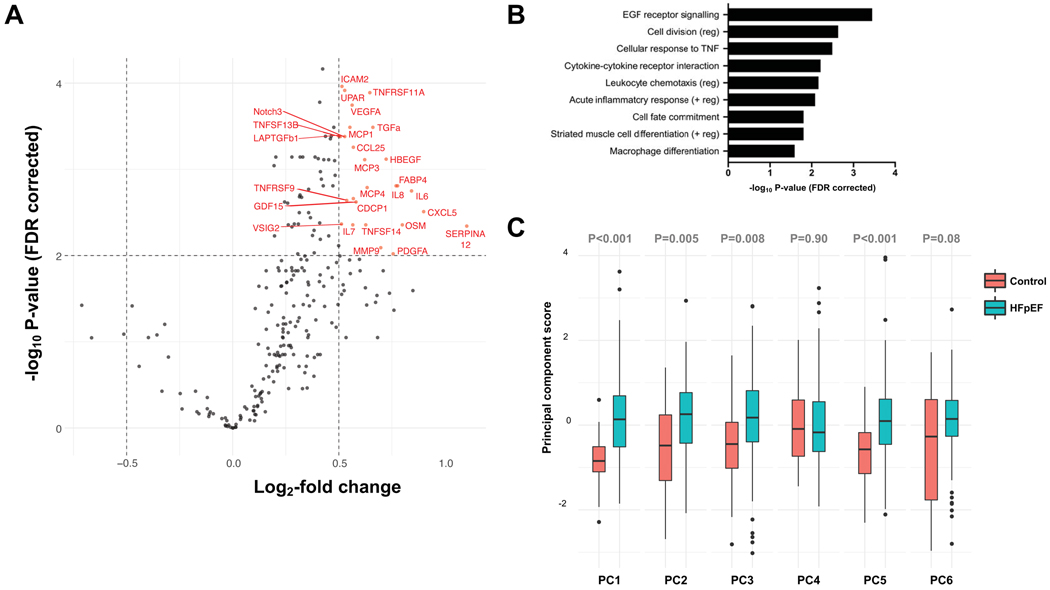
Figure 5. Inflammation in HFpEF Patients versus Comorbidity Controls in the Northwestern Validation Cohort.
(A) Volcano plot showing the upregulated proteins in HFpEF versus comorbidity control patients in the Northwestern validation cohort. Dashed lines show the cut-off used for defining upregulation (false discovery rate-corrected P<0.01 and a > 1.5 fold-change). (B) Significantly overrepresented pathways in HFpEF patients versus comorbidity controls based on the upregulated proteins, indicating upregulation of several inflammatory pathways. (C) Principal component scores summarizing circulating inflammation proteins in HFpEF patients (red) versus comorbidity controls (turquoise). Boxes depict 25th-75th percentiles, horizontal lines through the box depict the median (50th percentile), whiskers depict the upper and lower extremes, and dots depict outliers.

