

Abstract
The epigenome and three-dimensional (3D) –genomic architecture are emerging as key factors in the dynamic regulation of different transcriptional programs required for neuronal functions. Here we utilize an activity-dependent tagging system in mice to determine the epigenetic state, 3D-genome architecture, and transcriptional landscape of engram cells over the lifespan of memory formation and recall. Our findings reveal that memory encoding leads to an epigenetic priming event, marked by increased accessibility of enhancers without corresponding transcriptional changes. Memory consolidation subsequently results in spatial reorganization of large chromatin segments and promoter-enhancer interactions. Finally, with reactivation, engram neurons utilize a subset of de novo long-range interactions, where primed enhancers were brought in contact with their respective promoters to up-regulate genes involved in local protein translation in synaptic compartments. Collectively, our work elucidates the comprehensive transcriptional and epigenomic landscape across the lifespan of memory formation and recall in the hippocampal engram ensemble.
The formation and preservation of long-term memories depends on coordinated gene expression and synthesis of synaptic proteins1. These molecular processes act within a specific population of neurons, referred to as engram cells2–4. Recent approaches using activity-dependent expression of reporters, provided a framework for exploring the engram ensemble5–8, but the molecular mechanisms that govern memory storage and retrieval remain poorly understood. Specifically, epigenetic modifications and 3D -genomic architecture are emerging as a key factors in dynamic regulation of gene expression9–17, and there is an increasing appreciation of their importance in neuronal function, development and disease14,16,18
Here, we utilized the Targeted Recombination in Active Populations (TRAP) mouse model5,6, in which activated neurons expressing the Activity Regulated Cytoskeleton Associated Protein, (Arc) gene, are permanently tagged in an inducible manner. Activated neurons during memory encoding, consolidation and recall were sorted and subjected to nuclear RNA sequencing (nRNA-seq), Assay for Transposase-Accessible Chromatin using sequencing (ATAC-seq) and chromosome conformation capture (Hi-C). Our data demonstrates that memory encoding leads to a genome-wide increase in chromatin accessibility, without expected changes in gene expression. Furthermore, we demonstrate that late phase of memory consolidation was associated with re-localization of large chromatin segments (sub-compartments) from inactive to permissive environments, and reorganization of the promoter-enhancer interaction landscape. Finally, reactivation of the neurons during memory recall is associated with de novo promoter-enhancer interactions, utilizing a large subset of the enhancers that were primed during memory encoding. These promoter-enhancer interactions are associated with a robust change in the expression of genes involved in local protein synthesis and synaptic morphogenesis.
Results
Temporal and spatial identification of activated and reactivated engram cells
Tracking neuronal activity over time has been one of the major challenges when studying engram cells, as the markers for neuronal activity, known as immediate early genes (IEGs), return to baseline shortly after induction1,2. To overcome this limitation, we took advantage of the TRAP5,6 model, which requires two transgenes, one that expresses CreERT2 from an activity-dependent Arc promoter and one that allows expression of the yellow fluorescent protein (eYFP) reporter, in a Cre-dependent manner. Administration of tamoxifen (TAM) to the TRAP mice results in a permanent eYFP label in the activated Arc neurons. Without TAM, CreERT2 is retained in the cytoplasm and eYFP is not expressed (Extended Data Fig. 1a). TRAP mice were subjected to the classic Pavlovian contextual fear conditioning (CFC) paradigm (Fig. 1a), a commonly employed method to study aversive memories19. Approximately 1.5–2 hours after exposure to FS, brains were collected to identify i) RNA binding protein fox-1 homolog 3 (Rbfox3) also known as NeuN+ and eYFP+ tagged neurons that were activated during the initial exposure (Activated-early), which can be distinguished from ii) NeuN+/eYFP- non-activated basal-state neurons (Basal) (Fig. 1a). After five days, in the absence of retrieval, we collected iii) NeuN+/eYFP+ neurons that were tagged on training day, denoting long-term memory consolidation (Activated-late). In a different cohort, mice were re-exposed to the conditioned stimulus and subsequent endogenous ARC protein expression was assayed 1.5–2 hours after re-exposure. This enabled the identification of iv) double positive NeuN+/eYFP+/ endogenous Arc+ engram neurons that were activated during training and reactivated during memory recall (Reactivated). Notably, although DNA recombination may not fully occur 1.5–2 h after the FS, we observed high co-localization (average of 84%) between endogenous Arc protein and the Arc:eYFP reporter (Extended Data Fig. 1b), which was also consistent with previous reports20.
Fig. 1. Temporal and spatial identification of activated and reactivated engram cells.

(a) Schematic representation of the experimental design. TRAP mice were initially exposed to training in which a conditioned (context) and unconditioned (foot shock, FS) stimulus were paired together within a brief window of 4-Hydroxytamoxifen (TAM) exposure. Four different neuronal populations (Basal, Activated –early, Activated –late and Reactivated) were sorted by flow cytometer and subjected to library preparation for nRNA-seq, ATAC-seq, Hi-C and pc-HiC.
(b) Representative images (DG) and whole hippocampus quantifications of eYFP+ neurons after TAM treatment in home cage (naïve, n = 4 mice/6 slices per animal), 1.5 h (Activated –early, n = 4 mice/4 slices per animal) and 5 days (Activated –late, n = 4 mice/8 slices per animal) after exposure after FS. The scale bar represents 200 μm. The dot-plot indicates the mean and error bars (SEM), one-way ANOVA (parametric, unpaired), F (2, 70) = 240.3, P<0.0001. Bonferroni’s multiple comparisons test; HC vs. Early ***P = 0.0007, HC vs. Late ****P < 0.0001, Early vs. Late ****P < 0.0001.
(c) Quantifications of Activated –late and Reactivated neurons in the hippocampus in two experimental groups; CFC with (CFC+TAM, n = 4 mice/8 slices per animal) or without (CFC NO-TAM, n = 4 mice/6 slices per animal) tamoxifen administration. The dot-plot indicates the mean and error bars (SEM), two-sided unpaired Student’s t-test, Activated –late; t=25.65, df=47, Reactivated; t=11.00, df=52, ****P < 0.0001.
(d) Representative images and quantifications from different regions of the hippocampus. Number of positive nuclei were analyzed using IMARIS (see methods) from the DG, CA1 and CA3. The scale bar represents 100 μm. n = 5 mice/ Activated –early: 6 slices per animal, n = 6 mice/ Activated –late: 6 Reactivated: 6 slices per animal. The dot-plot indicates the mean and error bars (SEM), one-way ANOVA (parametric, unpaired), Early; F (2, 42) = 13.46. Late; F (2, 95) = 556.3. Reactivated; F (2, 89) = 83.53. All Ps < 0.0001. Bonferroni’s multiple comparisons test, *P= 0.029, **P= 0.0075, ***P= 0.0009, ****P< 0.0001.
(e) Valuation of context effects on the number and the distribution of hippocampal memory traces.
(f) Quantifications of Activated -late and Reactivated neurons in the A-B (n = 6 mice/ 6 slices per animal), compared to the A-A (n = 5 mice/ 6 slices per animal) group. The dot-plot indicates the mean and error bars (SEM), two-sided unpaired Student’s t-test, Activated –late; t=0.08292, df=59, P = 0.9342. Reactivated; t=8.385, df=57, ****P< 0.0001.
n.s = non-significant.
To confirm memory encoding and recall during CFC, freezing behavior was recorded during training and re-exposure to fear inducing cues (Extended Data Fig. 1c). Consistent with previous publications6,20, our data showed a significant increase in the number of eYFP+ (Activated-early and -late) neurons in the hippocampus, compared to mice that remained naïve to CFC in their home cage (F (2, 70) = 240.3, P<0.0001, Fig. 1b). Activity-dependent tagging was also negligible (~1%) in the absence of TAM induction (Fig. 1c, Extended Data Fig. 1d). With Tamoxifen treatment, we observed a wide distribution of activity-labeled populations across all hippocampal sub-regions, where early activation was predominantly observed in the DG and late tagging was most abundant in the CA1 (Fig. 1d). To further interrogate the specificity of engram formation, we subjected TRAP mice to CFC learning in context A and then exposed them 5 days later to the same context (A-A) or to a novel neutral context B (A-B) (Fig. 1e, Extended Data Fig. 1e). We found comparable numbers of Activated –late neurons in both groups (P=0.9) and significantly fewer Reactivated neurons in the A-B group (P<0.0001, Fig. 1f; Extended Data Fig. 1f), confirming that the reactivated cells play a key role in encoding prior experience.
Memory formation is associated with increased chromatin accessibility, predominantly on enhancers
To better understand the molecular forces that govern different transcriptional programs, we measured genome-wide changes of chromatin accessibility across different phases of memory. Hippocampal tissues were pooled and isolated nuclei (Extended Data Fig. 2a, Supplementary Table 1) were subjected to ATAC-seq library preparation. Differentially accessible regions (DARs) analysis (Diffbind, DESeq2 mode) between all populations (Fig. 2a) revealed that most changes in chromatin state occur during the early phase of memory formation, where 7,862 regions across the genome gain accessibility (Basal vs. Early, Supplementary Table 2). In contrast, we observed relatively minimal changes in chromatin state when transitioning from Activated-early to Activated-late (582 DARs) and between Activated-late and Reactivated neurons (725 DARs), with 48% overlap between them (Extended Data Fig. 2b). Remarkably, we identified a large percentage (52%) of stably gained DARs that became more accessible in Activated-early and remained accessible in both the Activated-late and Reactivated neurons (Fig. 2b,c; Supplementary Table 2). Interestingly, while both early changes (Basal vs. Early) and stably gained DARs were enriched for intergenic regions, late chromatin changes (Early vs. late and Late vs. Reactivated) were mostly enriched for promoter sites, (Fig. 2d).
Fig. 2. Chromatin accessibility landscape during memory formation and recall.

(a) Differential accessible regions (DAR)s are shown in a volcano plot (Pairwise comparisons, FDR < 0.01; fold changes > 1.5), n = 3 biologically independent samples.
(b) Analysis of common gained- accessible region (stable), acquired 90 min after the FS (Activated -early), that remain accessible in the late state of consolidation (Activated -late) and recall (Reactivated). Overlapping stable DARs were only considered if they appeared in at least 2 biological replicates in a given condition.
(c) Representative IGV genome browser tracks of the Arc locus.
(d) Annotation analysis (HOMER tools) for all the DARs. Numbers on the y-axis indicate the Log2 ratio values of observed loci (number of DARs) over expected (total size (bp)) of the TTS, exons, introns, intergenic and promoters. P-value were calculated by HOMER tools; Basal vs. Activated -early (Intergenic *P = 1.73 × 10−103), Activated -early vs. Activated -late (TTS *P = 0.0339, Promoter *P = 1.48 × 10−39), Activated -late vs. Reactivated (Promoter *P = 2.48 × 10⁻⁶), stable (Intergenic *P = 0.0358).
(e) Histone modification emission states (left) and enrichment analysis of DARs over emissions using ChromHMM. Fold enrichment scale (FE) 0–30. The and p-value was determined by the z-score value (as calculated in Extended Data Fig. 2c), Full analysis is reported in supplement table 3. *P < 0.00001, reported only for enriched values (not depleted)
(f) Chip-qPCR. Samples were immunoprecipitated with antibodies against H3K27ac or H3K4me1 and subjected to real-time PCR with two sets of primers for identified putative enhancers. H3K27ac: n = 4, H3K4me1 n = 3, The dot-plot indicates the mean and error bars (SEM), one-way ANOVA (parametric, unpaired) with Dunnett’s multiple comparisons test, Enhancer 1; H3K27ac - F (3, 12) = 4.664, P = 0.02, (Basal versus Activated-late *P = 0.0246, Basal versus Reactivated *P = 0.0232), H3K4me1 - F (3, 8) = 0.845, P = 0.506. Enhancer 2; H3K27ac - F (3, 12) = 5.221, P = 0.0155, (Basal vs. Activated -late **P = 0.0059), H3K4me1 - F (3, 8) = 1.719, P = 0.24. Enhancer 3; H3K27ac - F (3, 12) = 29.91, P < 0.0001, H3K4me1 - F (3, 8) = 10.39, P = 0.0039, (Basal vs. Activated -early *P = 0.0298, Basal vs. Activated -late **P = 0.0021, Basal vs. Reactivated **P = 0.0063). Enhancer 4; H3K27ac - F (3, 12) = 6.273, P = 0.0083, (Basal vs. Activated -late **P = 0.007, Basal vs. Reactivated *P = 0.0152), H3K4me1 - F (3, 8) = 9.901, P = 0.0045, (Basal vs. Reactivated **P = 0.0016).
Functional insight was afforded by assessing how DARs are marked by different histone modifications. We first utilized ChromHMM to establish a chromatin state model from two independent studies that utilized bulk hippocampus tissue before and after foot shock 21,22. Next, we performed a fold enrichment analysis (observed over expected distribution) of the DARs for these different states and revealed that early chromatin changes and stable DARs were enriched for enhancers marks (Fig. 2e; Extended Data Fig. 2c, Supplementary Table 3). These results are in line with previous publications, showing that stimulating primary neuronal culture induces prolonged enhancer activity12,23. Next, we analyzed the overlap of individual stable loci with the H3K4me1 and H3K27ac21. These two histone marks delineate different populations of enhancers, which can either be ‘primed’ (only H3K4me1), ‘active’ (H3K4me1 and H3K27ac) or ‘latent’ (no marks)18. Stable peaks showed a distribution across both primed and active enhancers (Extended Data Fig. 2d), where 47% of these sites were predicted to be ‘latent’ (no overlap between DARs and histone marks21 obtained 1h after FS). To confirm our model, we performed chromatin immunoprecipitation (ChIP) for H3K4me1 and H3K27ac histone markers, followed by qPCR. Four selected sites were chosen from our putative enhancer modeling analysis (Extended Data Fig. 2d; Enhancer 1 – predicted primed, Enhancer 2- predicted Active, Enhancer 3 and 4 – predicted latent). In agreement with our model, we identified two ‘latent’ loci in the basal state (Enhancers 3 and 4) that transformed to an ‘active’ state during memory formation (Fig. 2f). Moreover, the putative enhancer 1 was found to be ‘primed’ in the basal state and became active, where there was significant stable increase in H3K27ac markers during the late phase and recall (Fig. 2f). Together, these data indicate that the repertoire of newly accessible enhancers was expanded in the potentiated engram neurons, where latent or primed regions gained H3K4me1 and H3K27ac marks and thus became active enhancers.
To understand the functional role of accessible promoters and enhancers regions, we performed motif enrichment analysis (Supplementary Table 4). Our data indicates that the majority (70%) of motifs on accessible promoters are equally enriched and were identified across all phases of memory (Extended Data Fig. 2e). In contrast, the majority of enhancers sites showed distinct patterns of transcription factor (TF)-binding motifs across different memory phases. Interestingly, the ubiquitously expressed motifs from the Jun Proto-Oncogene, Ap-1 Transcription Factor Subunit (i.e. Jun-Ap1) and the Regulatory Factor X (Rfx) family of TFs, were significantly enriched only after the initial phase of encoding (Extended Data Fig. 2e). It was previously reported that Jun-Ap1 complex plays a central role in enhancer selection and might act as a pioneer TF to define enhancers sites during brain development and neuronal activity12,24. These findings are consistent with our data that showed high percentage of latent/primed loci in the basal state (Fig. 2f, Extended Data Fig. 2c,d). Hence, it appears that neuronal activity might trigger the binding of Jun-Ap1 to latent enhancers, which then recruits chromatin modifiers that activate latent enhancers. Similarly, the enrichment of the transcription factor Yin Yang 1 (Yy1) motifs only in enhancers from the early and late states, suggests that promoter-enhancer organization is an active process of memory formation, as it was recently reported that Yy1 facilitates the formation of these long range interactions25. Collectively, this data suggests that the initial phase of memory formation alters chromatin accessibility landscape in activated neurons, with long lasting stable changes occurring predominantly within enhancer regions.
Dynamic changes in spatial nuclear architecture and chromatin accessibility during initial memory formation correspond with increased promoter-enhancer interactions frequency during memory recall
Nuclear 3D-architecture, is emerging as a key factor in dynamic regulation of gene expression, in many neuronal functions26–28. Hence, we were interested in delineating the precise changes that occur in spatial chromatin organization during memory formation and consolidation. We produced Hi-C data from basal-state and eYFP+ tagged neurons (early and -late, Supplementary Table 5). Chromatin is segregated into two spatially distinct sub-nuclear compartments, ‘A’ and ‘B’, corresponding to the transcriptionally active and inactive chromatin, respectively15,16,26. Early evidence suggests that neuronal activity and extrinsic signaling might induce a re-organization of 3D -chromatin architecture14,27,28. Our compartment state analysis15,16,26 (Fig. 3a–c) revealed re-localization of large chromatin segments from inactive (B) to permissive environment (A) (and vice versa) during the initial and late phase of memory formation (212 segments switched from A to B, 127 from B to A, average size of ~436K bp). Interestingly, 52% of the regions in the early phase that switched from B to A maintained that state in the late phase (i.e. remained in state A, Fig. 3b,c; Supplementary Table 6). Moreover, nearly all these regions overlapped with gained DARs from our ATAC-seq analysis, confirming the transition of sub-compartment from inactive to permissive environment (Fig. 3d). This data indicates that some loci undergo sub-compartment switching across different memory phases, and therefore might contribute to long-term changes in neuronal properties and function after initial activation.
Fig. 3. Sub-compartment switching across the different phases of memory formation and recall.

(a) Hi-C correlation heatmap represent compartmentalization of chr6 for Basal, Activated -early and Activated -late cells. Compartments calculated by Juicer at 500 kb resolution (observed–expected normalized).
(b) Dynamic changes in compartment state. Positive values of the first component (+PC1) reflecting active chromatin and negative values (-PC1) indicative of inactive chromatin state were compared between all three populations of neuron (Basal, Activated -early and Activated -late). Compartment switch was only considered if a negative value was transformed to a positive value, and vice versa.
(c) Representative images from IGV browser that shows stable compartment switch from A to B (upper panel) and B to A (lower panel) across different memory phases.
(d) Overlap analysis between DARs in the early phase (Basal vs. Activated –early) and stable switched compartment. Left Venn diagram shows gained DARs and stable compartment switched from B to A. Right Venn diagram shows lost DARs and stable compartment switched from A to B.
(e) Illustration of activity induced compartment switch and specific promoter-enhancers interactions.
While our Hi-C data suggested large-scale reorganization, it remained unclear if this reorientation enabled the interaction of novel promoter-enhancer repertoires and the fine-tuning of different transcriptional programs (Fig. 3e). By utilizing promoter-capture Hi-C (pc-HiC) technique, we studied the precise changes that occur in promoter-enhancers interactions during the process of memory formation and recall. For this study, we used custom-designed “baits” targeting ~5000 promoters29. In agreement with previous publications29, we detected ~19,000 (per group) significant promoters-enhancers (67.5%) and promoters-promoters (46.2%) interactions (Extended Data Fig. 3a,b).
Since promoters in the mammalian brain could be under the control of multiple regulatory elements14,30,31, we analyzed the overlap between all interacting enhancers and their respective promoters. We have found that during each memory phase, the same promoters interact more frequently with a distinct subset of enhancers (i.e. unique, Basal – 3243, Early - 7602, Late - 7028, Reactivated – 7244; Fig. 4a,b; Extended Data Fig. 3c; Supplementary Table 7). This result is consistent with previous publications showing that multiple enhancers surrounding several genes (c-Fos and Arc) are crucial for their activation and their interaction frequency with their respective promoters is altered in response to various depolarizing agents in cultured neurons31. We also identified a smaller subset of interactions in which the promoters were interacting with the same enhancers across different memory phases (i.e. common, ~31% of all interactions; Supplementary Table 7). Furthermore, Reactivated neurons presented significantly stronger interaction scores (as calculated by CHiCAGO, Fig. 4b; Extended Data Fig. 3d). Hence, although the number of unique interactions was similar across early, late and reactivated states, stronger interaction scores indicate that specific promoter-enhancer interactions occur more frequently during memory recall. This notion was further validated by 3C experiments, with primers designed to measure frequency of interaction between selected enhancer (E) and gene promoters (P) that encode for eukaryotic translation initiation factor 3 subunit D (Eif3d) or glutamate receptor, ionotropic, kainate 3 (Grik3) (Fig. 4c). Our data showed that Reactivated neurons had a significant increase in the interaction frequency between the Eif3d promoter and the selected enhancer, as compared to the other populations (Fig. 4c). Collectively, this data indicates that promoter-enhancer interactions occur more frequently during memory recall.
Fig. 4. Promoters interact more frequently with a distinct subset of enhancers during each memory phase.

(a) Heatmap represent the interaction score as defined by CHiCAGO, for each population. Basal: n = 3, Activated -early, Activated -late and Reactivated: n = 4 biologically independent samples.
(b) Violin plots show the distribution and the intensity (log10 scale) of interaction that were either unique or shared by at least 3 populations (common). One-way ANOVA (parametric, unpaired), F (4, 57922) = 2364, P < 0.0001. Bonferroni’s multiple comparisons test, n.s = non-significant (P = 0.7659), *P < 0.0001.
(c) Frequency of promoter-enhancer interaction as measured by 3C-qPCR for selected loci. Four sets of primers encompassing interaction between promoter-enhancer (P/E), and three random loci inside the loop (P/Ein), outside the loop (P/Eout) and on the promoter (P/Pin). Reads were normalized to promoter-enhancer interaction values of the house keeping gene βActin. n = 3 biologically independent samples. Data are presented as mean values with error bars indicate the SEM, two-way ANOVA. Eif3d; population × interaction location (F (9, 32) = 1.917, P=0.0851), effect of interaction location only (F (3, 32) = 22.64, P < 0.0001). Grik3; population × interaction location F (9, 32) = 0.1716. Bonferroni’s multiple comparisons test, P/E Basal vs. Reactivated **P = 0.0019.
(d) Representative priming events of the Eif5a locus. IGV genome browser tracks presenting chromatin accessibility dynamics (colored tracks) on promoter (gray rectangle) and enhancers (blue rectangle). WashU browser tracks presenting significant promoter-enhancer interaction via arcs (purple - Basal, light green - Activated -early, dark green - Activated -late and orange - Reactivated).
Next, we asked whether the dynamic long-range interactions identified via pc-HiC correspond to chromatin regions that become more accessible, as determined via ATAC-seq. This would confirm that the increased accessibility has a functional consequence in bringing about novel promoter-enhancer interactions. To achieve this, we compared the overlap between interacting enhancers in each cell population to DARs (observed) or a random set of accessible genomic loci (expected). Our analysis revealed a significant overlap between both gained DARs in Activated-early neurons and stably gained DARs with the interacting enhancers, in all cell populations (All Ps < 0.0001, Extended Data Fig. 3e). In contrast, changes in chromatin accessibility that occurred during the late phase of memory consolidation and reactivation did not significantly overlap with interacting enhancers (Extended Data Fig. 3e). Together, these results indicate that the gain of accessibility during memory encoding is a priming event and these primed loci engage in de-novo functional promoter-enhancer interactions during later phases of memory formation. This dynamic landscape is illustrated by visualizing the genomic regions around the eukaryotic translation initiation factor 5 subunit A (Eif5a) gene (Fig. 4d). This temporal molecular dissection of the engram lifespan highlights how a coordinated priming of the epigenetic state of a cell during memory encoding and consolidation facilitates long-range interactions during reactivation.
Distinct transcriptional programs of the engram ensembles during memory formation and recall
To elucidate how changes in chromatin accessibility and promoter-enhancer interactions were affecting gene expression, we performed nuclear RNA-seq (nRNA-seq) from all the neuronal sub-populations. Our differentially expressed gene (DEG) analysis revealed a low amount of changes in the early phase, when compared to basal-state neurons (Basal vs. Early, 88 DEGs, Fig. 5a, Supplementary Table 8). This was especially unexpected given the extensive degree of chromatin organization observed at this time point (Fig. 2a). In contrast, neurons from late phase presented higher numbers of DEGs despite there being more similarity in chromatin accessibility at these time points (Fig. 5a). To validate our transcriptional findings, we compared our results to previous published data of activated DG granule cells 1 h after novel exposure32, 24 h after FS20 and after prolonged stimulation (6h) of mouse cultured cortical neurons with KCl33 (Extended Data Fig. 4a). Interestingly, although this comparison revealed significant overlap between up-regulated genes from our data set and 1 h after novel exposure32 (P = 0.006) or 24 h after FS20 (P = 0.0005), we did not observe any significant overlap with genes that were up-regulated in the reactivated engram cells and the other data sets, confirming the unique transcriptional landscape of reactivated engram cells during recall.
Fig. 5. Transcriptional signature of reactivated engram neurons.

(a) Pairwise analysis of DEGs from the hippocampus of TRAP mice that were exposed to CFC are shown in a volcano plot (FDR<0.01; log2FC > 2). n = 3 biologically independent samples.
(b) Heatmap and (c) Line graphs shows the average transcriptional changes (log2 scale), compared to the expression at the non-activated neurons (basal). Gene-sets were clustered by K-means to i) Dw–Late, ii) Up-Late, iii) Stable and iv) Reactivation clusters. Mean of n = 3 biologically independent samples; P value calculated using one-way ANOVA (parametric, unpaired), followed by Bonferroni’s multiple-comparison test. Dw–Late; F (3, 1032) = 42.19, Up-Late; F (3, 280) = 752.5, Stable; F (3, 764) = 92.28, Reactivation; F (3, 1744) = 597.4. All Ps < 0.0001. multiple comparisons test, n.s = non-significant, ***P < 0.0001.
(d) Gene ontology (GO) analysis (ToppFun) for DEGs that were identified in each cluster.
(e) Representative DEGs from each cluster. log2FC from the basal-state is presented in three biological replicates. Line represent calculated average. n = 3 biologically independent samples, one-way ANOVA (parametric, unpaired) with Dunnett’s multiple comparisons test, n.s = non-significant. Gad1; F (3, 8) = 4.387, P= 0.04. *P = 0.0268. Gabrb3; F (3, 8) = 6.184, P=0.0177. *P = 0.0441. Rest; F (3, 8) = 23.23, P=0.0003. ***P = 0.0268. Map4k4; F (3, 8) = 6.244, P=0.0172. *P = 0.0151. Nefl; F (3, 8) = 12.06, P=0.0024. **P = 0.0059, **P = 0.0014. Nefh; F (3, 8) = 21.50, P=0.0003. *P = 0.016, ***P = 0.0008, ***P = 0.0002. Eif5a; F (3, 8) = 8.482, P=0.0072. **P = 0.004. Eif4h; F (3, 8) = 26.58, P=0.0002. ***P = 0.0001.
(f) Representative images and quantification of Eif4e protein levels from Activated -early, Activated -late and Reactivated. For quantification, two separate surfaces were built on IMARIS; cell soma and dendritic shaft. The number of Eif4e puncta were measured only in those surfaces boundaries. Data for dendritic shaft is presented as a ratio between number and the length (μM). The scale bar represents 10 μm. n = 4 mice /5 section per animal, boxplot indicates the mean, interquartile range and the minimum and maximum, one-way ANOVA (parametric, unpaired), Shaft; F (2, 28) = 5.113, P=0.0128. Soma; F (2, 43) = 3.026, P=0.0589. Bonferroni’s multiple comparisons test; Shaft; Activated -early vs. Reactivated *P = 0.0324, Activated -late vs. Reactivated *P = 0.0324
(g) Representative images (left panel) and quantification (right panel) of the Gria1 protein levels, during different phases of memory. Three populations of neurons (Activated -early, Activated -late and Reactivated) were analyzed, based on the immunoreactivity of eYFP and endogenous Arc. For quantification, IMARIS surfaces were built on the dendritic shaft and the number of GRIA1 puncta were measured only in the surfaces boundaries (<1μm threshold). Data is presented as a ratio between number of puncta and the shaft length. The scale bar represents 10 μm. n = 4 mice /5 section per animal, boxplot indicates the mean, interquartile range and the minimum and maximum, one-way ANOVA, F (2, 16) = 15.22, P = 0.0002. Bonferroni’s multiple comparisons test, **P = 0.002, ***P = 0.0005.
Next, we took advantage of previous published computational approach34 that measures changes in mature RNA (exons) and pre-mRNA (introns) reads. As expected, exonic changes correlate with global transcriptional changes as measured by DEseq2 (both exon and intron reads), across all memory phases (Extended Data Fig. 4b). However, measurement of the exon/intron ratios, indicates that altered transcripts (up- and down-regulated) during memory consolidation (Early vs. Late) are predominantly driven by intronic reads, suggesting that this transcriptional profile mostly reflects immature transcripts that require additional steps of RNA processing (Extended Data Fig. 4c). In contrast, up-regulated genes during recall (Late vs. Reactivated) are predominantly driven from exonic transcripts, thus reflecting a more mature state of RNA (Extended Data Fig. 4c).
To reconcile the discrepancy between the observed chromatin changes and the transcriptional state in each subpopulation, we performed correlation analysis of the DARs and DEGs, identified during the different time points of memory formation and recall. For this analysis, DARs on the non-coding regions (intergenic and intronic) were mapped to their respective promoters by utilizing our pc-HiC data. Overall, we found low correlation (P = 2.81 × 10⁻²) between differential chromatin accessibility and gene expression changes that occur in the early phase (Basal vs. Early, Extended Data Fig. 4d). These results were in line with previous work21, reporting that histone modifications have little correlation with transcriptional alterations during memory acquisition. Unexpectedly, we observed a stronger overlap and similarity between the chromatin changes that occur during memory encoding (Early) with the altered transcriptional landscape during memory consolidation (Late) and reactivated engram neurons (P = 1.13 × 10⁻⁸, 2.42 × 10⁻⁷, respectively, Extended Data Fig. 4d). To further confirm this analysis, we performed a Pearson correlation between log2FC values from DARs and log2FC values of DEGs that were annotated to those region (intergenic regions were mapped via the pc-HiC data set, Extended Data Fig. 4e, Supplementary Table 9). Our analysis revealed that early chromatin changes (Basal vs. Early, DARs) were significantly correlated with down-regulation of genes in the late phase (Early vs. Late, Extended Data Fig. 4e, gray line, r = −0.14, p < 0.0001). Moreover, after parsing the DEGs to intronic and exonic reads we observed that the correlation was largely driven by intronic reads (Introns r = −0.21, p < 0.0001, Exons r = −0.09, p = 0.02). In contrast, early chromatin changes (Basal vs. Early, DARs) showed positive correlation with DEGs from the reactivated cells, which was predominantly driven by exonic reads (Introns r = −0.007, p = 0.73, Exons r = 0.11, p = 0.04). This data provides further evidence for a priming event and transcriptional lag, in which chromatin changes that occur during the early phase enable transcriptional changes observed at a later time point, primarily in reactivated engram cells.
Memory encoding, consolidation and recall is a dynamic process requiring several waves of delayed gene transcription12,32,33. Hence, in order to identify different transcriptional programs across all memory phases, we assessed the expression of each individual gene from non-activated neurons (Basal) through early (Activated early), late (Activated-late) and neurons that were reactivated during recall (Reactivated). All differential expressed genes (DEGs, n = 1095) that met the cutoff criteria (p-value < 0.01, Log2(fold change) > 1) were unbiasedly clustered (k-mean) (Fig 5b,c). Four major clusters were identified; i) 260 genes that were down-regulated in the late phase (Dw-late cluster), ii) 207 genes that were up-regulated in the late phase (Up-late cluster), iii) 186 genes that were up-regulated in the early phase and were sustained throughout all memory phases (Stable cluster) and iv) 438 genes that were uniquely up-regulated in the reactivated neurons, during memory recall (Reactivation cluster). Similarly to our pairwise comparison, transcriptional changes in the activated-late neurons correlated higher with intronic reads, and the transcriptional landscape of reactivated neurons seems to be more mature and presented higher correlation with exonic reads (Extended Data Fig. 5a,b).
We next performed a gene ontology (GO) analysis for each cluster (Fig. 5d), to identify enriched pathways within different memory phases. The transcriptional signature of Dw-late cluster, was enriched for genes involved in regulating ‘Inhibitory synapse function’, which have been shown to play a role in neuronal excitability35,36 (Fig. 5e). In the Up-late cluster, we observed genes sets involved in positive or negative regulation of transcription, such as the v-maf musculoaponeurotic fibrosarcoma oncogene family, protein B (Mafb), snail family zinc finger 2 (Snai2) and RE1-silencing transcription factor (Rest) (Fig. 5e). Interestingly, we found that 15% (32/207) of the gene’s promoter in Dw –late cluster harbor either Snai2 (p-value - 1 × 10⁻⁹) or Rest (p-value - 1 × 10⁻³) binding sites. This dynamic of transcriptional regulators points toward a possible interplay between the Dw- and Up-late clusters. Notably, it was found that functionally distinct neuronal ensembles exist within a single memory engram, in which FBJ osteosarcoma oncogene (Fos)- and neuronal PAS domain protein 4 (Npas4)-dependent ensembles undergo distinct synaptic modifications after CFC and drive memory-guided behaviors in opposite directions37. It was shown that excitatory synaptic inputs promote memory generalization and inhibitory ones promote memory discrimination. Although these distinct ensembles could not be differentiated in the current study, these observations might explain the bi-directional expression of positive or negative transcriptional regulators, as well as up and down-regulated genes involved in neuronal excitability.
The Stable-cluster was mostly enriched for transcripts involved in cytoskeletal, axon remodeling and hippocampal-dependent memory38, including the light and heavy polypeptide neurofilaments (Nefl, Nefh) and myosin, heavy polypeptide 10, non-muscle (Myh10) (Fig. 5d,e). In order to visualize and track cytoskeletal-related changes on dendrites and spines, loxp-eYFP reporter (TAM dependent) was delivered by adeno-associated virus (AAV) into to the DG of Arc-CreERT2 mice (Extended Data Fig. 6a). Our data revealed that Activated-late and Reactivated neurons harbor significantly higher numbers of mushroom and thin spines (P< 0.0001, Extended Data Fig. 6b), with no significant changes in dendritic shaft diameter (P=0.6), when compared to the Activated -early neurons.
The unique transcriptional signature of reactivated engram neurons (Reactivation cluster) was mostly characterized by categories of ‘RNA transport/binding’ and ‘protein translational mechanisms’ (Fig. 5d). This transcriptional program includes elevated expression of kinesin family members 5a and c (Kif5a, Kif5c), eukaryotic translation initiation (Eif) factor 3 subunit A,D (3a, 3d), factor 4 subunit H (Eif4h), factor 5 subunit A (Eif5a) and ribosomal protein (Rpl27a, Rpl35, Rpl36, Rps19, Rps24, Rpsa) (Fig. 5d,e), that were previously reported to play a crucial role in transport of mRNA to synaptic compartment and autonomous control of local translation39. To further validate these findings at the translational level, we measured protein expression and localization of three members from the Eif-family by immunohistochemistry (IHC). Serval Eif-members were previously reported to be specifically involved in translation in synaptic compartments39, hence, we separately analyzed protein expression on the soma and the dendrite shafts of activated neurons (Fig. 5f). Reactivated neurons had higher expression of Eif3e proteins in the soma, as compared to the Activated-early and -late neurons (Extended Data Fig. 6c). In contrast, Eif4e was significantly more abundant in the shafts of the Reactivated neurons, when compared to Activated-early and -late neurons (Ps<0.05, Fig. 5f), providing further evidence for increased protein synthesis in those neurons.
Increased translation machinery facilitates alterations in spine shape, size and number, resulting in enhanced synaptic plasticity39–41. Furthermore, spines with larger head diameters are more likely to contain ribosomes for local protein synthesis, larger postsynaptic densities, which anchor more AMPA glutamate receptors and make these synapses functionally stronger41,42. Consistent with those reports, Reactivated neurons presented higher number of enlarged head diameters (51% from all mushroom spines), as compared to the Activated -late (18%) group (Extended Data Fig. 6d). Moreover, we found a significant increase in both glutamate receptor 1, ionotropic, AMPA1 (Gria1) mRNA (Extended Data Fig. 6e) and Gria1 protein levels only in dendritic shafts of the Reactivated neurons, as compared to the Activated -early and -late neurons (Fig. 5g). Collectively, this data supports the hypothesis that distinct temporally -separated transcriptional programs are being synchronized to maintain neuronal excitability, structural changes, protein translation and synaptic plasticity, across the lifespan of the engram ensemble.
Regulatory elements with opposing transcriptional effects interact with promoters as memory progresses from encoding to recall
We next asked how long-range promoter-enhancer interaction and chromatin state could lead to the coordinated gene expression changes observed in each of the transcriptional clusters. To achieve that, we measured chromatin accessibility over enhancers that interact with promoters, from each transcriptional cluster (Fig. 6a–c). In addition, the interaction score of those enhancers was plotted together against chromatin accessibility and their respective gene expression (Supplementary Table 10).
Fig. 6. Sequential reprograming of chromatin accessibility, promoter-enhancer interactions and gene expression over the course of engram formation.

Line graphs for each K-means cluster shows the average (log2 scale) of (a) transcriptional changes (p-values as reported in Fig. 5c, mean of n = 3 biologically independent samples) (b) chromatin accessibility (normalized RPKM values, mean of n = 3 biologically independent samples) and (c) promoter-enhancer interaction scores (as calculated by CHiCAGO, mean of Basal: n = 3, Activated -early, Activated -late and Reactivated: n = 4 biologically independent samples) Repeated measures one-way ANOVA (between groups). chromatin accessibility; Dw-Late; F (2.359, 5773) = 917.8. Up-Late; F (2.519, 4590) = 638.7. Stable; F (2.437, 4504) = 717.9. Reactivation; F (2.434, 8481) = 1425. All Ps < 0.0001. Interaction scores; Dw-Late; F (2.833, 7054) = 46.86. Up-Late; F (2.94, 5442) = 14.87. Stable; F (2.91, 5702) = 21.5. Reactivation; F (2.86, 11188) = 44.94. All Ps < 0.0001. Bonferroni’s multiple comparisons test, ***P < 0.0001.
(d-e) Characterization of motif enrichment on interacting enhancers, in each cluster. ChromHMM was used to build the emission states using HOEMR motif data base (Egr1, Ap1, Slug, Plagl1, Hic2, Rest, CTCF, Yy1, Mecp2) and previously published ChIP-seq data (Ap1-Junb12, CTCF47, Mecp248). Four states were identified as i) control – random genome sampling, ii) strong repressors iii) bivalent iv) strong activator. Fold enrichment scale (FE) 0.15–20.
Overall, all clusters showed significant incremental increase in chromatin accessibility on enhancers. Importantly, we found that chromatin accessibility occurred prior to 3D -chromatin rearrangement and gene expression alteration, providing further support of a transcriptional lag (Fig. 6a–c, Extended Data Fig. 7a,b). Specifically, in the Reactivation-cluster, our analysis revealed a bi-phasic process, in which the early phase of memory formation leads to a priming event, where enhancers become more accessible but fail to show expected changes in gene expression. Reactivation of the engram cells was associated with reorganization of promoter-enhancer interactions, where primed enhancers were brought in contact with their respective promoters in a higher frequency, and a transcriptional surge was observed (Fig 6a–c).
It was previously suggested that promoter-enhancer interactions are highly dynamic, and interactions with distinct combinatorial enhancers leads to a directional change in gene expression, dependent on whether the enhancer harbors a repressor or activator motifs14,18. To further probe this, we used chromHMM to unbiasedly segregate the genome into different states defined by motif locations that bind either transcriptional activators1 (early growth response 1 (Egr1), Ap1), transcriptional repressors43,44 (pleiomorphic adenoma gene-like 1 (Plagl1), hypermethylated in cancer 2 (Hic2), methyl CpG binding protein 2 (Mecp2), Snai2 and Rest,) or TFs that bi-directionally impact transcription and involved in the 3D-genome architecture25,44,45 (CCCTC-binding factor (CTCF), E2F transcription factor 1 (E2f), Yy1). This identified three different combinatorial states of TF-binding sites (strong repressor, bivalent and strong activator, Fig. 6d,e). Interestingly, the cluster with reduction in gene expression (Dw-late) showed a progressively increasing correlation from encoding to retrieval with enhancers that harbor transcriptional repressors and bivalent motifs (Fig. 6d, upper heatmap; Extended Data Fig. 7c,d). This data indicate that despite the observed chromatin accessibility, genes are down-regulated due to repression that is emerging from these regulatory elements.
In contrast, in the Reactivation cluster, we observed an increment enrichment for enhancers that harbor transcriptional activators together with motifs that anchor loop structures (Extended Data Fig. 7c,d). Hence, it appears that upon neuronal activity, several promoters can utilize a wide range of different enhancers to establish novel promoter-enhancer interactions that can differentially coordinate gene expression. In this model, the promoters of down-regulated genes interact with enhancers that harbor transcriptional repressors, while up-regulated genes are the result of promoter-enhancer interactions that bring transcriptional activators in close contact with respective promoters. Collectively, our data reveals a sequential reprograming of chromatin accessibility, 3D-genome architecture and promoter-enhancer interactions over the course of engram formation (Extended Data Fig. 8).
Discussion
The molecular underpinnings of engram formation have been an area of great interest. Here we take advantage of the TRAP mouse model to elucidate the dynamics of chromatin accessibility, 3-D genomic architecture and gene expression across the lifespan of an engram cell. First, we directly show that memory encoding has a vast and long-lasting effect on chromatin accessibility. Once this chromatin state is established, subsequent events such as memory consolidation and recall appear to have a minor effect on the chromatin landscape. It is possible that the chosen time point for recall may not fully capture the chromatin events of reactivated cells and subsequent chromatin changes might be associated with memory reconsolidation or extinction8. Importantly, in line with previous publications12,13,23, our data suggests that memory formation is largely an enhancer-driven phenomenon.
Second, our study provides the first comprehensive landscape of 3D-genome architecture during different phases of memory formation, as we showed re-localization of large chromatin segments and specific promoter–enhancer interactions dynamic within these compartments that enable fine-tuning of different transcriptional programs. Moreover, we show that promoters of down-regulated genes interact more frequently with enhancers that harbor transcriptional repressors, and vice versa.
Last, our work provides the first evidence for a functional priming event, that is characterized by an initial increase in enhancer accessibility during encoding, without expected transcriptional changes. Our analysis revealed that with reactivation, engram neurons utilize a subset of de novo promoter-enhancer interactions, where primed enhancers are brought in contact with their respective promoters to up regulate genes involved in mRNA transport and local protein translation in synaptic compartments. These changes corresponded to expected morphological and functional changes. Collectively, it appears that engram cells are marked at the epigenetic level and the interplay between chromatin accessibility, 3D-genome architecture and promoter-enhancer interactions describe a well-coordinated system that leads to a delayed transcriptional surge during engram reactivation.
As with any work, there were several limitations to the study. The use of the Tamoxifen-dependent TRAP mice allows for temporal resolution, but opens a labelling window of about 12 hours which could result in non-specific tagging of neurons that are not part of the CFC experience. Moreover, as previously suggested37, the Arc-tagged neurons might be heterogeneous and include different ensembles that regulate both memory discrimination and generalization. In addition, any time point before 1.5–2 hr (early), will not be sufficient to capture transcriptional and translational events caused by DNA recombination, i.e. the expression of Cre recombinase and the final expression of eYFP gene5. Hence, we believe that many early-transient clusters of DEGs were missed, as it was showed previously that many IEGs return to baseline levels after 2h (except Arc46). Lastly, although our study focused on the hippocampus, structural and synaptic plasticity have been linked to long-term storage of information in other brain regions, such as prefrontal cortex, amygdala2. Future studies should determine if these epigenetic alterations may represent a global critical process involved in the long-term formation and retention of memories or if it is unique to the hippocampal circuits.
Methods
Mice and behavior
As previously described6, ArcCreERT2(+) mice were bred with R26R-STOP-floxed- yellow fluorescent protein (eYFP) homozygous line. ~140 subsequent male offspring were genotyped using the Jackson Laboratory genotyping protocol. Mice were housed four to five per cage in a 12 hr (06:00–18:00) light-dark colony room at 22°C with 40–60% humidity. Food and water were provided ad libitum. Behavioral testing was performed during the light phase. 1h before the behavioral test, mice received one dose of 4-Hydroxytamoxifen (4-OHT, H6278, Sigma-Aldrich), which opens a ~12 hr labelling window5. In order to minimize the nonspecific eYFP label, one day prior to the behavioral task (e.g. CFC), mice were single housed in a 24h dark/dark room. In addition, in order to reduce anxiety levels, a tube was added to the cage for shelter and nesting. In the next day, mice were injected with TAM 1h before the CFC. Following the behavioral task, mice were either euthanized after 1.5–2 h and brain were collected. or placed back into the dark room for the following 48 hr. After mice were taken out of the dark, they were returned to normal 12 hr (06:00–18:00) light-dark cycle, in the same room. 3 days later (total of 5 days after the CFC), half of the mice cohort were euthanized and brain were collected, while the other half returned to the testing room, where they exposed to the fear inducing cue (tone and context). All mouse work was approved by the Committee for Animal Care of the Division of Comparative Medicine at the Massachusetts Institute of Technology
Contextual fear conditioning
Contextual fear conditioning (CFC) apparatus and the acquisition program was from TSE-Systems. Mice were introduced into the CFC chamber, following 3 minutes of initial habituation 3 kilo Hz tone with 80 DB intensity was presented for 30 seconds and was co-terminated with 0.7 mA foot shock for 1 sec. 70% isopropanol was used between experiments to clean the cages. 5 days later mice were introduced into the original conditioned context paired with the tone and freezing levels were measured for 3 min (TSE software default parameters used to monitor freezing behaviors), to asses’ contextual memory. Context B was a modified context A. The stainless-steel bars were covered with a white plastic insert, the outer walls of the chambers were covered with shapes of duct tape to change the appearance of the chamber. The chamber was scented with vanilla, the room lighting was much brighter and the mice were transported to the apparatus in a different cart from context A.
Drugs
Recombination in ArcCreERT2 × R26R-STOP-floxed-EYFP transgenic mice was induced using 4-Hydroxytamoxifen (4-OHT, H6278, Sigma-Aldrich). 4-OHT was dissolved in 2.5ml of EtOH /100% and rocked on a shaker for 30 min. Next, 5ml of corn oil was added and rocked on a shaker for 1h. Finally, tubes were placed for 30min in 60°C to allow the full evaporation of EtOH. Single injection of 50 mg/kg was injected intraperitoneally (i.p.).
Immunohistochemistry (IHC)
Mice were transcardially perfused with ice cold 25 ml of phosphate buffered saline (PBS) followed by 40 ml of 4% paraformaldehyde in PBS. Brains were removed and post-fixed in 4% PFA overnight at 4°C and transferred to PBS until sectioning. Brains were mounted on a vibratome stage (Leica VT1000S) using superglue and sectioned with the slice thickness of 40 μm. Slices were washed with PBS and blocked using 1 % Bovine Serum Albumin (BSA) prepared in PBS containing 0.1% Triton-X100 (PBST) for 2 h at room temperature. Blocking buffer was aspirated out and the slices were incubated with the appropriate primary antibody (Supplementary Table 11) overnight at 4°C on a shaker. Slices then were washed three times 15 minutes each with the blocking buffer, and then were incubated with the Alexa Fluor 488, 594 or 647 conjugated secondary antibodies for 2 h at room temperature. Following three washes 15 minutes each with blocking buffer and one final wash with PBS for 10minues, slices were mounted with fluromount-G (Electron microscopic Sciences).
In Situ Hybridization (RNAscope®)
Samples were prepared based on the manufacturer’s instructions for RNAscope® multiplex fluorescent v2 assay (Advanced cell diagnostics, USA), with few modifications and combined with the Immunohistochemistry (IHC) protocol. First, samples were stained for primary (Arc and GFP) and secondary (Alexa Fluor 488 and 594, respectively) antibodies (as described in the IHC protocol above). Brain slices were embedded on a glass slide and dehydrated for 30 min in RT. Next, a barrier was drawn around each section with the Immedge™ hydrophobic pen and samples were treated with RNAscope® Hydrogen Peroxide for 10 min at RT (no target retrieval and protease treatment were applied). Based on manufacturer’s instructions, sections were subjected to probe hybridization (RNAscope® Probe- Mm-Gria1, 26241, Advanced cell diagnostics), amplification and HRP-C1 signal development using the TSA® Plus Cyanine 5 channel.
Imaging analysis
Images were acquired using a LSM 710 or LSM 880 confocal microscopes (Zeiss) with a 10×, 20×, 40× or 63× objectives at identical settings for all conditions. Images were quantified using ImageJ 1.42q or Imarisx64 8.1.2 (Bitplane, Zurich, Switzerland). For each experimental condition, five coronal sections from at least five animals were used for quantification.
Quantification of tagged cells
The surfaces module was utilized to detect Arc+ and eYFP+ cells. Double positive cells (co-localization of Arc+/eYFP+) were then counted using the Surface-To-Surface Xtension module. After applying the ‘area’ filter (>6μM) to remove unspecific labeling, quantification of the double positive cells was carried in the CA1, CA3 and DG.
Quantification of Eif and Gria1 proteins/mRNA
The surfaces module was utilized to detect and 3D render neurons axons based on the GFP signal. EiF2a, Eif4E, Eif3E and Gria1 -positive puncta were then counted using the spots module. Finally, the Spots Close -To -Surface Xtension module was run to find the subset of spots that are closer to the surface objects than the defined 1uM threshold, and exclusion of spots that fall outside this range.
Spines morphology
Spines were classified to three types base on the spine length (L), diameter of the head (Dh) and the diameter of the neck (Dn). Stubby spines – Dn = L, Thin spines – L > Dn and Dh ≥ Dn, Mushroom spines – Dh ≥ 2Dn, Enlarged mushroom spines – Dh ≥ 2Dn.
Tissue preparation
Hippocampal tissue was extracted and flash frozen. After extraction, samples were immediately homogenized in 0.5 mL ice cold PBS with protease inhibitors (Pi) (11836170001, Roche). To mitigate the sorting impact as much as possible, in nc-RNAseq and capture-HiC experiments only, the suspension was fixed with 1% (for nc-RNAseq/HiC) or 2% (pc-HiC) paraformaldehyde for 10 min, quenched with Glycine 2.5M for 5 min and washed twice with 5 mL of PBS. This process preserves the transcriptional and chromatin landscape and minimizes sorting bias. For ATACseq, RNAseq and capture-HiC, the suspension was centrifuged at 1200 g, 4°C, for 5 minutes and the pellet was resuspended in 5 mL NF-1 hypotonic buffer (0.5% Triton X-100/0.1M Sucrose/5mM MgCl2/1mM EDTA/10mM Tris-HCl, pH 8.0, Pi). Next, suspension was dounce-homogenized (pestle A) with 30 strokes and the pestle was washed with extra 5mL NF-1 buffer for a combined total of 10 mL. Suspension were collected all in a 15 mL conical tube, filtered with 70 μm mesh filter (08–771-2, Falcon) and incubated on ice for 30 min. Pelleted nuclei (all centrifuge were 4°C, 1,600 × g for 15 min) were resuspended in 10 mL PBS+1%BSA+Pi and incubated on ice for 1 h. Nuclei were spun down and the pellet was resuspended in 1 mL PBST+1%BSA+Pi and incubated with NeuN, Arc and GFP primary antibodies for overnight in 4°C. Unbound antibodies were washed out twice with 5 mL of PBST and finally resuspended in 1 mL PBS+1%BSA+Pi and secondary antibodies for 2–4 h at 4°C. Follow two washes, nuclei were resuspended in 0.5 mL (PBS+1%BSA+Pi) and filter with 40 μm mesh filter for FACS sorting. 4′,6-Diamidine-2′-phenylindole dihydrochloride (DAPI) was added directly to the FACS tubes (1:5000, 10236276001, Sigma-Aldrich).
Flow cytometry
For flow cytometry, nuclei were gated first using forward and side scatter pulse area parameters (FSC-A and SSC-A) excluding debris, followed by exclusion of aggregates using pulse width (FSC-W and SSC-W). Then isotype control staining was used to set NEUN+, ARC+ and GFP+ gates. In order to secure a homogeneous neuronal population, the NeuN+ population was gated before gating populations based on ARC+ and GFP+ fluorescence. We sorted four different population form three different time points; Approximately 1.5–2 hours after exposure to FS i) NeuN+/GFP+ ii) NeuN+/GFP-. After five days, in the absence of retrieval, we collected iii) NeuN+/GFP+. In a different cohort, mice were re-exposed to the conditioned stimulus. 1.5–2 hours after re-exposure we collected iv) NeuN+/ARC+/GFP+. All nuclei were sorted into 1.5 mL ppendorf tubes contains; 500 μl PBS+1%BSA+Pi for ATCAseq, 200 μl of digestion buffer (RecoverAll™ Total Nucleic Acid Isolation Kit for FFPE, Cat. AM1975, Invitrogen) for RNAseq, 500 μl fresh ice-cold lysis buffer (10mM Tris pH=8, 10mM NaCl, 0.2% Igepal CA-630, Pi and PCR grade water) for Hi-C/capture-HiC. Data analysis was performed with Flowjo (v10).
ChIP-qPCR
Immediately follow sorting, 10,000 cells were pelleted at 4 °C, 1,600 × g for 15 min and re-suspended in SDS lysis buffer. ChIP was conducted based on the manufacturer’s instructions for ChIP-IT High Sensitivity® (HS) Kit (Catalog No. 53040, Active Motif, USA) using anti-H3K4me1 (Abcam, ab8895, 1:100) and anti-H3K27ac (Abcam, ab4729, 1:100) antibodies. ChIP assays were performed in an Bio-Rad CFX96 connect real-time PCR unit using SsoFast™ EvaGreen® qPCR reagent mix (Bio-Rad, 172–5202). Samples were assayed in triplicates and results were normalized to input. Sequences of primer pairs for ChIP–qPCR assays are listed in Supplementary Table 12.
ATAC-seq
libraries preparation
ATAC seq libraries were prepared as previously described in49 with minor modification. 10,000 cells from each group, were pulled from 8–10 different mice and considered as N=1. 3–4 biological replicates (N=3–4) were used for library preparation. Immediately follow sorting, cells were spun down (4°C, 1,600 × g for 15 min) and resuspended in fresh 50 ul cold lysis buffer (0.15% NP-40 instead of Igpal) and rocked on ice for 10 min. Next, tagmentation reaction (Nextera DNA sample prep kit 24 reactions, FC-121–1030, Illumina) was carried out in 25 ul volume (12.5 μl TD, 1.25 μl TDE1, 11.25 μl nuclease-free water), for 30 min at 37c with gentle rocking. Tagmented DNA fragments were amplified and barcoded using PCR reaction (1 cycle; 5min – 72c, 30sec – 98c, 10 cycles; 15sec – 98c, 30sec – 60c, 3min – 72c). Following the manafacturer’s protocol, amplified DNA was cleaned and purified using 1.8x AMPure beads (AmpureXP beads, Beckman Coulter, A63880). After bioanalyzer QC for library size and distribution, libraries were sequenced on the Illumina Nextseq 550 platform at the MIT BioMicro Center.
ATAC-seq analysis
The raw fastq data of 40-bp paired-end sequencing reads were aligned to the mouse mm9 reference genome using Bowtie 2.0 in paired-end mode50. The Samtools collection51 was used to sort, remove PCR duplicates (rmdup), index BAM files (index), and calculate library statistics (flagstat, see Supplementary Table 13). BAM files were downsampled from properly aligned, paired and unique reads to 50M. Open chromatin peaks were analyzed using MACS252 software Differentially accessible regions (DARs) were identified by Diffbind v1.16.353 with default parameters and settings to use DESeq2 (cutoff; FDR < 0.01; fold changes > 1.5). Full matrix of normalized counts (RPKM54) was retrieved by DiffBind package. For generation of bigwig tracks, pileup signal files (fragment pileup per million reads) in bedGraph format were constructed by using the MACS2 callpeak function with the -B –SPMR flags. Then, normalized fold enrichment (FE) over input lambda tracks were generated using the bdgcmp function of MACS2 with the setting -m FE. Then bedGraph files were converted to bigwig format.
IGV55 tools were used for visualization of bigwig files. ChromHMM56 was used to establish a chromatin state model from two independent studies that utilized bulk hippocampus tissue before and after foot shock21,22 and to determined fold enrichment of DARs over state model. Motif enrichment analysis57,58 and peaks annotation was performed by HOMER59 tools. All codes are available in supplementary software file
RNA-seq
RNA extraction and library preparation
Immediately follow fixation and sorting (see tissue preparation), 4 ul of Protease was added to digestion buffer (RecoverAll™ Total Nucleic Acid Isolation Kit for FFPE, Life Technologies, AM1975). Samples were incubated in heat blocks for 15 min at 50°C, then 15 min at 80°C. Next, 0.75 mL of Trizol LS (TRIzol™ LS Reagent, Thermo Fisher Scientific, 10296028) and 0.2 mL of Phenol : Chloroform solution (Phenol : Chloroform : Isoamyl Alcohol,1 Phase, VWR International, K169) was added to each sample followed by vigorous shaking for 5 min at room temperature (RT). Suspension was placed into Phase lock gel heavy tubes (PLG, 5 Prime, 2302830) and spun down at 13,000rpm for 5 min. Aquatic phase with nucleic acids was extracted from the tubes to fresh ppendorf tube with equal amount of ethanol 100%. RNA purification was carried by Direct-zol™ RNA MicroPrep kit (Zymo Research, R2060) for RNA purification, according to the manufacturer’s instruction. RNA was eluted (10 ul, DEPC) and then stored at −80 °C. SMARTer Stranded Total RNA-Seq Kit v2 – Pico Input Mammalian (Clontech, 635006) was used for the library preparation and amplification. 3 biological replicates (N=3) were used for library preparation. Libraries were prepared according to the manufacturer’s instructions with no extra fragmentation step (FFPE, option 2, see manual), with depletion of ribosomal cDNA and final PCR amplification (15 cycles). Libraries were sequenced on the Illumina HiSeq 2000 platform at the MIT BioMicro Center.
RNA-seq analysis
The raw fastq data were aligned to the mouse mm9 reference genome using Bowtie 2.0. The mapped reads from gene bodies (including exons and introns reads) were processed by Cufflinks 2.260 and DEseq261 with UCSC mm9 reference gene annotation to estimate transcript abundances. Differential gene expression and downstream analyses were performed using DEseq2 and custom R scripts. Relative abundance of transcripts was measured by fragments per kilobase of exon per million fragments mapped (FPKM).
For the analysis of transcriptional programs, the expression of each gene was assessed for different memory phases (Activated -early, Activated -late, Reactivated) by their log2 fold change (log2FC) from the basal-state. 1095 of differentially expressed genes (DEGs) passed the cutoff criteria, in which we observed at least in one comparison of P-value of < 0.01 and log2(FC) > 1. Then, genes where unbiasedly clustered by k-mean function.
Chromosome conformation capture (Hi-C)
Nuclei from fixed cells (see tissue preparation) were sorted into 1.5 mL eppendorf tubes containing 500 μl fresh ice-cold lysis buffer (10mM Tris pH=8, 10mM NaCl, 0.2% Igepal CA-630, Pi and PCR grade water) and frozen on dry ice and stored at −80c until they were used. Hi-C libraries were prepared from 100,000 cells/per group (collected from two animals) in two biological replicates, using Dovetail™ Hi-C kit manual (v.1.03, Dovetail Genomics, Chicago, USA). The six Hi-C libraries were sequenced (paired-end) on Illumina Nextseq 500 platform. HOMER Hi-C pipeline was used to filter experimental artefacts such as circularization, self-ligations and PCR duplicates. Filtered reads were aligned to the reference mouse genome (mm9) and further processed using HOMER HI-C pipeline.
HOMER’s Hi-C tools were used to perform principal component analysis (PCA) on the Hi-C data to identify sub-nuclear compartments (A and B) at 50 Kb resolution (see supplementary software). For compartment switch analysis, we first subtracted the PC1 values between the groups. Next we identified the top BtoA transitions as regions with PC1 change above the 90th percentile and the top AtoB transitions as regions with PC1 change below the 10th percentile. Since sub-nuclear compartments are regulated as units of several hundred kilobases, we consolidated consecutive 50 Kb AtoB or BtoA segments that were within a distance of 100 Kb of each other. Consolidated domains that were less than 200 Kb in total size we discarded. Compartment switch was only considered if a negative value was transformed to a positive value (and vice versa). Finally, positive and negative values of the first component were compared between all three populations of neuron (Basal, Activated -early and Activated -late).
Promoter capture Hi-C
Follow fixation and sorting (see tissue preparation) cells were sorted into 1.5 mL eppendorf tubes contains 500 μl fresh ice-cold lysis buffer (10mM Tris pH=8, 10mM NaCl, 0.2% Igepal CA-630, Pi and PCR grade water), frozen on dry ice and stored in −80c until they were used. Hi-C libraries were prepared from 10,000 cells /per group (N=3–4), as previously described62, with some modification. Samples were spun down (4°C, 1,600 g for 20 min) and the pellet was resuspended in 400 μl of 1.2x Cutsmart buffer (New England Biolabs, USA). First restriction digestion was carried as described in the original protocol with 1,500 U of HindIII (R3104L, New England Biolabs, USA), as the 6-base cutter (instead of BglII in the original protocol). After Biotin labeling and overnight ligation (see original protocol for details), samples were spun down (4°C, 1,600 × g for 15 min) and the pellet was resuspended in 25 μl of PBS. The suspension was incubated in 65c with 3 μl of proteinase K for 12–16h. Purification of Hi-C DNA was carried as described in the original protocol with 100 μl of streptavidin-beads (Dynabeads M-280–streptavidin, Life Technologies, 11205D). For the second restriction enzyme we used the 4-base cutter Hpych4V (10 U /per sample, R0620S, New England Biolabs, USA). After A-tailing reaction (see original protocol for details), samples were amplified using PCR (17 cycles) and purified with AMPure XP beads. Hi-C libraries were eluted in 20 ul of 10 mM Tris-HCl (pH 8.5). Bait capture system design for Promoter Capture Hi-C – A list of 5000 mouse gene promoters was obtained from the previously published protocol in Schoenfelder. Et al.29. The list contains only transcripts with a biotype of protein-coding regions, with HindIII restriction fragments sites. Two 120 bp capture probes were designed, one to each end of the fragment. The probes were synthesized by Agilent Technologies according to the SureSelect target enrichment system (Agilent Technologies).
Promoter capture Hi-C library preparation and sequencing – To capture Hi-C ligation products containing promoter sequences, we used the previously published protocol29. Briefly, hybridization blockers (Agilent Technologies) were added to the Hi-C DNA libraries. Hybridization buffer and capture bait RNA were prepared according to the manufacturer’s instructions (SureSelect Target Enrichment, Agilent Technologies). Next, the Hi-C library DNA/hybridization blockers were heated for 5 min at 95°C, before lowering the temperature to 65°C. Hi-C library DNA was mixed with hybridization buffer (prewarmed for 5 min to 65°C), and subsequently with the custom-designed capture bait system (prewarmed for 3 min to 65°C), consisting of 10,000 biotinylated RNAs targeting the HindIII restriction fragment ends of 5000 mouse gene promoters (Agilent Technologies, see Supplemental Material for capture bait design). After 24 h at 65°C in the PCR machine, biotin pulldown (MyOne Streptavidin T1 Dynabeads; Life Technologies) and washes were performed following the SureSelect Target enrichment protocol (Agilent Technologies). After the final wash, beads were resuspended in 30 μL NEBuffer 2 without prior DNA elution, and a post-capture PCR (four amplification cycles using illumine universal primers) was performed on DNA bound to the beads via biotinylated RNA. Capture Hi-C libraries were paired-end sequenced (Nextseq 500, Illumina).
Promoter capture Hi-C analysis – the HiCUP pipeline63 was employed to process the raw fastq sequencing reads. This pipeline was used to map the read pairs against the mouse (mm9) genome, to filter experimental artefacts (such as circularized reads and re-ligations) and to remove duplicate reads. For the pc-HiC data, the resulting BAM files were downsampled and processed using CHiCAGO version 1.2.064, following the default settings to call significant interactions. Full details of this pipeline are available from Babraham Bioinformatics (http://www.bioinformatics.babraham.ac.uk/).
Stereotaxic Adeno-associated Virus Injection
ArcCreERT2 mice were anaesthetized with avertin and for AAV9-EF1a-DIO-hChR2-EYFP (Serotype5, obtained from UNC viral core) virus infusion. First, a small hole was made in the skull above the dorsal hippocampus (relative to Bregma: anterior-posterior −2.0 and medio-lateral ± 1.5), a Hamilton syringe with 33-gauge needle was lowered to −1.8 DV and 500 ηl of virus was infused with a flow rate of 50 ηl per minute into both hippocampi. The needle was withdrawn, following a 10 minute post-injection period and mice were allowed to recover for 4 days.
Statistical analysis
For nRNA-seq, ATAC-seq, pc-Hi-C and Hi-C experiments, no statistical methods were used to predetermine sample sizes, but our sample sizes were similar to those reported in similar publications13,20,21,27,29,37. In addition, in these experiments, sample size was estimated according to data variance between biological replicates and distance to control condition (Basal group). No statistical methods were used to pre-determine sample sizes in 3C and ChIP-qPCR experiments. Sample sizes were chosen based on prior literature using similar experimental paradigms65. For all other experiments sample size was calculated by power analysis (http://www.lasec.cuhk.edu.hk/sample-size-calculation.html), to estimate the number of replicates required assuming a 5% significance level. All measurements were taken from distinct samples and the same sample was never measured repeatedly.
Values are presented as dot plots with individual data points, violin plot or boxes and whiskers, with mean interquartile range, the minimum, maximum and ± SEM, as indicated in the figure legends. Statistical analyses were designed using the assumption of normal distribution, although that assumption was not explicitly tested. Statistical comparisons included the Pearson correlation (parametric, two-sided), Student’s t-test (two-sided, unpaired), one- or two-way analysis of variance (ANOVA), followed by Dunnett’s or Bonferroni’s multiple-comparison post-hoc tests (as specified in the figure legends) P values < 0.05 were considered to be statistically significant (unless log2FC criteria was also considered, as specified in the figure legends or main text).
Statistical significance of differences between groups was analyzed using the following software and statistical tests: (1) Differential peaks analysis: Diffbind (v2.10) (2) Significant interaction analysis: CHiCAGO (v1.2.0). (3) Differential gene analysis: DESeq2 v.1.22.2. (4) Statistical analyses for motif and annotation enrichment: HOMER (v4.1) (5) Other software for data and statistical analysis: R Studio (v3.5.2) and R-packages: ggplot2 (v3.1.0), circlize (v0.4.5), ComplexHeatmap (v1.2.0), gridExtra (v2.3), GeneOverlap (v1.18.0) and bedr (v1.0.6), GraphPad Prism (v8.2.1) Microsoft Excel, ChromHMM (v1.15), Bedtools (v2.25.0), DeepTools (v3.2.1), IGV (v2.3), Washu browser (v50.3.6).
Reproducibility
TRAP-mice (n=~140) with the same age (~90 days) and sex (Males) were raised in the same conditions and randomly allocated to the different experimental groups. Blinding was not applied in the behavioral studies (CFC) and imaging acquisition because animals/samples need to be controlled by treatment or conditions. Individuals generating the NGS data were blinded to the outcome measures. Individuals preforming the imaging quantification analysis for Eif, Gria1 proteins/mRNA and spine morphology were blinded to the groups. All IHC and FACS experiments were repeated independently with similar results.
Reporting Summary
Further information on research design is available in the Nature Research Reporting Summary linked to this article.
Data Availability
Supplementary Tables 1–11 provide direct access to the main results derived from the transcriptome and epigenome assays presented in this study. In addition, raw and processed datasets generated during the study are available in the GEO repository using the accession number GSE152956. Any other data that support the findings of this study are available from the corresponding author upon request
Code availability
Codes used for the analysis of this study are available in the supplementary software appendix. A live version of the custom R scripts generated during this study are available in the Github repository https://github.com/vishnudileep2000/IntronVsExon_RNAseq
Accession codes
Raw and processed datasets generated during the study are available in the GEO repository using the accession number GSE152956. (https://www.ncbi.nlm.nih.gov/geo/query/acc.cgi?acc=GSE152956)
* SubSeries that are linked to GSE152956:
https://www.ncbi.nlm.nih.gov/geo/query/acc.cgi?acc=GSE152775
https://www.ncbi.nlm.nih.gov/geo/query/acc.cgi?acc=GSE152953
https://www.ncbi.nlm.nih.gov/geo/query/acc.cgi?acc=GSE152954
https://www.ncbi.nlm.nih.gov/geo/query/acc.cgi?acc=GSE152955
Extended Data
Extended Data Fig. 1: Reactivated cells play a key role in encoding prior experience.

(a) Schematic of the Targeted Recombination in Active Populations (TRAP), which requires two transgenes, one that expresses CreERT2 from an activity-dependent Arc promoter (ArcCreERT2) and one that allows expression of the eYFP reporter, in a Cre- dependent manner. Administration of TAM to TRAP mice results in a permanent eYFP label in the initially activated Arc neurons. Without TAM, CreERT2 is retained in the cytoplasm of active neurons in which it is expressed, so no recombination can occur.
(b) Representative images and co-localization analysis between endogenous Arc protein (Cyan) and the Arc:eYFP reporter (Magenta), 1.5 h after the FS. Upper panel shows images from the whole hippocampus and lower panel images shows neurons from the DG. Magenta arrows – neurons with only Arc:eYFP reporter signal, Cyan arrows – neurons with only endogenous Arc signal, White arrows – neurons with signal from both populations. Analysis was performed using IMARIS module (co-localization tools) and revealed an average of 84% overlap between the two populations, The scale bar represents 100 μm. n = 3 mice /5 slices per animal, boxplot indicates the mean, interquartile range and the minimum and maximum.
(c) Contextual fear conditioning (CFC) freezing test. Percentage of the time freezing levels were measured during habituation (Day 0, Pre-FS) and during the re-exposure (Day 5) to the fear-inducing cue. n = 30 mice, boxplot indicates the mean, interquartile range and the minimum and maximum, two-sided unpaired Student’s t-test, t=15.63, df=16, ****P< 0.0001.
(d) Representative images of Activated -late and Reactivated neurons in the hippocampus in two experimental groups; CFC with (TAM) or without (NO-TAM) tamoxifen administration. The scale bar represents 100 μm.
(e) Contextual fear conditioning (CFC) freezing test. Percentage of the time freezing levels were measured during the re-exposure to the fear inducing cue (A-A) and during the exposure to a novel neutral environment (context B). n = 15 mice, boxplot indicates the mean, interquartile range and the minimum and maximum, two-sided unpaired Student’s t-test, t=8.506, df=14, ****P< 0.0001.
(f) Representative images of Activated -late and Reactivated neurons from the DG in the A-A or A-B group.
Extended Data Fig. 2: Stable DARs are predominantly enriched for enhancers marks.

(a) Workflow for the flow cytometry dissection of different neuronal population from the hippocampus, during memory formation and retrieval. Representative FACS plots showing expression of all population (left panel). Further selection was made on single nuclei and NeuN+/DAPI+ population (middle panel). Last, selection was made on the gated sub-population; GFP+ (adjusted to ~2.5% from all cells), ARC+/GFP+ (~0.15% from all cells) and nuclei were sorted to 1.5 ml Eppendorf tubes coated with 200ul of 1% PBS.
(b) Venn Diagram (left) and table (right), which illustrate the overlap between the DARs identified in the different pairwise comparisons during memory formation and recall.
(c) Resampling-based statistical analysis was performed to determine if the enrichments of chromatin states over ChromHMM emissions (observed) are statistically significant. Expected enrichment was calculated by performing 10,000 randomized sets of overlaps (permutations) between ‘all accessible sites’ and ‘all histone modifications sites (i.e. all emissions)’ loci and presented as histogram in the figure. Sample size of each randomized set was determined by the size of DARs from each state. The mean and standard deviation of the sample was calculated (Supplementary Table 3). The number of observed overlaps between DARs and each emission was calculated and presented as lines. z-score was calculated as fallows; Z = (observed values (X) – mean of the sample (μ))/(standard deviation of the sample (σ)). z-score Basal vs. Early; S.E 10.5, W.E 6.9. Stable; S.E 16.9, W.E 12.7, all p < 0.0001, z-score Early vs. Late; S.P 91.7, W.P 38.7. Late vs. Reactivated; S.P 26.8, W.P 28.9, all p<0.0001. p-values (Two-Sided) were calculated from z-table. Full analysis is reported in supplement table 3.
(d) Pie chart shows percentage of different enhancer states, for all stable regions. Overlap of each individual stable region was performed with previously published H3K4me1 and H3K27ac ChIP-seq data, obtained 1h after FS21. Enhancers states were classified as ‘primed’ – overlap with regions marked with only H3K4me1, ‘active’ – with H3K4me1/H3K27ac or ‘latent’ – no overlap.
(e) Motifs identified from nucleosome free regions (NFR) on the ATAC-seq tracks from each state (Basal, Activated -early, Activated -late and Reactivated). Peaks were divided into positions that annotated to promoters (5kb from TSS) and enhancers (>5kb from TSS). Circle size indicate percentage of enrichment (1–50%). Color indicates –log(P-value).
Extended Data Fig. 3: Coordinated priming of the epigenetic state during memory encoding and consolidation facilitates long-range interactions during reactivation.
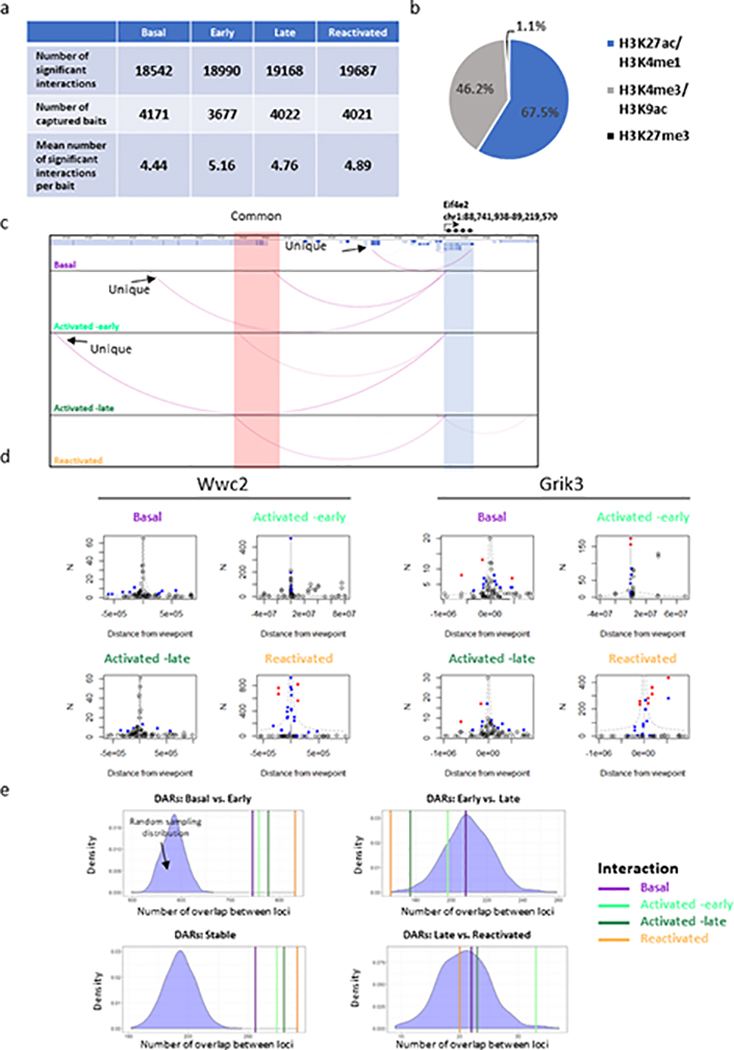
(a) The properties of CHiCAGO-detected interactions in each phase (Basal, Activated -early, Activated -late and Reactivated). Default settings and a score threshold of 5 were used in significant interaction calling, performed jointly on all replicates.
(b) Pie chart represent the percentage of all CHiCAGO-detected interactions that are demarcated by either H3K27ac/H3K4me1 (67.5% enhancers marks), H3K4me3/H3K9ac (46.2% promoters mark) or H3K27me3 (1.1% repressive marks).
(c) WashU epigenome browser image, encompassing ~ 500 Kb region around the Eif4e2 genes. Arcs shows significant common (red rectangle) and unique (arrowed) enhancers that interacts with promoters (blue rectangle).
(d) Examples of interactions called by CHiCAGO. Plots showing all the read counts from bait-other-end (enhancer), within 500–700 kb (upstream and downstream) of the Grink3 and Wwc2 promoters. Significant interactions detected by CHiCAGO (score ≥5) are shown in red, and sub-threshold interactions (3 ≤ score < 5) are shown in blue. Grey lines show expected counts and dashed lines the upper bound of the 95 % confidence intervals.
(e) Overlap enrichment analysis between interacting enhancers and DARs, using a permutation procedure on 10,000 randomized sets of accessible sites. Histogram present random sampling distribution of accessible sites for each condition (Basal vs. Activated -early, Activated -early vs. Activated -late, Activated -late vs. Reactivated, Stable). The number of overlapped loci is presented in colored lines from Basal, Activated -early, Activated -late and Reactivated neurons. DARs of BAS vs. Activated -early (Z-score; 7.1, 7.7, 8.5, 10.9). DARs of Activated -early vs. Activated -late (Z-score; −0.1, −0.8, −2.4, −3.2). DARs of Activated -late vs. Reactivated (0.4, 1.8, 0.4, −0.2). DARs of stable (Z-score; 1.7, 2.0, 6.5, 7.3).
Extended Data Fig. 4: Chromatin changes that occur during the early phase enable transcriptional changes observed at a later time point, primarily in reactivated engram cells.

(a) Overlap analysis between gene names from the pair-wise differential analysis and previously published data of: i) activated DG granule cells 1 h after novel exposure32 ii) 24 h after FS20 and iii) after prolonged stimulation (6h) of mouse cultured cortical neurons with KCl33. Analysis was carried by GeneOverlap R package.
(b) Exonic (red) and intronic (blue) reads were quantified separately across all conditions and compared to transcriptional activity as measured by DEseq2. Reads were normalized (RPKM) and the log2FC changes are presented for each state. violin plot indicates the mean, interquartile range and the minimum and maximum, one-way ANOVA (parametric, unpaired), Basal vs. Early; F (5, 248) = 389.9. Early vs. Late; F (5, 2374) = 2183. Late vs. Reactivated. F (5, 1357) = 945.5, All Ps < 0.0001. Bonferroni’s multiple comparisons. n.s = non-significant, ***P < 0.0001.
(c) Exon/Intron ratios were measured in each cluster across all conditions (Log2FC scale). violin plot indicates the mean, interquartile range and the minimum and maximum, one-way ANOVA (parametric, unpaired), F (5, 1143) = 260.2, P<0.0001. Bonferroni’s multiple comparisons test. n.s = non-significant, ***P < 0.0001.
(d) Overlap analysis between DARs and DEGs during different memory phases. DARs on Intergenic and introns regions were mapped to their respective genes with the pc-HiC interaction maps. Overlap analysis was carried by GeneOverlap R package. P-value (numbers) and odds ratio (color) from Fisher’s exact test are presented in the heatmap. n.s – not significant.
(e) Pearson correlation between log2FC values of DARs and log2FC DEGs that were annotated to those region (intergenic regions were mapped via the pc-HiC data set). Chromatin accessibility changes were compared with parsed exonic reads (red line), intronic reads (blue lines) and total transcriptional changes (both intronic and exonic reads) as measured by Desq2 (gray line). All r and p-values are reported in supplementary table 9.
Extended Data Fig. 5: Transcriptional changes in the activated-late neurons correlated higher with intronic reads and reactivated neurons presented higher correlation with exonic reads.

(a) Exonic (red) and intronic (blue) reads were quantified separately across all conditions for each of the clusters identified in Fig 5B. Reads were normalized (RPKM) and the log2FC changes are presented for each cluster.
(b) Exon/intron ratios were measured in each cluster across all conditions. Violin plot indicates the mean, interquartile range and the minimum and maximum, n = 3 biologically independent samples one-way ANOVA (parametric, unpaired), Dw –Late cluster; F (3, 968) = 139.4, P<0.0001. Up -Late cluster; F (3, 734) = 15.95, P<0.0001. Stable -cluster; F (3, 652) = 93.97, P<0.0001. Reactivation -cluster; F (3, 1600) = 485.2, P<0.0001. Bonferroni’s multiple comparisons test to Deseq2 reads. ***P < 0.0001.
Extended Data Fig. 6: Distinct temporally transcriptional programs are being synchronized to maintain neuronal excitability, structural changes and protein translation in synapses in the engram ensemble.

(a) Schematics representation of the experimental design. Three weeks prior to the CFC test, ArcCreERT2 mice were bilaterally injected to the DG with AAV9-EF1a-DIO-hChR2-EYFP. In a similar manner to the TRAP system, eYFP reporter is only expressed in a Cre- dependent manner in the presence of tamoxifen. In the right panel, representative IHC images of the DG. Green – AAV-eYFP, Red – endogenous Arc. The scale bar represents 50 μm.
(b) Spines morphology assessment during different memory phases. Right panel shows a single eYFP+ dendritic shaft with different types of spines (Stubby, Thin, Mushroom, Enlarged mushroom). The scale bar represents 5 μm. boxplot indicates the mean, interquartile range and the minimum and maximum, Activated -early: n = 4 mice /5 section per animal, Activated -late: n = 4 mice /4 section per animal, Reactivated: n = 4 mice /2 section per animal. one-way ANOVA (parametric, unpaired), Stubby; F (2, 36) = 2.313, P=0.1135. Thin; F (2, 36) = 35.12, P<0.0001. Mushroom; F (2, 36) = 38.42, P < 0.0001. Bonferroni’s multiple comparisons test, ***P < 0.0001.
(c) Representative IHC images and quantification of the protein levels of two members of the EIF family; (left) Eif2a and (right) Eif3e. The scale bar represents 10 μm. Data for dendritic shaft is presented as a ratio between number and the length (μM). n = 4 mice /5 section per animal, boxplot indicates the mean, interquartile range and the minimum and maximum, one-way ANOVA (parametric, unpaired) with Bonferroni’s multiple comparisons test, n.s - not significant, Eif2a Shaft; F (2, 20) = 4.484, P=0.0246. Soma; F (2, 21) = 19.58, P < 0.0001. (Activated -early vs. Activated -late *P = 0.0142, Activated -early vs. Reactivated *P < 0.0001, Activated -late vs. Reactivated *P = 0.0303). Eif3e Shaft; F (2, 14) = 1.983, P = 0.1745. Soma; F (2, 23) = 8.309, P = 0.0019, (Activated -early vs. Reactivated *P = 0.0057, Activated -late vs. Reactivated *P = 0.0055).
(d) Pie chart present the percentage of enlarged mushroom spines (Dh ≥ 3Dn) and mushroom spines from Activated -late and Reactivated neurons.
(e) Representative images (left panel) and quantification (right panel) of Gria1 mRNA levels, during different phases of memory. Data is presented as a ratio between number of puncta and the dendritic shaft length. The scale bar represents 10 μm. N = 4 mice /5 section per animal, boxplot indicates the mean, interquartile range and the minimum and maximum, Shaft; one-way ANOVA (parametric, unpaired) F (2, 15) = 10.41, P = 0.0015. Bonferroni’s multiple comparisons test, **P = 0.0011. lower panel - Soma; one-way ANOVA F (2, 12) = 0.13, P = 0.88.
Extended Data Fig. 7: Interactions with distinct combinatorial enhancers leads to a directional change in gene expression.

(a) Venn diagrams shows percentage of overlap between chromatin accessibility (DARs) across all memory phases (BAS vs. Activated -early, light green grid circle; Activated -early vs. Activated -late, dark green grid circle; Activated -late vs. Reactivated, orange grid circle) and total transcriptional changes from all identified clusters (Dw –late, Up –late, Stable, Reactivation, blue grid circle). Intergenic and introns DARs were mapped to their respective genes with the pc-HiC interaction maps. Percentage of overlap was calculated from all identified DEGs in the clusters (n = 1095).
(b) Overlap analysis between DARs (pairwise) and DEGs from each cluster. Intergenic and introns DARs were mapped to their respective genes with the pc-HiC interaction maps. Overlap analysis was carried by GeneOverlap R package. P-values and Jaccard values (color) from Fisher’s exact test are presented on the heatmap (left). Percentage of overlap was calculated from all identified DEGs in the clusters (right).
(c) Representative image of chromatin and transcriptional changes of the Gabrb3 locus from the Dw-late cluster. While early state interactions were between promoter and enhancers with transcriptional activators (Ap1), late state interaction were with transcriptional repressors (Slug). Upper IGV genome browser tracks (purple - Basal, light green - Activated -early, dark green - Activated -late and orange - Reactivated) presenting transcriptional changes (ncRNA-seq), middle tracks shows chromatin accessibility dynamics (ATAC-seq) on promoter (red rectangle) and enhancers (gray rectangle). Significant promoter-enhancer interaction are represented as arcs (WashU browser tracks). Lower track present motifs that were identified via HOMER tools (Slug, Ap1 and Rest).
(d) Aggregation plots for individual motifs. The enrichment values (motifs per bp/ per peak) of six selected motifs (two repressors, two activators and two bivalent) was assessed around the center of peaks (−/+ 4000bp) from each cluster.
Extended Data Fig. 8: Proposed model of the chromatin accessibility, promoter-enhancer interaction and transcriptional dynamics of hippocampal memory engram neurons.

Over the course of memory formation and recall. Basal state - gene promoters interact with enhancers that carry transcriptional repressor cargo and express low levels of mRNA. Early phase – leads to a priming event, in which enhancers that harbor transcriptional activator cargo become more accessible, but most of them remain isolated and lack interactions with respective gene promoters. Late phase - gene promoters shift their interaction to the primed regions, which harbor transcriptional activator motifs. This promoter-enhancer reprograming results in increased gene expression that presumably allows the stabilization of the memory. Recall - reactivated engram neurons utilized a subset of primed promoter-enhancer interactions, which is associated with transcriptional changes involved in mRNA transport to synaptic compartments and protein translation. Transcription factor – TF, E(1–3) – different enhancer that interact with the same promoter, Red - transcriptional repressors, Blue - transcriptional activators.
Supplementary Material
Acknowledgments
We thank E. Niederst, J. Penney, S. Barker, R.T. Stott, M. Victor, A. Watson, N. Dedic, E. Lockshin and the members of L.H.T. Lab for helpful discussion and suggestions. We thank lab manager Y. Zhou, E. McNamara for mice colony maintenance. We thank P. Autissier (Whitehead Institute) for help with FACS. Funding: This works was supported by NIH grants RF1AG062377, AF1AG054012, RO1NS102730, RF1AG064321, The JPB Foundation, The Alana Down Syndrome Research Foundation, The LuMind Down Syndrome Research Foundation, the Cure Alzheimer’s Fund CIRCUITS consortium and The Robert A and Renee E. Belfer Family Foundation to L-H.T. This work was also supported in part by NIH grants R01AG058002, U01NS110453, R01AG062335, UG3NS115064 to M.K. and L-H.T and R01AG067151, R01MH109978, U01MH119509, R01HG008155, U24HG009446 to M.K. V.D is supported by AARF-19-618751 grant from Alzheimer’s Association. H.S.M is supported by Burroughs Wellcome Fund and UNCF-Merck postdoctoral fellowship. C.A is supported by the JPB Foundation. R.M.R is supported by NIH T32 grant 5T32HD09806. Hi-C libraries preparation kit was received as a generous gift from DovetailTM (v.1.03, Dovetail Genomics, Chicago, USA). We thank Dovetail team for helpful discussion and suggestions.
Footnotes
Competing interests:
Authors declare no competing interests.
References
- 1.Alberini CM Transcription Factors in Long-Term Memory and Synaptic Plasticity. Physiol. Rev 89, 1–46 (2014). [DOI] [PMC free article] [PubMed] [Google Scholar]
- 2.Josselyn SA, Köhler S & Frankland PW Finding the engram. Nat. Rev. Neurosci 16, 521–534 (2015). [DOI] [PubMed] [Google Scholar]
- 3.Albo Z & Gräff J Engram Excitement. Neuron 101, 198–200 (2019). [DOI] [PubMed] [Google Scholar]
- 4.Poo M. ming et al. What is memory? The present state of the engram. BMC Biol (2016). doi: 10.1186/s12915-016-0261-6 [DOI] [PMC free article] [PubMed] [Google Scholar]
- 5.Guenthner CJ, Miyamichi K, Yang HH, Heller HC & Luo L Permanent genetic access to transiently active neurons via TRAP: Targeted recombination in active populations. Neuron 78, 773–784 (2013). [DOI] [PMC free article] [PubMed] [Google Scholar]
- 6.Denny CA et al. Hippocampal memory traces are differentially modulated by experience, time, and adult neurogenesis. Neuron 83, 189–201 (2014). [DOI] [PMC free article] [PubMed] [Google Scholar]
- 7.Ramirez S et al. Creating a False Memory in the Hippocampus. Science (80-.). 341, 819–824 (2013). [DOI] [PubMed] [Google Scholar]
- 8.Khalaf O et al. Reactivation of recall-induced neurons contributes to remote fear memory attenuation. Science (80-.). 1242, 1239–1242 (2018). [DOI] [PubMed] [Google Scholar]
- 9.Levenson JM & Sweatt JD Epigenetic mechanisms in memory formation. Nat. Rev. Neurosci 6, 108–118 (2005). [DOI] [PubMed] [Google Scholar]
- 10.Gräff J et al. Epigenetic priming of memory updating during reconsolidation to attenuate remote fear memories. Cell 156, 261–276 (2014). [DOI] [PMC free article] [PubMed] [Google Scholar]
- 11.Nguyen TA et al. High-throughput functional comparison of promoter and enhancer activities. Genome Res 26, 1023–1033 (2016). [DOI] [PMC free article] [PubMed] [Google Scholar]
- 12.Malik AN et al. Genome-wide identification and characterization of functional neuronal activity-dependent enhancers. Nat Neurosci 17, 1330–1339 (2015). [DOI] [PMC free article] [PubMed] [Google Scholar]
- 13.Su Y et al. Neuronal activity modifies the chromatin accessibility landscape in the adult brain. Nat. Neurosci 20, 476–483 (2017). [DOI] [PMC free article] [PubMed] [Google Scholar]
- 14.Rajarajan P, Gil SE, Brennand KJ & Akbarian S Spatial genome organization and cognition. Nat. Rev. Neurosci 17, 681–691 (2016). [DOI] [PMC free article] [PubMed] [Google Scholar]
- 15.Lieberman-Aiden E et al. Comprehensive mapping of long-range interactions reveals folding principles of the human genome. Science (80-.). (2009). doi: 10.1126/science.1181369 [DOI] [PMC free article] [PubMed] [Google Scholar]
- 16.Dekker J et al. The 4D nucleome project. Nature (2017). doi: 10.1038/nature23884 [DOI] [PMC free article] [PubMed] [Google Scholar]
- 17.Yu M & Ren B The Three-Dimensional Organization of Mammalian Genomes. Annu. Rev. Cell Dev. Biol (2017). doi: 10.1146/annurev-cellbio-100616-060531 [DOI] [PMC free article] [PubMed] [Google Scholar]
- 18.Shlyueva D, Stampfel G & Stark A Transcriptional enhancers: From properties to genome-wide predictions. Nat. Rev. Genet 15, 272–286 (2014). [DOI] [PubMed] [Google Scholar]
- 19.Nader K, Schafe GE & Le Doux JE Fear memories require protein synthesis in the amygdala for reconsolidation after retrieval. Nature (2000). doi: 10.1038/35021052 [DOI] [PubMed] [Google Scholar]
- 20.Rao-Ruiz P et al. Engram-specific transcriptome profiling of contextual memory consolidation. Nat. Commun (2019). doi: 10.1038/s41467-019-09960-x [DOI] [PMC free article] [PubMed] [Google Scholar]
- 21.Halder R et al. DNA methylation changes in plasticity genes accompany the formation and maintenance of memory. Nat. Neurosci. 19, 102–110 (2015). [DOI] [PubMed] [Google Scholar]
- 22.Park CS, Rehrauer H & Mansuy IM Genome-wide analysis of H4K5 acetylation associated with fear memory in mice. BMC Genomics (2013). doi: 10.1186/1471-2164-14-539 [DOI] [PMC free article] [PubMed] [Google Scholar]
- 23.Kim T et al. Widespread transcription at neuronal activity-regulated enhancers. Nature 465, 182–187 (2010). [DOI] [PMC free article] [PubMed] [Google Scholar]
- 24.Vierbuchen T et al. AP-1 Transcription Factors and the BAF Complex Mediate Signal-Dependent Enhancer Selection. Mol. Cell 68, 1134–1146.e6 (2017). [DOI] [PMC free article] [PubMed] [Google Scholar]
- 25.Weintraub AS et al. YY1 Is a Structural Regulator of Enhancer-Promoter Loops. Cell 171, 1573–1588.e28 (2017). [DOI] [PMC free article] [PubMed] [Google Scholar]
- 26.Bonev B et al. Multiscale 3D Genome Rewiring during Mouse Neural Development. Cell 171, 557–572.e24 (2017). [DOI] [PMC free article] [PubMed] [Google Scholar]
- 27.Fernandez-Albert J et al. Immediate and deferred epigenomic signatures of in vivo neuronal activation in mouse hippocampus. Nat. Neurosci (2019). doi: 10.1038/s41593-019-0476-2 [DOI] [PMC free article] [PubMed] [Google Scholar]
- 28.Yamada T et al. Sensory experience remodels genome architecture in neural circuit to drive motor learning. Nature (2019). doi: 10.1038/s41586-019-1190-7 [DOI] [PMC free article] [PubMed] [Google Scholar]
- 29.Schoenfelder S et al. The pluripotent regulatory circuitry connecting promoters to their long-range interacting elements. Genome Res. 25, 582–597 (2015). [DOI] [PMC free article] [PubMed] [Google Scholar]
- 30.Sanyal A, Lajoie BR, Jain G & Dekker J The long-range interaction landscape of gene promoters. Nature (2012). doi: 10.1038/nature11279 [DOI] [PMC free article] [PubMed] [Google Scholar]
- 31.Joo JY, Schaukowitch K, Farbiak L, Kilaru G & Kim TK Stimulus-specific combinatorial functionality of neuronal c-fos enhancers. Nat. Neurosci (2015). doi: 10.1038/nn.4170 [DOI] [PMC free article] [PubMed] [Google Scholar]
- 32.Jaeger BN et al. A novel environment-evoked transcriptional signature predicts reactivity in single dentate granule neurons. Nat. Commun (2018). doi: 10.1038/s41467-018-05418-8 [DOI] [PMC free article] [PubMed] [Google Scholar]
- 33.Tyssowski KM et al. Different Neuronal Activity Patterns Induce Different Gene Expression Programs. Neuron (2018). doi: 10.1016/j.neuron.2018.04.001 [DOI] [PMC free article] [PubMed] [Google Scholar]
- 34.Gaidatzis D, Burger L, Florescu M & Stadler MB Analysis of intronic and exonic reads in RNA-seq data characterizes transcriptional and post-transcriptional regulation. Nat. Biotechnol (2015). doi: 10.1038/nbt.3269 [DOI] [PubMed] [Google Scholar]
- 35.Chandra D et al. GABAA receptor 4 subunits mediate extrasynaptic inhibition in thalamus and dentate gyrus and the action of gaboxadol. Proc. Natl. Acad. Sci (2006). doi: 10.1073/pnas.0604304103 [DOI] [PMC free article] [PubMed] [Google Scholar]
- 36.Pignatelli M et al. Engram Cell Excitability State Determines the Efficacy of Memory Retrieval. Neuron 101, 274–284.e5 (2019). [DOI] [PubMed] [Google Scholar]
- 37.Sun X et al. Functionally Distinct Neuronal Ensembles within the Memory Engram. Cell (2020). doi: 10.1016/j.cell.2020.02.055 [DOI] [PMC free article] [PubMed] [Google Scholar]
- 38.Yuan A & Nixon RA Specialized roles of neurofilament proteins in synapses: Relevance to neuropsychiatric disorders. Brain Research Bulletin (2016). doi: 10.1016/j.brainresbull.2016.09.002 [DOI] [PMC free article] [PubMed] [Google Scholar]
- 39.Bramham CR & Wells DG Dendritic mRNA: Transport, translation and function. Nat. Rev. Neurosci 8, 776–789 (2007). [DOI] [PubMed] [Google Scholar]
- 40.Choi JH et al. Interregional synaptic maps among engram cells underlie memory formation. Science (80-.). (2018). doi: 10.1126/science.aas9204 [DOI] [PubMed] [Google Scholar]
- 41.Shi SH et al. Rapid spine delivery and redistribution of AMPA receptors after synaptic NMDA receptor activation. Science (80-.). (1999). doi: 10.1126/science.284.5421.1811 [DOI] [PubMed] [Google Scholar]
- 42.Ostroff LE, Fiala JC, Allwardt B & Harris KM Polyribosomes redistribute from dendritic shafts into spines with enlarged synapses during LTP in developing rat hippocampal slices. Neuron (2002). doi: 10.1016/S0896-6273(02)00785-7 [DOI] [PubMed] [Google Scholar]
- 43.Chung SH et al. Zac1 plays a key role in the development of specific neuronal subsets in the mouse cerebellum. Neural Dev (2011). doi: 10.1186/1749-8104-6-25 [DOI] [PMC free article] [PubMed] [Google Scholar]
- 44.Ravasi T et al. An Atlas of Combinatorial Transcriptional Regulation in Mouse and Man. Cell (2010). doi: 10.1016/j.cell.2010.01.044 [DOI] [PMC free article] [PubMed] [Google Scholar]
- 45.Schlisio S, Halperin T, Vidal M & Nevins JR Interaction of YY1 with E2Fs, mediated by RYBP, provides a mechanism for specificity of E2F function. EMBO J 21, 5775–5786 (2002). [DOI] [PMC free article] [PubMed] [Google Scholar]
- 46.Korb E, Wilkinson CL, Delgado RN, Lovero KL & Finkbeiner S Arc in the nucleus regulates PML-dependent GluA1 transcription and homeostatic plasticity. Nat. Neurosci (2013). doi: 10.1038/nn.3429 [DOI] [PMC free article] [PubMed] [Google Scholar]
- 47.Prickett AR et al. Genome-wide and parental allele-specific analysis of CTCF and cohesin DNA binding in mouse brain reveals a tissue-specific binding pattern and an association with imprinted differentially methylated regions. Genome Res 23, 1624–1635 (2013). [DOI] [PMC free article] [PubMed] [Google Scholar]
- 48.Kinde B, Wu DY, Greenberg ME & Gabel HW DNA methylation in the gene body influences MeCP2-mediated gene repression. Proc. Natl. Acad. Sci 113, 15114–15119 (2016). [DOI] [PMC free article] [PubMed] [Google Scholar]
- 49.Buenrostro JD, Giresi PG, Zaba LC, Chang HY & Greenleaf WJ Transposition of native chromatin for fast and sensitive epigenomic profiling of open chromatin, DNA-binding proteins and nucleosome position. Nat. Methods 10, 1213–1218 (2013). [DOI] [PMC free article] [PubMed] [Google Scholar]
- 50.Langmead B & Salzberg SL Fast gapped-read alignment with Bowtie 2. Nat. Methods (2012). doi: 10.1038/nmeth.1923 [DOI] [PMC free article] [PubMed] [Google Scholar]
- 51.Li H et al. The Sequence Alignment/Map format and SAMtools. Bioinformatics (2009). doi: 10.1093/bioinformatics/btp352 [DOI] [PMC free article] [PubMed] [Google Scholar]
- 52.Zhang Y et al. Model-based analysis of ChIP-Seq (MACS). Genome Biol (2008). doi: 10.1186/gb-2008-9-9-r137 [DOI] [PMC free article] [PubMed] [Google Scholar]
- 53.Stark R & Brown G DiffBind : differential binding analysis of ChIP-Seq peak data. Cancer Res (2011). doi: 10.1093/nar/gkv1191 [DOI] [Google Scholar]
- 54.Robinson MD & Oshlack A A scaling normalization method for differential expression analysis of RNA-seq data. Genome Biol (2010). doi: 10.1186/gb-2010-11-3-r25 [DOI] [PMC free article] [PubMed] [Google Scholar]
- 55.Thorvaldsdóttir H, Robinson JT & Mesirov JP Integrative Genomics Viewer (IGV): High-performance genomics data visualization and exploration. Brief. Bioinform (2013). doi: 10.1093/bib/bbs017 [DOI] [PMC free article] [PubMed] [Google Scholar]
- 56.Ernst J & Kellis M Chromatin-state discovery and genome annotation with ChromHMM. Nat. Protoc 12, 2478–2492 (2017). [DOI] [PMC free article] [PubMed] [Google Scholar]
- 57.Benner C, Heinz S & Glass CK HOMER - Software for motif discovery and next generation sequencing analysis. Http://Homer.Ucsd.Edu/ (2017). [Google Scholar]
- 58.Schep AN et al. Structured nucleosome fingerprints enable high-resolution mapping of chromatin architecture within regulatory regions. Genome Res (2015). doi: 10.1101/gr.192294.115 [DOI] [PMC free article] [PubMed] [Google Scholar]
- 59.Heinz S et al. Simple combinations of lineage-determining transcription factors prime cis-regulatory elements required for macrophage and B cell identities. Mol. Cell (2010). doi: 10.1016/j.molcel.2010.05.004 [DOI] [PMC free article] [PubMed] [Google Scholar]
- 60.Trapnell C et al. Differential gene and transcript expression analysis of RNA-seq experiments with TopHat and Cufflinks. Nat. Protoc (2012). doi: 10.1038/nprot.2012.016 [DOI] [PMC free article] [PubMed] [Google Scholar]
- 61.Robinson MD, McCarthy DJ & Smyth GK edgeR: A Bioconductor package for differential expression analysis of digital gene expression data. Bioinformatics (2009). doi: 10.1093/bioinformatics/btp616 [DOI] [PMC free article] [PubMed] [Google Scholar]
- 62.Nagano T et al. Single-cell Hi-C for genome-wide detection of chromatin interactions that occur simultaneously in a single cell. Nat. Protoc 10, 1986–2003 (2015). [DOI] [PubMed] [Google Scholar]
- 63.Wingett SW et al. HiCUP: pipeline for mapping and processing Hi-C data. F1000Research (2015). doi: 10.12688/f1000research.7334.1 [DOI] [PMC free article] [PubMed] [Google Scholar]
- 64.Cairns J et al. CHiCAGO: Robust detection of DNA looping interactions in Capture Hi-C data. Genome Biol 17, 1–17 (2016). [DOI] [PMC free article] [PubMed] [Google Scholar]
- 65.Kagey MH et al. Mediator and cohesin connect gene expression and chromatin architecture. Nature (2010). doi: 10.1038/nature09380 [DOI] [PMC free article] [PubMed] [Google Scholar]
Associated Data
This section collects any data citations, data availability statements, or supplementary materials included in this article.
Supplementary Materials
Data Availability Statement
Supplementary Tables 1–11 provide direct access to the main results derived from the transcriptome and epigenome assays presented in this study. In addition, raw and processed datasets generated during the study are available in the GEO repository using the accession number GSE152956. Any other data that support the findings of this study are available from the corresponding author upon request