Abstract
Virtual reality technology can intuitively provide patients of neuropsychological diseases with an almost real environment for cognitive rehabilitation training . In this paper, virtual reality technology is used to construct specific scenes that are universal and related to MCI patients to restore and train patients’ scene memory cognitive ability to help patients strengthen or gradually restore scene memory cognitive ability. The construction of virtual reality scenes with different contents such as life, environment, transportation and tourism, real-time detection is carried out in combination with EEG signals of patients in different scenes. The experimental results of the analysis of EEG signals of patients shows that memory rehabilitation training is strengthened by using specific stimulation scenes.
Keywords: MCI, Rehabilitation training, VR, EEG
Introduction
At present, VR has been proposed to treat some neuropsychological diseases, such as anxiety and fear. Virtual reality technology can intuitively provide patients with an almost real environment, so that patients can be placed in the middle, and get better treatment effect. In this regard, we have carried out some research before [1–4].At the same time, VR can also be used in surgical training, providing a recyclable and ecologically efficient way for physicians to gain more training experience. VR can also be used for other medical purposes such as post-stroke intervention and treatment.
Carlos et al. Proposed a novel P300 Brain-Computer Interface (BCI) paradigm based on VR technology [5] , which uses soc7izial clues to guide the focus of attention and combines VR technology with the characteristics of P300 signals into a training tool, which can be used to train social attention disorders. Alexander optimizes the current BCI [6, 7]; Ioannis et al. Proposed a computer intervention based on virtual reality, which can be used for cognitive stimulation and can evaluate the condition of cognitive diseases such as MCI [8]. Dong Wen et al. Proposed a research on evaluation and rehabilitation of cognitive impairment at different stages based on virtual reality and EEG [9]. Yang and Tan et al. Pointed out that although some achievements have been made in VR-based EAR for MCI and AD patients, VR-based EAR for SCD patients has not yet begun. SCD patients are preclinical states of MCI and AD, and the evaluation of SCD patients is mainly limited to cerebrospinal fluid and EEG methods [10, 11]. Innes proposed that SCD rehabilitation is limited to meditation, music therapy [12], and mindfulness training [13] proposed by Smart et al. A lot of work has been done on the research of cognitive algorithms using computers [14–20]. These studies have achieved remarkable results. However, some subjects in these studies cannot complete the experiment. The sample size of these studies is quite small, and their follow-up period is very short. For EAR of SCD, MCI and AD patients, cognitive training should be combined with full immersion VR environment to attract patients and achieve the effect of rehabilitation training. In addition, Anguera and de Tommaso proposed that brain activity of patients can be measured during training [21] to objectively and quantitatively evaluate the progress of rehabilitation, thus encouraging patients to continue the rehabilitation process. EAR of PDCIP (Patients With Differential Cognitive Impairment Phases) can be performed using VR, while EEG signals of patients can be collected to evaluate the rehabilitation effect.
Through literature analysis and clinical investigation, although the current cognitive rehabilitation training has made considerable research progress, there are still obvious shortcomings in some aspects. On the one hand, due to differences in environment, educational background, living habits, and the degree of disease development, each MCI patient has differences in areas of cognitive impairment. The current computer-based cognitive rehabilitation training system mainly uses chess and card games, digital Games, etc., did not perform functional segmentation and targeted cognitive function rehabilitation training for specific cognitive domains. On the other hand, cognitive rehabilitation training using virtual reality technology has shown good rehabilitation training effects and clinical application prospects, but there is still no better solution to how to monitor the effect of cognitive rehabilitation training of patients on specific scenes. In addition, there is a lack of recording feedback on the patient’s rehabilitation training process, the training content cannot be adjusted in real time, and the personalized rehabilitation treatment cannot be performed according to the patient’s cognitive domain damage.
In response to the above problems, this article uses VR and EEG technology to carry out cognitive rehabilitation training for MCI patients. In this paper, virtual reality scenes with different contents such as life, environment, transportation and tourism are constructed, and EEG signals of patients in different scenes are combined for real-time detection. Through analysis of EEG signals of patients, memory rehabilitation training is strengthened by using specific stimulation scenes.
Method
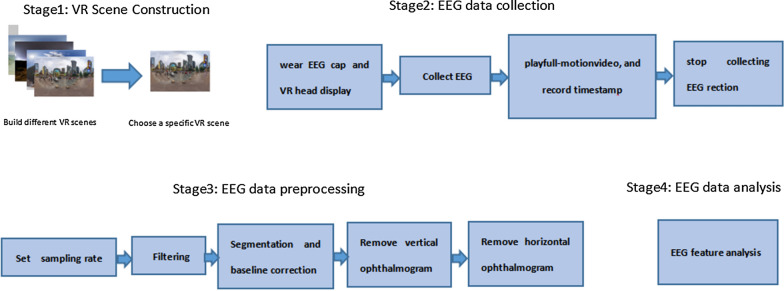
The research method described in this article is mainly divided into four stages, including VR scene construction, EEG data acquisition, EEG signal preprocessing, and EEG feature analysis. The specific process is shown in Fig. 1.
Fig. 1.
Frame diagram of VR-EEG scene cognitive rehabilitation training
VR scene construction
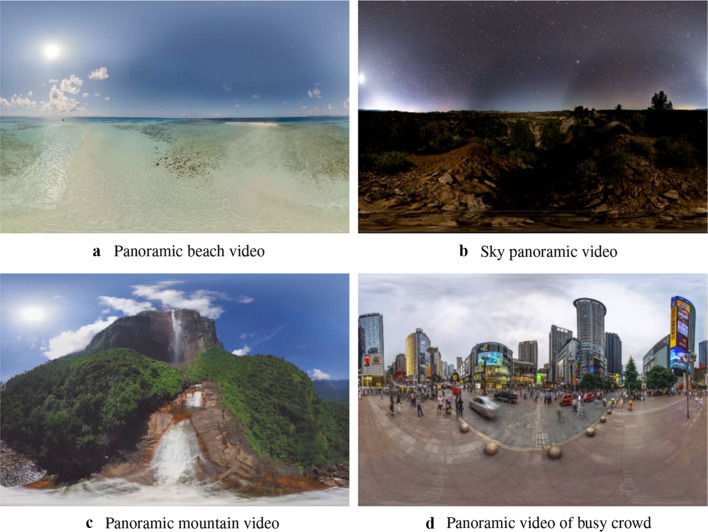
In this paper, virtual reality scenes with five different contents such as life, environment, transportation and tourism are constructed. In order to ensure that the stimulation time of each video is the same and the total duration is not easy to be too long, combined with the patient’s physical condition, the duration of each full-motion video is strictly set to 15 seconds, the number of videos played at one time is 10, and some full-motion video contents are shown in Fig. 2.
Fig. 2.
Partial panoramic video screenshot
The flow of EEG acquisition method is as follows:
(1) First, wear EEG cap and VR head display for patients; (2) Collect EEG first, then play full-motion video, and record timestamp when full-motion video plays; (3) Quit automatically after full-motion video plays, and then stop collecting EEG; (4) According to the playback and stop time of full-motion video, intercept the corresponding EEG fragments to complete EEG acquisition.
EEG preprcessed
The EEG data collected by the EEG acquisition device is in. Cdt format, and the original collected EEG is shown in Fig. 3. Since the EEG acquisition time is strictly consistent with the full-motion video playback time during the experiment, the acquisition is processed by default. In order to remove the interference signals in EEG and make the analysis results more accurate, EEG preprocessing is required.
Fig. 3.
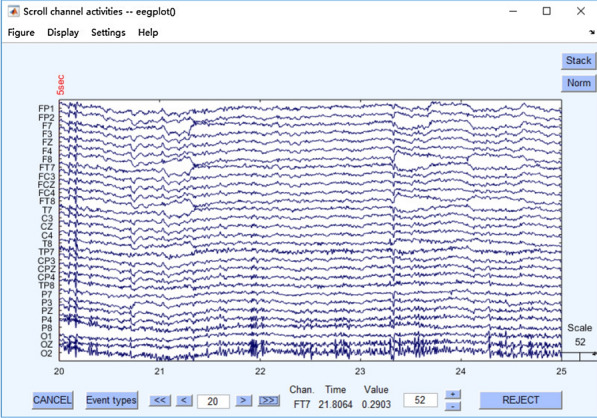
Preprocessed EEG
Firstly, the sampling rate is set to 500 Hz in order to compress the data amount. The sampling rate of 500 Hz has reached the experimental accuracy requirements. Selecting reference electrodes A1, A2; After that, filtering is carried out, which is divided into high-pass filtering and low-pass filtering. High-pass filtering means that high-frequency signals can pass normally, while low-frequency signals below the set threshold are blocked and weakened. Low-pass filtering refers to the normal passage of low-frequency signals, while high-frequency signals exceeding the set threshold are blocked and weakened. Generally speaking, if time-frequency analysis is to be done in the later period, the filtering range can be selected to be wider, 0.1–100. If only traditional ERP analysis is carried out, about 1–30 can be selected.
In addition, if filtering is performed at 0.1–100 Hz, depression filtering at 50 Hz can be performed to eliminate interference. As shown in Fig. 4, filtering is performed and 50 Hz sag filtering is removed.
Fig. 4.
Filter and remove the 50 Hz notch filter
The following steps are segmentation and baseline correction, either before or after the electrooculography is removed. In fact, it is best to remove the electrooculography, because continuous data is better when running ICA, but the amount of data is relatively large and the running speed is relatively slow. However, if there is noise and body movement in the experimental design, resulting in more artifacts and messy data, it can be segmented first, but it can be segmented as long as possible. The ICA step is carried out, which is mainly to remove artifacts. It takes about 300–400 steps to run ICA, and the time will be increased according to the segmentation situation and the processing speed of the computer. The 30 independent components obtained after ICA are shown in Fig.5.
Fig. 5.
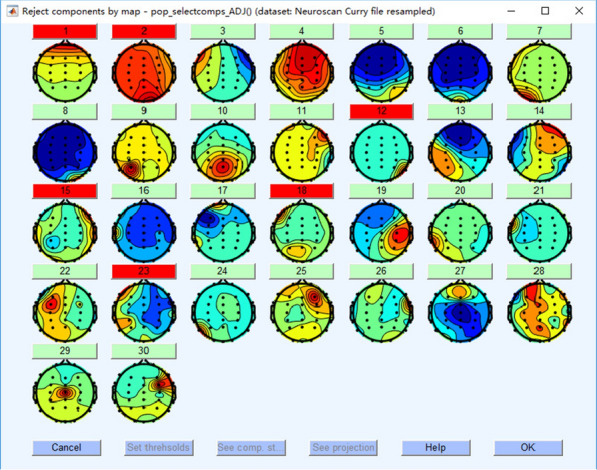
30 independent components obtained after ICA
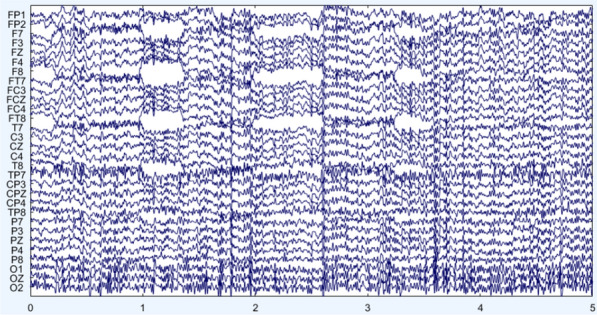
Then the vertical ophthalmogram is removed, and the effect after treatment is shown in Fig.6.
Fig. 6.
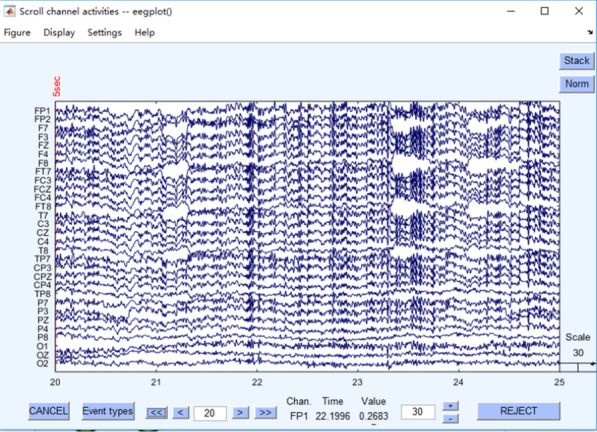
Remove EEG after vertical eye electricity
After the vertical ophthalmogram is removed, the horizontal ophthalmogram is then removed. The effect after treatment is shown in Fig.7. The preprocessed EEG data is saved in. Mat format for subsequent EEG feature extraction.
Fig. 7.
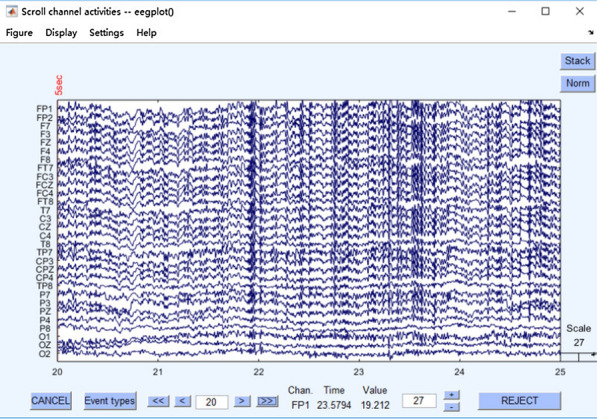
Removal of EEG after horizontal eye electricity
EEG analysis algorithm
Based on the characteristics of EEG signals, this paper analyzes whether there are significant changes in EEG signal patterns synchronously recorded under the stimulation of different VR scenes. The EEG signal features used include power spectral density (PSD) and differential entropy (DE). The original feature distribution and statistical variables such as mean and variance are used for feature significance analysis.
Research on PSD Algorithm Signals are usually expressed in the form of waves, such as sound waves, electromagnetic waves, etc. When the functional spectral density of the wave is multiplied by an appropriate coefficient, the power carried by the wave per unit frequency will be obtained. The PSD of the signal exists only if and only if the signal is a generalized stationary process. The spectral density of f (t) and the autocorrelation of f (t) form a Fourier transform pair, and Fourier transform is usually used for PSD estimation.
One of the results of Fourier analysis is Parseval theorem, which shows that the sum of squares of functions is equal to the sum of squares of its Fourier transformations.
| 1 |
where X(f)=F.T.x(t) is the continuous Fourier transform of x (t) and f is the frequency component of x.
EEG characteristics are mainly the amplitude, frequency, variance, mean and other statistical characteristics of electrical signals. These methods generally have poor effect on EEG signals with low signal-to-noise ratio, so time domain features cannot be used as the final classification features alone. The basic method of frequency domain feature analysis is to convert sequential EEG signals into frequency domain through Fourier transform. Among them, power spectral density is a commonly used frequency domain feature.
Power spectral density reflects the relationship between power and frequency of EEG signals and can be used to observe the changes of signals in various frequency bands. It is known that the autocorrelation function of the discrete random signal x (n) is r (k). According to the discrete Fourier transform, the power density of the signal can be calculated by the following formula:
| 2 |
here , E denotes the mathematical expectation of the signal, * is a complex conjugate.
Research on DE Algorithm: Differential entropy is a new characteristic of EEG signals. It is defined as follows:
| 3 |
where the timing signal is represented by X, f(x) is the probability density function of X. Because in the specific frequency band after band-pass filtering, the signal basically meets Gaussian probability distribution.
To calculate the differential entropy, only the variance of the sequence needs to be known. In order to simplify the calculation of variance, we can use another method to calculate the differential entropy. For a discrete signal sequence x(n), its Short-time Fourier Transform (STFT) is represented as:
| 4 |
where is the window function, is the Fourier transform of , is the angular frequency, k=0,1...N − 1 ,N is the total number of sampling points.
Experimental results and discussion
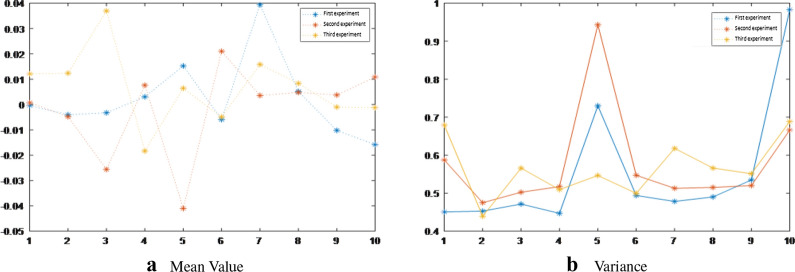
In this paper, the EEG signals collected in a single experiment are divided into a single sample by a sliding window with a window length of 2s and an overlapping length of 1s. 58 samples under a single stimulus segment were obtained (when the number of samples under a single stimulus segment exceeded 58, only the first 58 samples were taken to ensure that the number of samples corresponding to each stimulus segment was consistent), and finally 580 samples under a single experiment were obtained. After obtaining the sample data, this paper further uses PSD estimation and DE to extract features, and compares the original feature distribution, and analyzes the feature significance through statistical variables such as the mean and variance of features.
Characteristic analysis of PSD
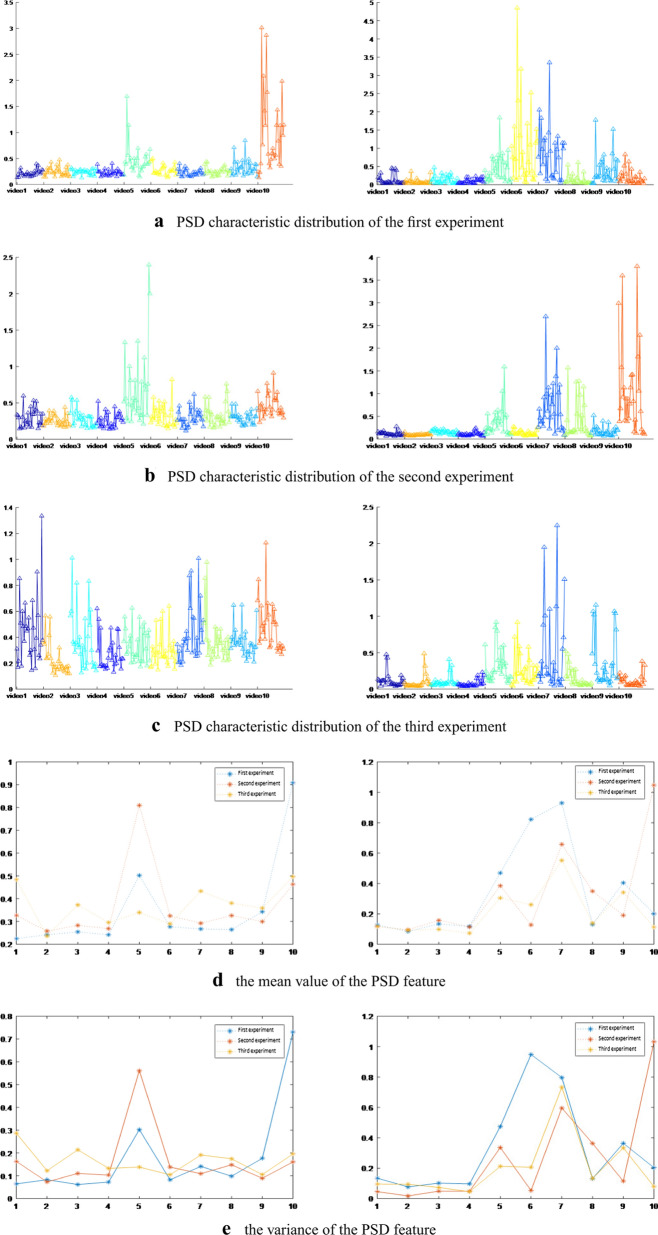
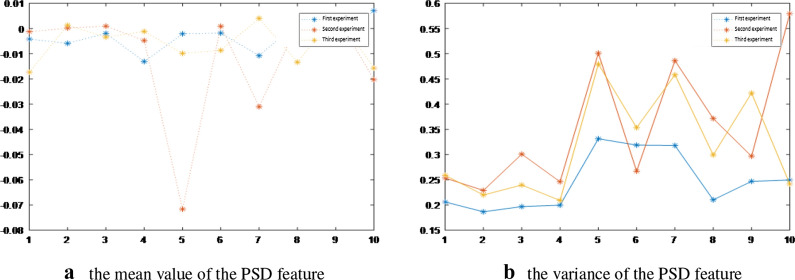
The first subject: The change trend of mean and variance of PSD characteristics under the three experiments is basically the same. Under three experiments, the experimental results are shown in the left column of Fig. 8. The average value of the corresponding PSD features reaches the maximum value. According to the classification strategy mentioned above, the two videos belong to the same category of stimulus materials. That is to say, subject 1 has a larger physiological response to such video stimulation materials, while the response to fragments 2, 3, 4 and 6 is weaker. In the third experiment, the mean and variance of PSD features corresponding to segment 5 are not as obvious as those in the first and second experiments, and their responses to videos 1, 7 and 10 are relatively significant.
Fig. 8.
PSD feature analysis chart.The left column is the results of subject 1, and the right column is the result of subject 2
The second subject: Under three experiments, the experimental results are shown in the right column of Fig.8. The mean and variance distribution of PSD characteristics of Subject 2. Based on the data of the three experiments, it can be preliminarily determined that there may be problems in the original EEG signals of the first experiment to the stimulus segment 6 and the second experiment to the stimulus segment 10. As can be seen from the figure, the physiological response of subject 2 to fragments 1, 2, 3, 4 and 8 is not very significant, but the response to fragments 5, 7 and 9 is relatively significant. This result is basically the same as that of subject 1, but there are certain differences, that is, different subjects have different sensitivity to stimulation materials. Therefore, we need to carry out experiments for each subject to find stimulation materials that can cause significant changes in physiological signals of each subject.
Characteristic analysis of DE
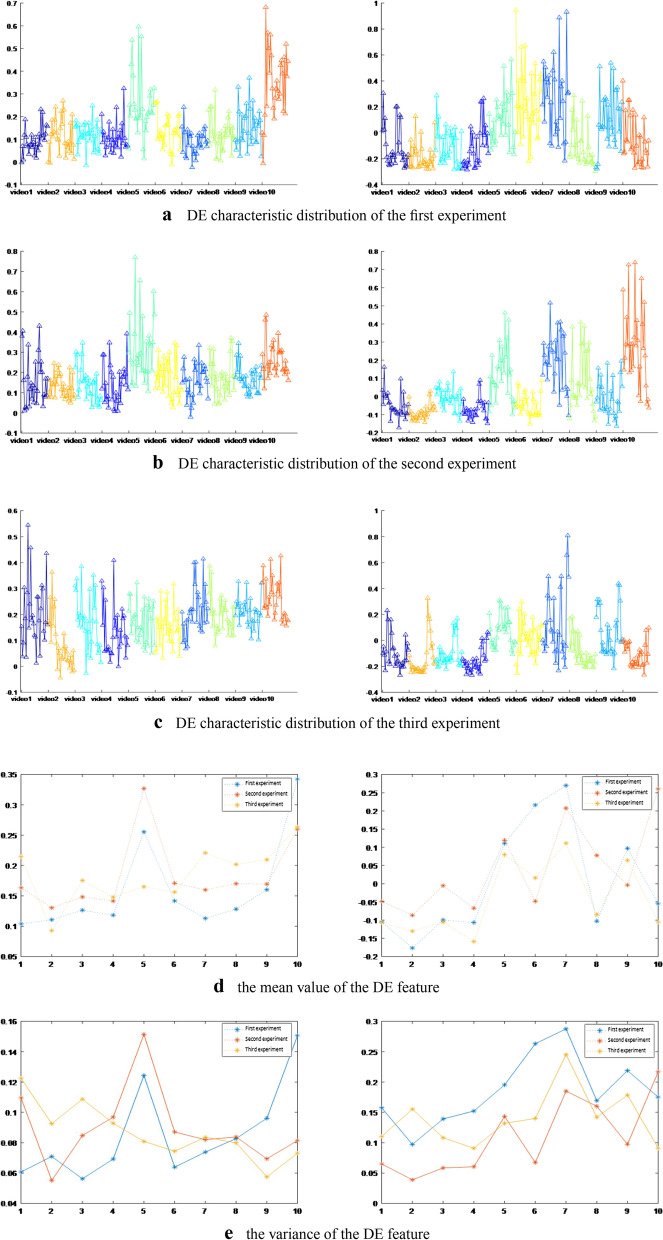
The first subject: Similar to PSD characteristics, under three experiments, the experimental results are shown in the left column of Fig.9. The mean value of DE features corresponding to stimulus fragments 10, 5 and 10 respectively reached the maximum, while the response to fragments 2, 3, 4 and 6 was weak.
Fig. 9.
DE feature analysis chart.The left column is the results of subject 1, and the right column is the result of subject 2
The second subject: the same PSD characteristics, the experimental results are shown in the right column of Fig.9. The subjects were not very sensitive to fragments 1, 2, 3, 4 and 8, and the responses to fragments 5, 7 and 9 were significant.
DE characteristic distribution of the third experiment
The experimental results of subject 1 are shown in Fig.10. The standard deviation of the first and second experiments of the subject one under stimulus fragments 5 and 10 is large, which is consistent with the previous conclusion, but the standard deviation of the third experiment does not have this phenomenon. In addition, there is no special rule for the mean distribution of the three experiments.
Fig. 10.
The mean and variance of direct feature analysis of subject 1
The experimental results of subject 2 are shown in Fig.11. From the standard deviation distribution, it can be found that subjects 2 responded well to fragments 5, 6 and 7 in the first experiment, and responded well to fragments 5, 7, 10 and 5, 7 and 9 in the second and third experiments respectively. The reaction to fragments 2 and 4 was poor under three experiments.
Fig. 11.
The mean and variance of direct feature analysis of subject 2
Conclusion
In this paper, the key algorithms of EEG analysis in VR-EEG scene cognitive training module are studied and implemented. The experimental results show that PSD and DE feature analysis are obviously better than direct feature analysis. At the same time, each type of scene in VR full-motion video has different EEG stimulation to human beings. The research results of this paper provide a new idea and method for scene-based memory rehabilitation training.The combination of VR and EEG technology described in this article provides cognitive rehabilitation training for MCI patients, which can effectively prevent the development of mild cognitive impairment to deeper cognitive impairment, as well as prevent various types of senile dementia. This provides new and more effective technical means for non-drug treatment, which can reduce the burden on medical staff and reduce the burden on families and society.
Acknowledgements
The authors would like to thank the editor and reviewers for their valuable advices that have helped to improve the paper quality. This work is supported by the Fundamental Research Funds for the Central Universities(N181602014, N182508027), National Key Research and Development Program of China(2018YFC1314501), National Natural Science Foundation of China (61971118).
Compliance with ethical standards
Conflict of interest
The authors declare that they have no conflict of interest.
Footnotes
The error in reference 21 has been corrected.
Publisher's Note
Springer Nature remains neutral with regard to jurisdictional claims in published maps and institutional affiliations.
Change history
1/21/2021
A Correction to this paper has been published: 10.1007/s13755-020-00137-1
References
- 1.Yao L, Tan W, Chen C, Liu C, Yang J, Zhang Y. A review of the application of virtual reality technology in the diagnosis and treatment of cognitive impairment. Front Aging Neurosci. 2019;11:280. doi: 10.3389/fnagi.2019.00280. [DOI] [PMC free article] [PubMed] [Google Scholar]
- 2.Tan W, Yuan Y, Chen A, Mao L, Ke Y, Lv X. An approach for pulmonary vascular extraction from chest CT images. J Healthcare Eng. 2019 doi: 10.1155/2019/9712970. [DOI] [PMC free article] [PubMed] [Google Scholar]
- 3.Tan W, Kang Y, Dong Z, Chen C, Yin X, Ying S, Zhang Y, Zhang L, Lisheng X. An approach to extraction midsagittal plane of skull from brain CT images for oral and maxillofacial surgery. IEEE Access. 2019;7:118203–118217. doi: 10.1109/ACCESS.2019.2920862. [DOI] [Google Scholar]
- 4.Tan W, Ge W, Hang Y, Simeng W, Liu S, Liu M. Computer assisted system for precise lung surgery based on medical image computing and mixed reality. Health Inf Sci Syst. 2018;12:6–10. doi: 10.1007/s13755-018-0053-1. [DOI] [PMC free article] [PubMed] [Google Scholar]
- 5.Carlos PA, Susana M. A novel brain computer interface for classification of social joint attention in autism and comparison of 3 experimental setups: a feasibility study[J] J Neurosci Methods. 2017;290:105–115. doi: 10.1016/j.jneumeth.2017.07.029. [DOI] [PubMed] [Google Scholar]
- 6.Alexander L, Rupert O, Christoph G. Feedback strategies for BCI based stroke rehabilitation: evaluation of different approaches. Repair Restore Relieve. 2014;166:114–120. [Google Scholar]
- 7.Ioannis T, Apostolos T, Magda T. Assessing virtual reality environments as cognitive stimulation method for patients with MCI. Technol Incl Well-Being. 2014;536:39–74. doi: 10.1007/978-3-642-45432-5_4. [DOI] [Google Scholar]
- 8.Dong W, Xifa L, Yanhong Z, et al. The study of evaluation and rehabilitation of patients with different cognitive impairment phases based on virtual reality and EEG. Front Aging Neurosci. 2018;10:110–112. doi: 10.3389/fnagi.2018.00110. [DOI] [PMC free article] [PubMed] [Google Scholar]
- 9.Sun Y, Yang F, Lin C, et al. Biochemical and neuroimaging studies in subjective cognitive decline: progress and perspectives. CNS Neurosci Ther. 2015;21(10):768–775. doi: 10.1111/cns.12395. [DOI] [PMC free article] [PubMed] [Google Scholar]
- 10.Zhou Y, Tan C, Wen D, et al. The biomarkers for identifying preclinical Alzheimer’s disease via structural and functional magnetic resonance imaging. Front Aging Neurosci. 2016;8:92. doi: 10.3389/fnagi.2016.00092. [DOI] [PMC free article] [PubMed] [Google Scholar]
- 11.Innes KE, Selfe TK, Khalsa DS, et al. Meditation and music improve memory and cognitive function in adults with subjective cognitive decline: a pilot randomized controlled trial[J] J Alzheimer’s Dis. 2017;56(3):899–916. doi: 10.3233/JAD-160867. [DOI] [PMC free article] [PubMed] [Google Scholar]
- 12.Smart CM, Segalowitz SJ, Koudys J, et al. Mindfulness training for older adults with subjective cognitive decline: results from a pilot randomized controlled trial. J Alzheimer’s Dis. 2016;52(2):757–774. doi: 10.3233/JAD-150992. [DOI] [PubMed] [Google Scholar]
- 13.Anguera JA, Boccanfuso J, Rintoul JL, et al. Video game training enhances cognitive control in older adults. Nature. 2013;501(7465):97–101. doi: 10.1038/nature12486. [DOI] [PMC free article] [PubMed] [Google Scholar]
- 14.Wang ZJ, Zhan ZH, Lin Y, et al. Automatic niching differential evolution with contour prediction approach for multimodal optimization problems. IEEE Trans Evol Comput. 2020;24:114–28. doi: 10.1109/TEVC.2019.2910721. [DOI] [Google Scholar]
- 15.Zhang YH, Gong YJ, Gao Y, et al. Parameter-free voronoi neighborhood for evolutionary multimodal optimization. IEEE Trans Evol Comput. 2019;24(99):335–349. doi: 10.1109/TSC.2019.2899283. [DOI] [Google Scholar]
- 16.Peng M, Xie Q, Wang H, et al. Bayesian sparse topical coding. IEEE Trans Knowl Data Eng. 2019;31(6):1080–1093. doi: 10.1109/TKDE.2018.2847707. [DOI] [Google Scholar]
- 17.Peng M, Zeng G, Sun Z, et al. Personalized app recommendation based on app permissions. World Wide Web Internet Web Inf Syst. 2017;21(8):1–16. [Google Scholar]
- 18.Li H, Wang Y, Wang H, Zhou B. Multi-window based ensemble learning for classification of imbalanced streaming data. World Wide Web. 2017;20(6):1507. doi: 10.1007/s11280-017-0449-x. [DOI] [Google Scholar]
- 19.Yao W , He J , Wang H , et al. Collaborative topic ranking: leveraging item meta-data for sparsity reduction. In: Twenty-ninth Aaai Conference on Artificial Intelligence. AAAI Press, (2015).
- 20.Peng M, Zhu J, Wang H, et al. Mining event-oriented topics in microblog stream with unsupervised multi-view hierarchical embedding. ACM Trans Knowl Discov Data. 2018;12(3):1–26. doi: 10.1145/3173044. [DOI] [Google Scholar]
- 21.Tommaso M, Ricci K, Delussi M, et al. Testing a novel method for improving wayfinding by means of a P3b Virtual Reality Visual Paradigm in normal aging. SpringerPlus. 2016;5:1297. doi: 10.1186/s40064-016-2978-7. [DOI] [PMC free article] [PubMed] [Google Scholar]


