Abstract
Background
Helicobacter pylori (Hp) infection is the strongest risk factor for gastric cancer (GC). However, the mechanisms of Hp-associated GC remain to be explored.
Methods
The gene expression profiling (GSE111762) data were downloaded from the GEO database. Differentially expressed genes (DEGs) between normal samples (NO) and Hp-atrophic gastritis (GA) or Hp-GA and Hp-GC were identified by GEO2R. Gene Ontology and pathway enrichment analysis were performed using the DAVID database. lncRNA-TF-mRNA and ceRNA regulation networks were constructed using Cytoscape. The cross-networks were obtained by overlapping molecules of the above two networks. GSE27411 and GSE116312 datasets were employed for validation.
Results
DEGs between NO and Hp-GA are linked to the activity of inward rectifying potassium channels, digestion, etc. DEGs between Hp-GA and Hp-GC were associated with digestion, positive regulation of cell proliferation, etc. According to the lncRNA-TF-mRNA network, 63 lncRNAs, 12 TFs, and 209 mRNAs were involved in Hp-GA while 16 lncRNAs, 11 TFs, and 92 mRNAs were contained in the Hp-GC network. In terms of the ceRNA network, 120 mRNAs, 18 miRNAs, and 27 lncRNAs were shown in Hp-GA while 72 mRNAs, 8 miRNAs, and 1 lncRNA were included in the Hp-GC network. In the cross-network, we found that immune regulation and differentiation regulation were important in the process of NO-GA. Neuroendocrine regulation was mainly related to the process of GA-GC. In the end, we verified that CDX2 plays an important role in the pathological process of NO to Hp-GA. Comparing Hp-GA with Hp-GC, DEGs (FPR1, TFF2, GAST, SST, FUT9, and SHH), TF, and GATA5 were of great significance.
Conclusions
We identified the DEGs, and their lncRNA regulatory network of Hp-associated diseases might provide insights into the mechanism between Hp infection and GC. Furthermore, in-depth studies of the molecules might be useful to explore the multistep process of gastric diseases.
1. Introduction
The current study assumed that the Helicobacter pylori (Hp) infection was closely associated with gastric cancer (GC). Nonatrophic gastritis, atrophic gastritis (GA), intestinal metaplasia (IM), and dysplasia were included in the pathological process which led to the GC ultimately [1, 2]. In the process above, the risk of Hp-positive GA patients to develop GC is 6.4-11.8 times as high as the noninfected ones [3]. Therefore, searching for the GA and GC molecular markers associated with Hp infection is of great significance to the early diagnosis and reversal of GC.
After setting on the epithelium and glands of the gastric mucosa, Hp arouses inflammation through a variety of adhesives and virulence factors, leading to the changes of signaling pathways in the host [4]. Also, Hp infection increases oxidative stress by inducing apoptosis and then disrupts cellular integrity and produces inflammation-related tumors [5]. However, the previous studies on the mechanism of Hp infection-related gastric diseases were limited to a single molecule or a signal pathway. Gene expression and the multistage pathological process of Hp-related gastric diseases were not displayed enough formerly. Thus, to reveal the development of gastric diseases, a systematic understanding of Hp-related gastric precancerous diseases and gene expression alternations in GC is in urgent need.
Regulation of gene expression includes transcription level and posttranscriptional levels. Transcription factor (TF) is the main regulator in the transcriptional level, which can bind to the DNA region of the enhancers, or promoters adjacent to the target gene [6, 7]. Noncoding RNAs (ncRNAs) are proven to be important epigenetic regulators in the posttranscriptional level [8, 9]. MicroRNA (miRNA) belongs to small ncRNAs, inducing gene degradation or inhibiting translation by binding to mRNA. lncRNAs are endogenous cellular RNA transcripts longer than 200 nucleotides in length [10], becoming cancer essential regulators with tissue-specific patterns and cell-specific patterns [10–13]. Abnormally expressed miRNAs and lncRNAs have been regarded as promising diagnostic and prognostic biomarkers, existing not only in GC but also in other tumors [14, 15]. lncRNAs can inhibit miRNA in the cytoplasm as a competitive endogenous RNA (ceRNA). lncRNAs can regulate the activity of TF in the nucleus as well [16]. Studies have reported that the differentially expressed lncRNAs, identified in Hp-infected tissue of GC, could be involved in the development of Hp-related gastric diseases [17]. However, the research on Hp-related transcription and noncoding regulation is still in its infancy.
As the availability of multilevel expression data, the integration of large datasets such as Gene Expression Omnibus (GEO) offers new opportunities for the public to comprehensively understand the cancer development [18–20]. The research, therefore, is intended to construct mRNA-lncRNA regulatory networks among normal, GA, and GC with Hp infection. Our study may provide insights into the mechanism between Hp infection and GC.
2. Materials and Methods
2.1. Data Acquisition of Differentially Expressed Genes (DEGs)
GSE111762, an lncRNA/mRNA analysis set, downloaded from the GEO database, included three normal human gastric mucosal tissues (NO), six Hp-positive GA patients (Hp-GA), and six Hp-positive GC patients (Hp-GC). GEO2R (http://www.ncbi.nlm.nih.gov/geo/geo2r/) [21] was used to screen DEGs between NO and Hp-GA or Hp-GA and Hp-GC, respectively. The falsediscoveryrates(FDR) < 0.05 and ∣logFC | >2 were considered statistically significant.
Human lncRNA and protein-coding gene annotations were directly downloaded from GENECODE v22. All of the categories in the “long non-coding RNA gene annotation” GTF file were considered to be lncRNAs. Duplicate probes were removed.
2.2. GO and KEGG Pathway Enrichment Analysis
Gene Ontology (GO) analysis is the primary bioinformatics tool to unify the characterization of genes and gene products [22]. GO contains three categories of terms, including cellular component, molecular function, and biological process. KEGG is a set of databases containing information about genomes, biological pathways, diseases, and chemicals [23]. DAVID (https://david.ncifcrf.gov/) is a bioinformatics data resource with an integrative bioinformation database and analysis tools and benefits to discover the biological meaning behind genes [24]. DEGs were enriched and analyzed by DAVID for GO and KEGG pathways, respectively. P < 0.05 was considered statistically significant.
2.3. Construction of the lncRNA-TF-mRNA Regulatory Network
The correlation coefficient and significance thresholds were set at 0.95 and 0.001 in the comparison between NO and Hp-GA while 0.85 and 0.001 were set between Hp-GA and Hp-GC. The protein-protein interaction (PPI) network was constructed using the STRING online database [25]. TFs were annotated using the TF checkpoint [26]. The regulatory relationships among mRNAs, TFs, and lncRNAs were visualized using the Cytoscape software (version 3.4.0). The CentiScaPe app was used to analyze the computing network's topological property [27]. lncRNAs, TFs, and mRNAs were ranked to obtain the key genes based on the degree size.
2.4. Construction of the ceRNA Regulatory Network
miRWalk is a database to predict miRNA target genes [28]. It integrates miRDB, miRTarbase, and TargetScans. Considering the inverse correlations, miRWalk was applied to observe the interaction between miRNAs and mRNAs. The overlapping miRNAs were further analyzed. DIANA is a database that predicts the association between miRNAs and lncRNAs. miRNA-targeted lncRNAs were similarly predicted via DIANA. Furthermore, the predicted lncRNAs were intersected with the lncRNAs with different expression in the GSE111762 dataset. Besides, the Cytoscape software took advantage of building the ceRNA network. The number of each interaction was calculated to identify key genes in the network as well.
2.5. Construction of the Cross-Network
The overlapping genes of the above lncRNA-TF-mRNA network and ceRNA network were synthesized. Meanwhile, a crossover network was constructed using the Cytoscape software.
2.6. GEO Dataset Analysis for the Validation
The GSE27411 dataset included six Hp-negative normal gastric tissue samples and six Hp-positive GA samples. Three Hp-positive GA samples and three Hp-positive GC samples were included in the GSE116312 dataset. In this study, the GSE27411 dataset was used to analyze the selected DEGs and TFs between NO and Hp-GA. Besides, we selected the GSE116312 dataset to analyze the key DEGs and TFs screened by the results above. The entire workflow is shown in Figure 1.
Figure 1.
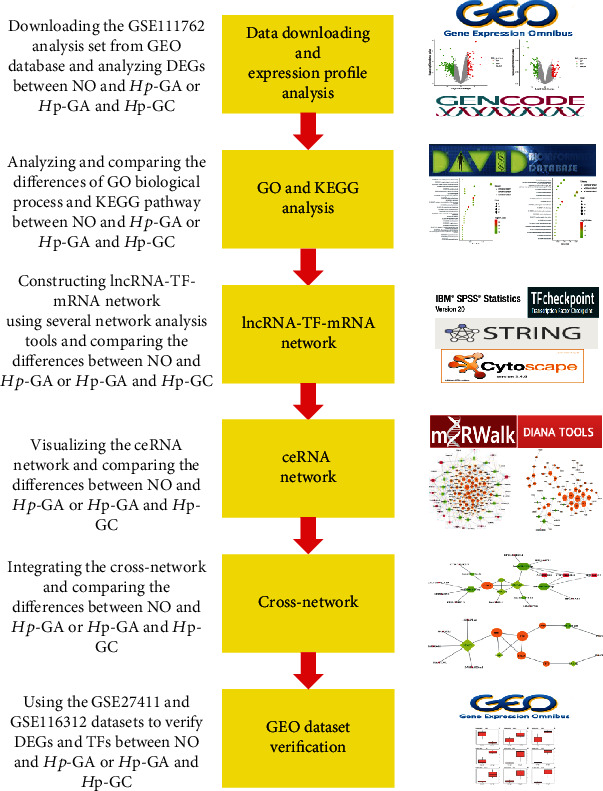
General workflow of the DEG screening and network construction.
2.7. Statistical Analyses
Coexpression relationships between the lncRNAs and mRNAs were estimated by Spearman's correlation test. FDR was also calculated to correct the P value for multiple testing. Unless otherwise stated, statistical significance was considered P < 0.05.
3. Results
3.1. Screening of Hp-GA- and Hp-GC-Related DEGs
3.1.1. Screening of Hp-GA-Related DEGs
A total of 389 DEGs were obtained between NO and Hp-GA, which showed 88 upexpressed and 301 downexpressed genes in GA (Figure 2(a)). By removing 18 duplicate probes, 81 upexpressed and 290 downexpressed genes were finally left (Table S1). Among them, there were 7 highly expressed lncRNAs, 67 downexpressed lncRNAs, 74 high-level mRNAs, and 223 low-level mRNAs. The top 5 of DEG names are shown in Tables 1(a) and 2(a), respectively.
Figure 2.
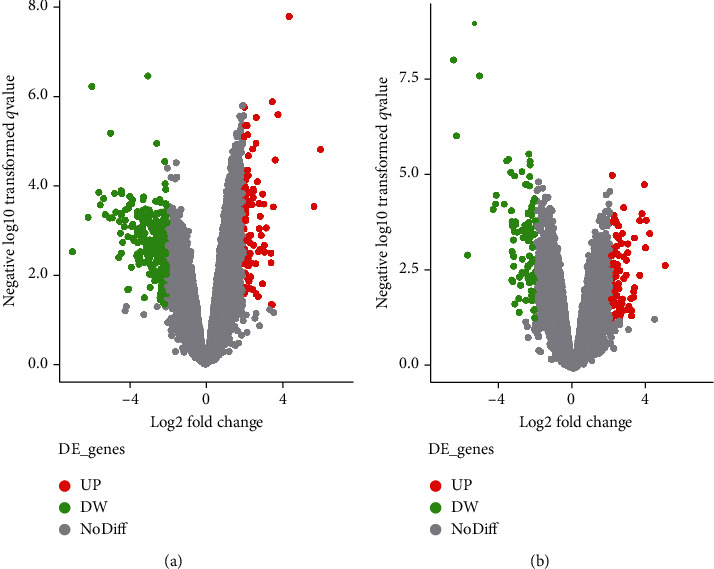
Volcano plot of the DEGs in the gene expression dataset GSE111762. (a) Red color is indicative of upregulated genes and green color of downregulated genes in normal vs. Hp-GA. (b) Red color is indicative of upregulated genes and green color of downregulated genes in Hp-GA vs. Hp-GC. Gray color indicates genes that are not differentially expressed in a statistically significant manner (the cutoff values of FDR < 0.05 and ∣logFC | >2).
3.1.2. Screening of Hp-GC-Related DEGs
In the comparison between Hp-GA and Hp-GC, a total of 187 DEGs showed 88 upexpressed genes and 99 downexpressed genes in GC (Figure 2(b)). By removing 14 duplicate probes, 84 highly expressed genes and 89 low-expression genes were finally left (Table S2). Among them, there were 11 high-level lncRNAs, 9 low-level lncRNAs, 73 high-level mRNAs, and 80 low-level mRNAs. The top 5 of DEG names are shown in Tables 1(b) and 2(b), respectively.
3.2. Enrichment Analysis of GO and KEGG Pathways of DEGs
3.2.1. Functional Enrichment Analysis of Hp-GA-Related DEGs
As shown in Figure 3(a), Hp-GA-related DEGs were mainly correlated with the activity of inward rectifying potassium channels, positive regulation of cell proliferation, cell mitosis, digestion, etc. By using KEGG tools, DEGs were mainly enriched in gastric acid secretion and cancer pathways (Table 3(a)).
Figure 3.
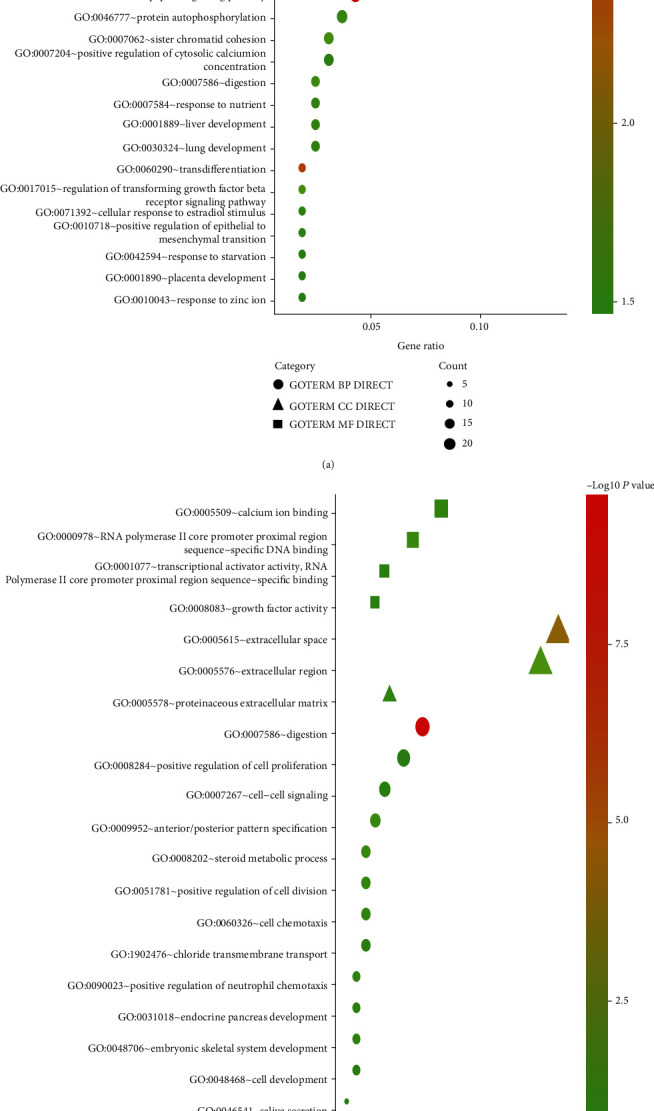
Bubble plot for GO enrichment of DEGs in (a) normal vs. Hp-GA and (b) Hp-GA vs. Hp-GC. The gene ratio is assigned to the x-axis and the description of pathway to the y-axis. The area of the displayed graphic is proportional to the number of genes assigned to the term, and the color corresponds to the adjusted P value.
3.2.2. Functional Enrichment Analysis of Hp-GC-Related DEGs
In Figure 3(b), Hp-GC-related DEGs were principally associated with digestion, positive regulation of cell proliferation, positive regulation of cell division, and calcium ion binding. By KEGG analysis, DEGs were prevailingly enriched in salivary secretion, neuroactive ligand-receptor interactions, and gastric acid secretion (Table 3(b)).
3.3. Construction of the lncRNA-TF-mRNA Regulatory Network
3.3.1. lncRNA-TF-mRNA Regulatory Network of Hp-GA-Related DEGs
The lncRNA-TF-mRNA regulatory network of Hp-GA contained 63 lncRNAs, 12 TFs, and 209 mRNAs (Figure 4(a)). After sorting by degree, the core of the network was obtained including the top 5 lncRNAs, the top 3 TFs, and the top 10 mRNAs. They were lincRNA-BCOR-8, lincRNA-MGAT5-3, lincRNA-SLC34A2, lincRNA-DHX35, lincRNA-APOBEC3A, CDX2, ETV2, MYOD1, RXFP4, AKT1, PLCB2, BAALC, SAA3P, AC005062.2, DNALI1, MED18, RP11-570H19.2, and SYNDIG1.
Figure 4.
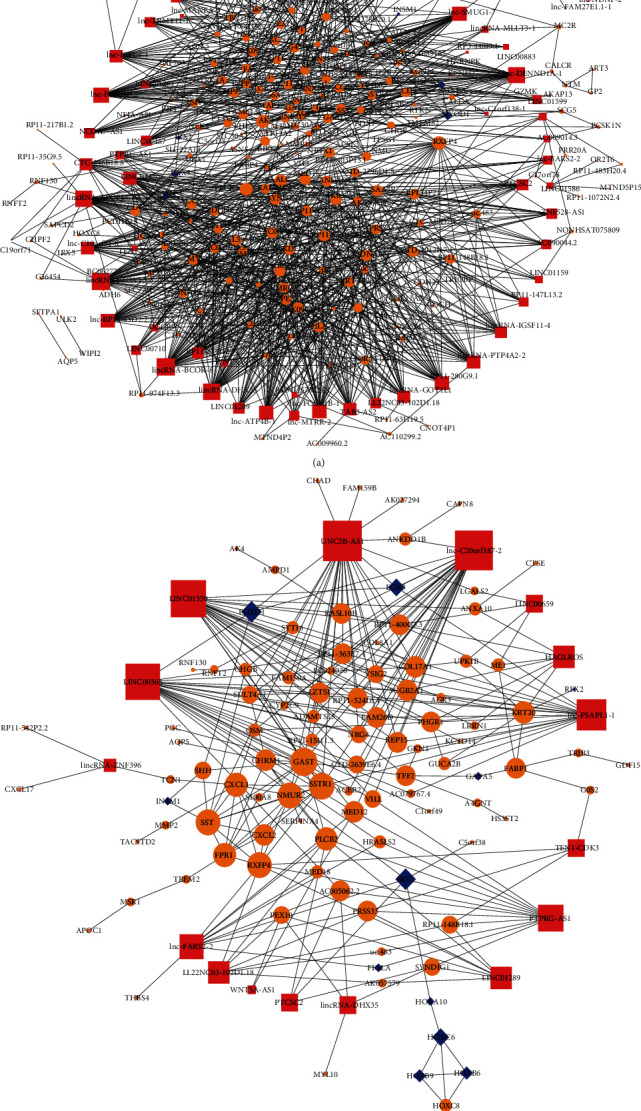
lncRNA-TF-mRNA regulatory networks of (a) Hp-GA and (b) Hp-GC. Pink squares indicate lncRNAs, blue diamonds indicate TFs, orange circles indicate target genes, and size increases with the degree.
3.3.2. lncRNA-TF-mRNA Regulatory Network of Hp-GC-Related DEGs
As shown below, the lncRNA-TF-mRNA regulatory network of GC was built including 16 lncRNAs, 11 TFs, and 92 mRNAs (Figure 4(b)). After sorting by degree, the central network was acquired, making up the top 5 lncRNAs, the top 3 TFs, and the top 10 mRNAs. They were UNC5B-AS1, lnc-C20orf187-2, LINC01559, LINC00365, lnc-PSAPL1-1, IRX2, FOXD1, HOXC6, GAST, SSTR, NMUR2, SST, RXFP4, FPR1, CXCL1, PLCB2, KRT20, and CHRM1.
3.4. Construction of the ceRNA Regulatory Network
3.4.1. ceRNA Regulatory Network of Hp-GA-Related DEGs
After screening and matching in the miRWalk dataset and DIANA-tools, an integrated lncRNA-miRNA-mRNA network of Hp-GA was obtained, including 120 mRNAs, 18 miRNAs, and 27 lncRNAs (Figure 5(a)). By calculating the number of interactions for each RNA, we obtained the top 2 lncRNAs, top 3 miRNAs, and top 10 mRNAs in the network, which were HOXA-AS2, RP11-64C1.1, hsa-miR-497-5p, hsa-miR-665, hsa-miR-145-5p, AKT1, CDK2, SST, CDC20, BIRC5, SMAD3, CCR7, CCNB2, GAST, and CDX2. They were the central lncRNAs, miRNAs, and mRNAs of the network.
Figure 5.
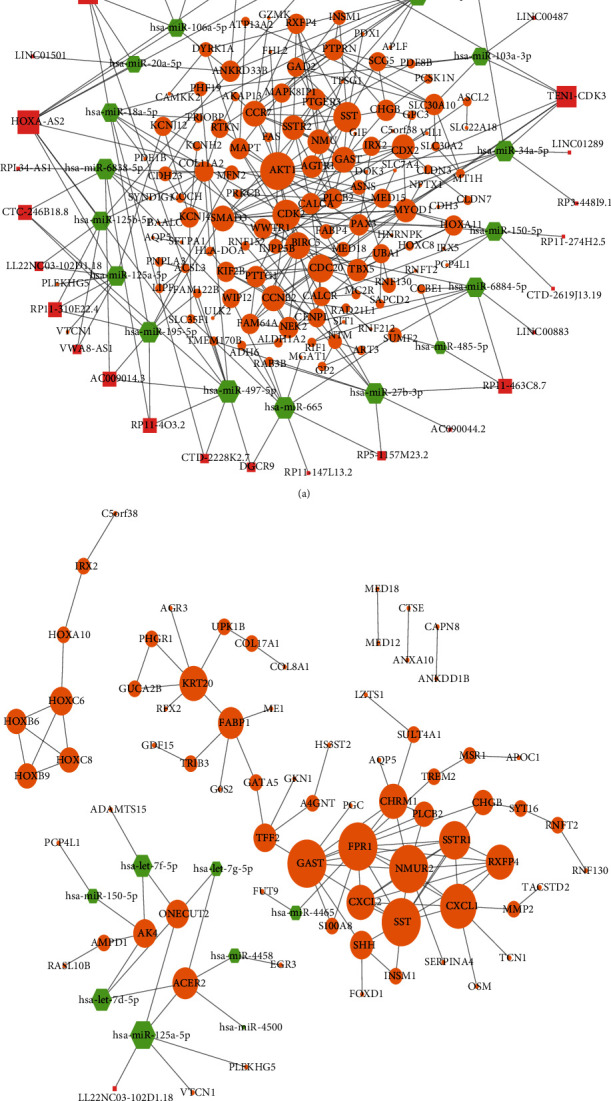
ceRNA regulatory networks of (a) Hp-GA and (b) Hp-GC. Pink squares indicate lncRNAs, green hexagons indicate miRNAs, orange circles indicate target genes, and size increases with the degree.
3.4.2. ceRNA Regulatory Network of Hp-GC-Related DEGs
Using the same method above, the lncRNA-miRNA-mRNA network of Hp-GC including 72 mRNAs, 8 miRNAs, and 1 lncRNA was gained (Figure 5(b)). The top 3 gained miRNAs were hsa-miR-125a-5p, hsa-let-7d-5p, and hsa-let-7f-5p. The top 10 gained mRNAs were FPR1, SST, GAST, NMUR2, CXCL1, SSTR1, CXCL2, CHRM1, RXFP4, and KRT20. LL22NC03-102D1.18 was chosen as the only lncRNA. The above genes were the central molecules of the network.
3.5. Integration of the Cross-Network
3.5.1. Cross-Network of Hp-GA-Related DEGs
Intersecting the above two networks was able to gain a cross-network. 1 DEG, 3 TFs, 12 lncRNAs, and 5 miRNAs were included, which were CDK2, CDX2, SMAD3, MYOD1, RP11-4O3.2, AC009014.3, HOXA-AS2, lnc-GJA1-1, RPL34-AS1, RP11-64C1.1, RP11-310E22.4, CTC-246B18.8, LINC00710, CTD-2228K2.7, CTD-2619J13.19, RP11-274H2.5, hsa-miR-6838-5p, hsa-miR-195-5p, hsa-miR-145-5p, hsa-miR-18a-5p, and hsa-miR-150-5p (Figure 6(a)).
Figure 6.
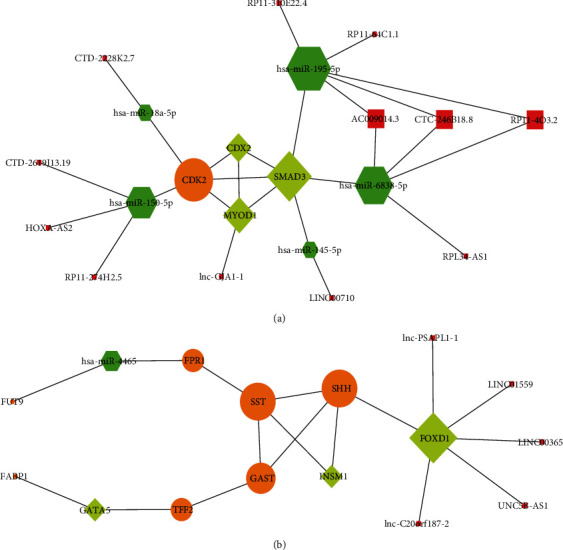
Cross-networks of (a) Hp-GA and (b) Hp-GC. Pink squares indicate lncRNAs, green hexagons indicate miRNAs, yellow diamonds indicate TFs, orange circles indicate target genes, and size increases with the degree.
3.5.2. Cross-Network of Hp-GC-Related DEGs
To obtain a cross-work of Hp-GC-related DEGs, regulatory networks were intersected including 7 DEGs, 3 TFs, 5 lncRNAs, and 1 miRNA. They were FABP1, FPR1, TFF2, GAST, SST, FUT9, SHH, FOXD1, GATA5, INSM1, lnc-C20orf187-2, lnc-PSAPL1-1, UNC5B-AS1, LINC01559, LINC00365, and hsa-miR-4465 (Figure 6(b)). Although no mRNA was found to be coregulated in both lncRNA-TF-mRNA and ceRNA, some regulatory pathways were found to be meaningful.
3.6. Validation of DEGs and TFs
To confirm the analysis results, the GSE27411 dataset was used to verify the above 4 DEGs and TFs related to Hp-GA. In consequence, the differentially expressed CDX2 in NO vs. Hp-GA was statistically significant while the expression trend was consistent with the screening results (Figure 7(a)). However, CDK2, SMAD3, and MYOD1 were not verified in the GSE27411 dataset. Besides, 10 DEGs and TFs related to Hp-GC were confirmed by the GSE116312 dataset. The results revealed that the expression trends of 6 DEGs and GATA5 were the same as in the screening results. FABP1 expressed differences among groups while the trend was the opposite (Figures 7(b)–7(i)). However, FOXD1 and INSM1 were not validated in the GSE116312 dataset.
Figure 7.
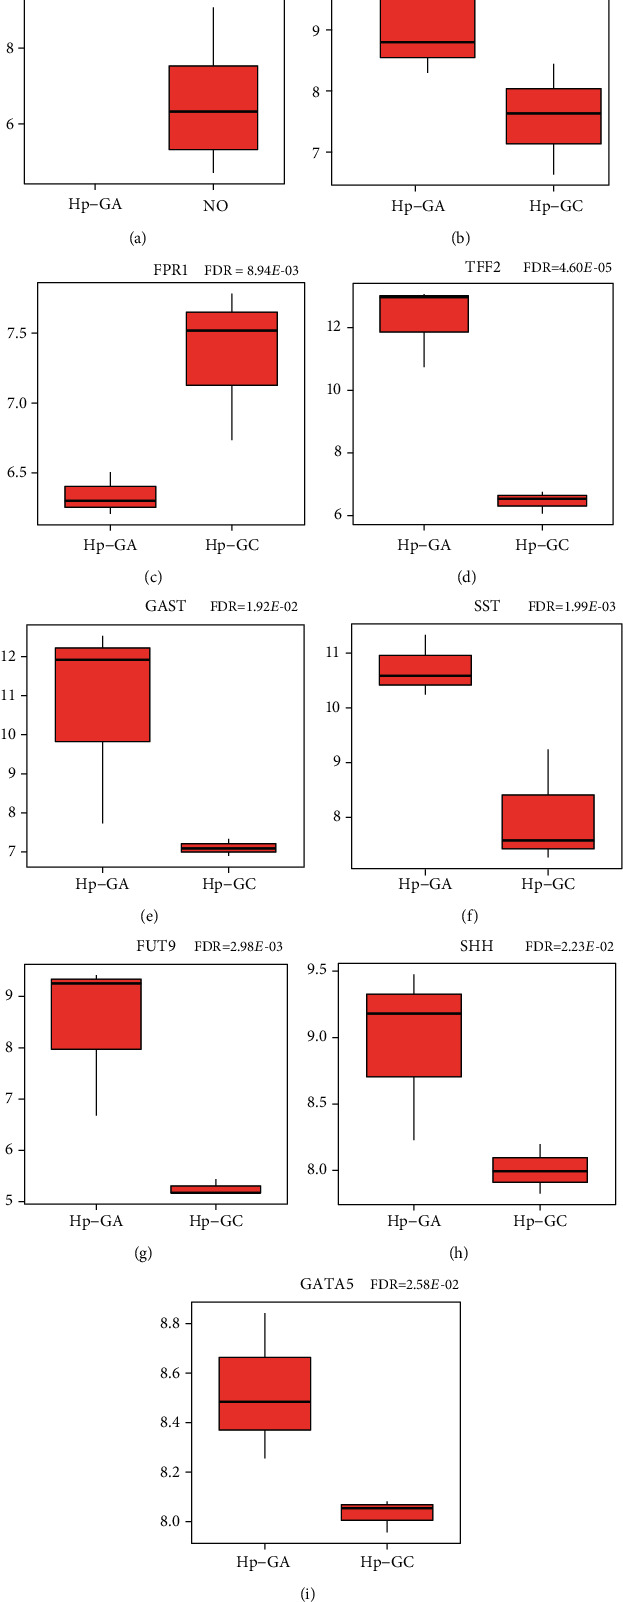
(a) Validation of DEGs and TFs. Validation of DEGs and TFs related to Hp-GA in the GSE27411 dataset. (b–i) Validation of DEGs and TFs related to Hp-GC in the GSE116312 dataset.
4. Discussions
Exploring DEGs with Hp-diseases including GA/GC and their noncoding regulation is of great significance for the early diagnosis and prevention of Hp-related gastric diseases. In this research, we constructed lncRNA-TF-mRNA and ceRNA regulatory networks and furthermore comprehensively analyzed the interaction among the network molecules. Our study will help to clear the molecular basis of Hp-infected gastric diseases as well as to inform the diagnosis and prevention of Hp-infected GC.
Functional analysis of DEGs showed positive regulation of cell proliferation, cell mitosis, and digestion, all related to Hp-GA and Hp-GC. DEGs of Hp-GA were also correlated with inward rectifying potassium channel activity. Besides, calcium ion binding and other functions were linked to Hp-GC. Simultaneously, KEGG enrichment analysis showed that Hp-GA-related DEGs were mainly associated with gastric acid secretion and cancer pathways, while Hp-GC ones were mainly involved in salivary secretion, neuroactive ligand-receptor interactions, and gastric acid secretion. Studies have mentioned that acid secretion had the most significant effect on the development of gastric disorders [29]. Our research displayed that the changes in acid secretion accompanied the process from GA to GC. Thus, the genes involved in this regulation may be closely correlated with the development of gastric diseases.
lncRNAs serve as signals, bait, guide, or scaffold molecules [10]. Among them, by directing TF to the promoter region, lncRNAs play a vital role in gene regulation [30]. Based on this, we constructed lncRNA-TF-mRNA networks. In the Hp-GA network, CDX2 has been reported to be a core TF [31], which played a key role in IM and cancer [32]. ETV2 and MYOD1 were key TFs involved in vascular endothelial differentiation, angiogenesis, and myogenic differentiation of bone marrow mesenchymal progenitor cells [33, 34]. However, those five lncRNAs, including lincRNA-BCOR-8, lincRNA-MGAT5-3, lincRNA-SLC34A2, lincRNA-DHX35, and lincRNA-APOBEC3A, have not been reported yet. In the Hp-GC network, IRX2, FOXD1, and HOXC6 affected the promotion of proliferation and invasion through transcriptional regulation [35–37]. Some reports showed that UNC5B-AS1 promoted thyroid papillary cancer [38]. LINC01559 hindered YAP phosphorylation and accelerated the pancreatic cancer development [39]. LINC00365 was involved in colorectal cancer by mediating the Wnt/β-catenin signaling pathway [40]. There has been no research about lnc-C20orf187-2 and lnc-PSAPL1-1. The relationship between lncRNA and TF found in this study has not been reported. Also, we found that there were two overlapping mRNAs in the Hp-GA and Hp-GC networks named RXFP4 and PLCB2. Studies have reported that RXFP4 was involved in the regulation of human neuroendocrine tumors [41, 42]. Low expression of PLCB2 can change the RAS/Raf/MAPK signaling pathway, reduce cell viability, promote apoptosis, and inhibit tumorigenesis [43]. However, what role has these two molecules played in the process of NO-GA-GC remains poorly understood.
By constructing the ceRNA network, we screened lncRNAs, miRNAs, and mRNAs involved in the gastric diseases. In the Hp-GA network, hsa-miR-497-5p is shown to be lowly expressed in colorectal cancer [15]. It regulated the TGF-β signaling pathway, which can lead to cell cycle arrest by regulating SMAD3 [44]. hsa-miR-665, downregulated in gastric signet-ring cell carcinoma and upregulated in gastric adenocarcinoma, may be associated with the invasion and metastasis in signet-ring cell carcinoma [45]. hsa-miR-145-5p was reduced in Hp-negative GC patients [46] and could downexpress SOX2, a gastric-type differentiation factor [47]. The relationships between the lncRNAs and the above three miRNAs have not been investigated yet. In addition, HOXA-AS2 was demonstrated in promoting cell proliferation, inducing epithelial-mesenchymal transition in hepatocellular carcinoma via the miR-520c-3p/gPC3 axis [48]. RP11-64C1.1 might be valuable for future investigation. Besides, in the Hp-GC-related network, hsa-miR-125a-5p was described to upregulate CCR7 and promote the development of squamous carcinoma in the head or neck [49]. The relationship between hsa-let-7d-5p and tumor has not been specifically reported, while some scholars found it to be closely related to cell senescence [50]. The only lncRNA in the network, LL22NC03-102D1.18, remains to be explored. Also, we found two overlapping mRNAs in two ceRNA networks named SST and GAST. Pieces of research showed the SST affected tumor growth by inhibiting cell proliferation and secretion and inducing apoptosis [51]. It was linked to the invasion and metastasis of the tumor [52]. GAST not only increases the size of gastrointestinal tumors but also inhibits goblet cell differentiation and tumor cell apoptosis [53, 54]. However, how they are regulated by ncRNA was still unknown.
And then, we integrated the lncRNA-TF-mRNA and ceRNA regulatory networks into a cross-network. In the Hp-GA-related cross-network, the core mRNAs were CDK2, CDX2, MYOD1, and SMAD3, regulated by different miRNAs and lncRNAs, respectively. CDK2 is a negative regulator of T cells. TGF-β-SMAD3 can inhibit CDK2 to promote Treg differentiation [55], which indicates that the immune microenvironment may play an essential role in the gastric diseases. CDX2, MYOD1, and SMAD3 have been demonstrated to participate in the transcription of gastric differentiation. The above results showed that the regulatory network composed of immune and differentiation genes, together with miRNA and lncRNA, played a vital role in the development of Hp-GA. An in-depth study of these molecules may reveal the mechanism of Hp-GA. In the Hp-GC-related cross-network, the core molecules were SST, SHH, and GAST, which contacted with the regulation of neuroendocrine hormones. SHH was described to target INSM1 and promote the progress of lung cancer [56]. The SHH signaling pathway is also activated by the FOXD1, an essential role in the development of the disease [57]. According to this, we could find that immune regulation and differentiation were important in the process of NO-GA, while neuroendocrine regulation was mainly related to the process of GA-GC. Therefore, an in-depth exploration of these molecules will enable us to understand the multistep process of gastric diseases. Using GSE27411 and GSE116312 datasets for further validation, we discovered that in differential genes between NO and Hp-GA, CDX2 played an unignorable role. Its function in Hp-GA is worthy of further discussion. In the identification of differential genes between Hp-GA and Hp-GC, FPR1, TFF2, GAST, SST, FUT9, SHH, and GATA5 were assumed significant. Expression differences of FABP1 were shown in the validation datasets while the expression trend above was the opposite. How does FABP1 play in the progression of gastric diseases? It needs to be further studied.
5. Conclusion
In summary, in this study, we screened differentially expressed mRNAs and their long noncoding RNA regulatory network with Hp-associated diseases including GA and GC. We constructed lncRNA-TF-mRNA, ceRNA, and cross-networks involved in these diseases. Our study might deepen the understanding of Hp-related gastric diseases, extend the perception of noncoding regulatory mechanisms, and improve the early diagnosis and prevention of GC.
Table 1.
(a) The five most significantly down- and upregulated lncRNAs in normal vs. Hp-GA
| Gene symbol | Regulation | Log2FC | FDR |
|---|---|---|---|
| lnc-DENND1A-1 | Down | 5.51 | 2.77E-04 |
| lincRNA-SLC34A2 | Down | 4.50 | 6.44E-04 |
| RP11-310E22.4 | Down | 4.45 | 1.19E-03 |
| lincRNA-DHX35 | Down | 4.42 | 1.33E-04 |
| RPL34-AS1 | Down | 4.34 | 1.90E-03 |
| LINC01586 | Up | 2.10 | 1.14E-04 |
| RP11-4O3.2 | Up | 2.19 | 2.22E-04 |
| HOXA-AS2 | Up | 2.23 | 4.32E-03 |
| lnc-C1QTNF8-1 | Up | 2.40 | 5.46E-03 |
| AC009014.3 | Up | 3.54 | 3.07E-04 |
(b) The five most significantly down- and upregulated lncRNAs in Hp-GA vs. Hp-GC
| Gene symbol | Regulation | Log2FC | FDR |
|---|---|---|---|
| UNC5B-AS1 | Down | 3.51 | 3.38E-06 |
| lnc-PSAPL1-1 | Down | 3.17 | 2.06E-02 |
| SOX21-AS1 | Down | 2.77 | 1.37E-03 |
| lnc-C20orf187-2 | Down | 2.53 | 1.51E-05 |
| LINC01133 | Down | 2.45 | 8.52E-05 |
| HAGLROS | Up | 2.35 | 1.24E-02 |
| LINC01289 | Up | 2.38 | 1.92E-03 |
| LL22NC03102D1.18 | Up | 2.43 | 6.03E-03 |
| nc-HOXC10-120 | Up | 2.48 | 3.22E-02 |
| LINC00659 | Up | 2.94 | 9.29E-04 |
Table 2.
(a) The five most significantly down- and upregulated DEGs in normal vs. Hp-GA
| Gene symbol | Regulation | Log2FC | FDR |
|---|---|---|---|
| PGA3 | Down | 7.00 | 3.05E-03 |
| NONHSAT006763 | Down | 6.14 | 5.24E-04 |
| C5orf38 | Down | 5.94 | 6.26E-07 |
| AC005062.2 | Down | 5.58 | 1.45E-04 |
| NM_022658 | Down | 5.33 | 1.99E-04 |
| PDX1 | Up | 3.65 | 2.74E-05 |
| NMU | Up | 3.80 | 2.66E-06 |
| C11orf86 | Up | 4.37 | 1.71E-08 |
| GP2 | Up | 5.68 | 3.00E-04 |
| GAST | Up | 6.02 | 1.60E-05 |
(b) The five most significantly down- and upregulated DEGs in Hp-GA vs. Hp-GC
| Gene symbol | Regulation | Log2FC | FDR |
|---|---|---|---|
| GAST | Down | 6.48 | 8.53E-09 |
| SST | Down | 5.72 | 1.08E-03 |
| SYT16 | Down | 5.08 | 2.22E-08 |
| UPK1B | Down | 4.34 | 6.89E-05 |
| C11orf86 | Down | 4.21 | 4.97E-05 |
| MSR1 | Up | 3.83 | 1.54E-05 |
| C5orf38 | Up | 3.89 | 6.91E-04 |
| FOXD1 | Up | 3.93 | 1.33E-04 |
| NM_022658 | Up | 4.13 | 2.96E-04 |
| S100A8 | Up | 4.96 | 2.01E-03 |
Table 3.
(a) KEGG enrichment analysis for the DEG-related Hp-GA
| ID | Description | Ratio | P value | Count |
|---|---|---|---|---|
| hsa04971 | Gastric acid secretion | 5/105 | 0.66E-02 | 5 |
| hsa04940 | Type I diabetes mellitus | 4/105 | 0.91E-02 | 4 |
| hsa05200 | Pathways in cancer | 10/105 | 1.90E-02 | 10 |
| hsa04725 | Cholinergic synapse | 5/105 | 2.73E-02 | 5 |
| hsa04110 | Cell cycle | 5/105 | 3.87E-02 | 5 |
| hsa05143 | African trypanosomiasis | 3/105 | 4.52E-02 | 3 |
(b) KEGG enrichment analysis for the DEG-related Hp-GC
| ID | Description | Ratio | Pvalue | Count |
|---|---|---|---|---|
| hsa04970 | Salivary secretion | 4/64 | 1.43E-02 | 4 |
| hsa04080 | Neuroactive ligand-receptor interaction | 6/64 | 2.34E-02 | 6 |
| hsa04971 | Gastric acid secretion | 3/64 | 6.99E-02 | 3 |
Acknowledgments
This work was supported by the National Natural Science Foundation of China (Award No. 81970501), the National Key R&D Program of China (Grant No. 2017YFC0908300), and the National Natural Science Foundation of Liaoning Province (2019-MS-388).
Contributor Information
Yuan Yuan, Email: yuanyuan@cmu.edu.cn.
Yuehua Gong, Email: yhgong@cmu.edu.cn.
Data Availability
The microarray data used to support the findings of this study are included within the article.
Conflicts of Interest
The authors declare that there is no conflict of interest regarding the publication of this paper.
Supplementary Materials
Supplementary file 1 contains 371 differentially expressed genes including 81 upregulated and 290 downregulated genes and compares Hp-positive atrophic gastritis with normal gastric mucosal tissues.
Supplementary file 2 contains 173 differentially expressed genes including 84 upregulated and 89 downregulated genes and compares Hp-positive gastric cancer with Hp-positive atrophic gastritis.
References
- 1.Correa P., Houghton J. Carcinogenesis of helicobacter pylori. Gastroenterology. 2007;133(2):659–672. doi: 10.1053/j.gastro.2007.06.026. [DOI] [PubMed] [Google Scholar]
- 2.Mera R. M., Bravo L. E., Camargo M. C., et al. Dynamics of Helicobacter pylori infection as a determinant of progression of gastric precancerous lesions: 16-year follow-up of an eradication trial. Gut. 2018;67(7):1239–1246. doi: 10.1136/gutjnl-2016-311685. [DOI] [PMC free article] [PubMed] [Google Scholar]
- 3.Holleczek B., Schottker B., Brenner H. Helicobacter pylori infection, chronic atrophic gastritis and risk of stomach and esophagus cancer: results from the prospective population-based ESTHER cohort study. International Journal of Cancer. 2020;146(10):2773–2783. doi: 10.1002/ijc.32610. [DOI] [PubMed] [Google Scholar]
- 4.Keilberg D., Ottemann K. M. How Helicobacter pylori senses, targets and interacts with the gastric epithelium. Environmental Microbiology. 2016;18(3):791–806. doi: 10.1111/1462-2920.13222. [DOI] [PubMed] [Google Scholar]
- 5.Gonciarz W., Krupa A., Hinc K., et al. The effect of Helicobacter pylori infection and different H. pylori components on the proliferation and apoptosis of gastric epithelial cells and fibroblasts. PLoS One. 2019;14(8, article e0220636) doi: 10.1371/journal.pone.0220636. [DOI] [PMC free article] [PubMed] [Google Scholar]
- 6.Latchman D. S. Transcription factors: an overview. The International Journal of Biochemistry & Cell Biology. 1997;29(12):1305–1312. doi: 10.1016/S1357-2725(97)00085-X. [DOI] [PubMed] [Google Scholar]
- 7.Libermann T., Zerbini L. Targeting transcription factors for cancer gene therapy. Current Gene Therapy. 2006;6(1):17–33. doi: 10.2174/156652306775515501. [DOI] [PubMed] [Google Scholar]
- 8.MacFarlane L.-A., Murphy P. R. MicroRNA: biogenesis, function and role in cancer. Current Genomics. 2010;11(7):537–561. doi: 10.2174/138920210793175895. [DOI] [PMC free article] [PubMed] [Google Scholar]
- 9.Kung J. T. Y., Colognori D., Lee J. T. Long noncoding RNAs: past, present, and future. Genetics. 2013;193(3):651–669. doi: 10.1534/genetics.112.146704. [DOI] [PMC free article] [PubMed] [Google Scholar]
- 10.Rinn J. L., Chang H. Y. Genome regulation by long noncoding RNAs. Annual Review of Biochemistry. 2012;81(1):145–166. doi: 10.1146/annurev-biochem-051410-092902. [DOI] [PMC free article] [PubMed] [Google Scholar]
- 11.Gibb E. A., Brown C. J., Lam W. L. The functional role of long non-coding RNA in human carcinomas. Molecular Cancer. 2011;10(1):p. 38. doi: 10.1186/1476-4598-10-38. [DOI] [PMC free article] [PubMed] [Google Scholar]
- 12.Gerber L. E., Simpson K. L. [47] Carotenoid cleavage: alternative pathways. Methods in Enzymology. 1990;189:433–436. doi: 10.1016/0076-6879(90)89318-C. [DOI] [PubMed] [Google Scholar]
- 13.Ung M., Schaafsma E., Mattox D., Wang G. L., Cheng C. Pan-cancer systematic identification of lncRNAs associated with cancer prognosis. PeerJ. 2020;8, article e8797 doi: 10.7717/peerj.8797. [DOI] [PMC free article] [PubMed] [Google Scholar]
- 14.Candido S., Lupo G., Pennisi M., et al. The analysis of miRNA expression profiling datasets reveals inverse microRNA patterns in glioblastoma and Alzheimer’s disease. Oncology Reports. 2019;42(3):911–922. doi: 10.3892/or.2019.7215. [DOI] [PMC free article] [PubMed] [Google Scholar]
- 15.Falzone L., Scola L., Zanghì A., et al. Integrated analysis of colorectal cancer microRNA datasets: identification of microRNAs associated with tumor development. Aging. 2018;10(5):1000–1014. doi: 10.18632/aging.101444. [DOI] [PMC free article] [PubMed] [Google Scholar]
- 16.Wang B., Tang D., Zhang Z., Wang Z. Identification of aberrantly expressed lncRNA and the associated TF-mRNA network in hepatocellular carcinoma. Journal of Cellular Biochemistry. 2019;121(2):1491–1503. doi: 10.1002/jcb.29384. [DOI] [PubMed] [Google Scholar]
- 17.Zhou X., Chen H., Zhu L., et al. Helicobacter pylori infection related long noncoding RNA (lncRNA) AF147447 inhibits gastric cancer proliferation and invasion by targeting MUC2 and up-regulating miR-34c. Oncotarget. 2016;7(50):82770–82782. doi: 10.18632/oncotarget.13165. [DOI] [PMC free article] [PubMed] [Google Scholar]
- 18.Kononen J., Bubendorf L., Kallionimeni A., et al. Tissue microarrays for high-throughput molecular profiling of tumor specimens. Nature Medicine. 1998;4(7):844–847. doi: 10.1038/nm0798-844. [DOI] [PubMed] [Google Scholar]
- 19.Arsanious A., Bjarnason G. A., Yousef G. M. From bench to bedside: current and future applications of molecular profiling in renal cell carcinoma. Molecular Cancer. 2009;8(1):p. 20. doi: 10.1186/1476-4598-8-20. [DOI] [PMC free article] [PubMed] [Google Scholar]
- 20.Guo Q., He Y., Sun L., Kong C., Cheng Y., Zhang G. In silico detection of potential prognostic circRNAs through a re-annotation strategy in ovarian cancer. Oncology Letters. 2019;17(4):3677–3686. doi: 10.3892/ol.2019.10021. [DOI] [PMC free article] [PubMed] [Google Scholar]
- 21.Barrett T., Wilhite S. E., Ledoux P., et al. NCBI GEO: archive for functional genomics data sets--update. Nucleic Acids Research. 2013;41(Database issue):D991–D995. doi: 10.1093/nar/gks1193. [DOI] [PMC free article] [PubMed] [Google Scholar]
- 22.Gene Ontology Consortium. The Gene Ontology (GO) project in 2006. Nucleic Acids Research. 2006;34(90001):D322–D326. doi: 10.1093/nar/gkj021. [DOI] [PMC free article] [PubMed] [Google Scholar]
- 23.Kanehisa M., Furumichi M., Tanabe M., Sato Y., Morishima K. KEGG: new perspectives on genomes, pathways, diseases and drugs. Nucleic Acids Research. 2017;45(D1):D353–D361. doi: 10.1093/nar/gkw1092. [DOI] [PMC free article] [PubMed] [Google Scholar]
- 24.Dennis G., Jr., Sherman B. T., Hosack D. A., et al. DAVID: database for annotation, visualization, and integrated discovery. Genome Biology. 2003;4(5) doi: 10.1186/gb-2003-4-5-p3. [DOI] [PubMed] [Google Scholar]
- 25.von Mering C., Huynen M., Jaeggi D., Schmidt S., Bork P., Snel B. STRING: a database of predicted functional associations between proteins. Nucleic Acids Research. 2003;31(1):258–261. doi: 10.1093/nar/gkg034. [DOI] [PMC free article] [PubMed] [Google Scholar]
- 26.Chawla K., Tripathi S., Thommesen L., Lægreid A., Kuiper M. TFcheckpoint: a curated compendium of specific DNA-binding RNA polymerase II transcription factors. Bioinformatics. 2013;29(19):2519–2520. doi: 10.1093/bioinformatics/btt432. [DOI] [PubMed] [Google Scholar]
- 27.Scardoni G., Petterlini M., Laudanna C. Analyzing biological network parameters with CentiScaPe. Bioinformatics. 2009;25(21):2857–2859. doi: 10.1093/bioinformatics/btp517. [DOI] [PMC free article] [PubMed] [Google Scholar]
- 28.Dweep H., Sticht C., Pandey P., Gretz N. miRWalk--database: prediction of possible miRNA binding sites by “walking” the genes of three genomes. Journal of Biomedical Informatics. 2011;44(5):839–847. doi: 10.1016/j.jbi.2011.05.002. [DOI] [PubMed] [Google Scholar]
- 29.Ramsay P. T., Carr A. Gastric acid and digestive physiology. The Surgical Clinics of North America. 2011;91(5):977–982. doi: 10.1016/j.suc.2011.06.010. [DOI] [PubMed] [Google Scholar]
- 30.Ratchyk V. M., Orlovs'kyĭ D. V., Makarchuk V. A., Zemlians'kyĭ D. É., Orlovs'kyĭ V. V. Late results of surgical treatment in patients, suffering complicated forms of chronic pancreatitis. Klinicheskaia Khirurgiia. 2014;12:22–25. [PubMed] [Google Scholar]
- 31.Mutoh H., Sakurai S., Satoh K., et al. Cdx1 induced intestinal metaplasia in the transgenic mouse stomach: comparative study with Cdx2 transgenic mice. Gut. 2004;53(10):1416–1423. doi: 10.1136/gut.2003.032482. [DOI] [PMC free article] [PubMed] [Google Scholar]
- 32.Barros R., Freund J. N., David L., Almeida R. Gastric intestinal metaplasia revisited: function and regulation of CDX2. Trends in Molecular Medicine. 2012;18(9):555–563. doi: 10.1016/j.molmed.2012.07.006. [DOI] [PubMed] [Google Scholar]
- 33.Craig M. P., Grajevskaja V., Liao H. K., et al. Etv2 and fli1b function together as key regulators of vasculogenesis and angiogenesis. Arteriosclerosis, Thrombosis, and Vascular Biology. 2015;35(4):865–876. doi: 10.1161/ATVBAHA.114.304768. [DOI] [PMC free article] [PubMed] [Google Scholar]
- 34.Panizo-Santos A., Sola I., de Alava E., Lozano M. D., Idoate M. A., Pardo F. J. Angiomyolipoma and PEComa are immunoreactive for MyoD1 in cell cytoplasmic staining pattern. Applied Immunohistochemistry & Molecular Morphology. 2003;11(2):156–160. doi: 10.1097/00129039-200306000-00012. [DOI] [PubMed] [Google Scholar]
- 35.Liu T., Zhou W., Zhang F., et al. Knockdown of IRX2 inhibits osteosarcoma cell proliferation and invasion by the AKT/MMP9 signaling pathway. Molecular Medicine Reports. 2014;10(1):169–174. doi: 10.3892/mmr.2014.2215. [DOI] [PubMed] [Google Scholar]
- 36.Tao J., Cong H., Wang H., et al. MiR-30a-5p inhibits osteosarcoma cell proliferation and migration by targeting FOXD1. Biochemical and Biophysical Research Communications. 2018;503(2):1092–1097. doi: 10.1016/j.bbrc.2018.06.121. [DOI] [PubMed] [Google Scholar]
- 37.Chen S. W., Zhang Q., Xu Z. F., et al. HOXC6 promotes gastric cancer cell invasion by upregulating the expression of MMP9. Molecular Medicine Reports. 2016;14(4):3261–3268. doi: 10.3892/mmr.2016.5640. [DOI] [PubMed] [Google Scholar]
- 38.Wang Y., Bhandari A., Niu J., et al. The lncRNA UNC5B-AS1 promotes proliferation, migration, and invasion in papillary thyroid cancer cell lines. Human Cell. 2019;32(3):334–342. doi: 10.1007/s13577-019-00242-8. [DOI] [PubMed] [Google Scholar]
- 39.Lou C., Zhao J., Gu Y., et al. LINC01559 accelerates pancreatic cancer cell proliferation and migration through YAP-mediated pathway. Journal of Cellular Physiology. 2019;235(4):3928–3938. doi: 10.1002/jcp.29288. [DOI] [PubMed] [Google Scholar]
- 40.Zhu Y., Bian Y., Zhang Q., et al. LINC00365 promotes colorectal cancer cell progression through the Wnt/β-catenin signaling pathway. Journal of Cellular Biochemistry. 2019;121(2):1260–1272. doi: 10.1002/jcb.29359. [DOI] [PubMed] [Google Scholar]
- 41.Thanasupawat T., Hammje K., Adham I., et al. INSL5 is a novel marker for human enteroendocrine cells of the large intestine and neuroendocrine tumours. Oncology Reports. 2012;29(1):149–154. doi: 10.3892/or.2012.2119. [DOI] [PubMed] [Google Scholar]
- 42.Mashima H., Ohno H., Yamada Y., Sakai T., Ohnishi H. INSL5 may be a unique marker of colorectal endocrine cells and neuroendocrine tumors. Biochemical and Biophysical Research Communications. 2013;432(4):586–592. doi: 10.1016/j.bbrc.2013.02.042. [DOI] [PubMed] [Google Scholar]
- 43.Zhang H., Xie T., Shui Y., Qi Y. Knockdown of PLCB2 expression reduces melanoma cell viability and promotes melanoma cell apoptosis by altering Ras/Raf/MAPK signals. Molecular Medicine Reports. 2020;21(1):420–428. doi: 10.3892/mmr.2019.10798. [DOI] [PubMed] [Google Scholar]
- 44.Jafarzadeh M., Soltani B. M., Dokanehiifard S., Kay M., Aghdami N., Hosseinkhani S. Experimental evidences for hsa-miR-497-5p as a negative regulator of SMAD3 gene expression. Gene. 2016;586(2):216–221. doi: 10.1016/j.gene.2016.04.003. [DOI] [PubMed] [Google Scholar]
- 45.Chen J., Sun D., Chu H., et al. Screening of differential microRNA expression in gastric signet ring cell carcinoma and gastric adenocarcinoma and target gene prediction. Oncology Reports. 2015;33(6):2963–2971. doi: 10.3892/or.2015.3935. [DOI] [PubMed] [Google Scholar]
- 46.Lee J. W., Kim N., Park J. H., et al. Differential microRNA expression between gastric cancer tissue and non-cancerous gastric mucosa according to Helicobacter pylori status. Journal of Cancer Prevention. 2017;22(1):33–39. doi: 10.15430/JCP.2017.22.1.33. [DOI] [PMC free article] [PubMed] [Google Scholar]
- 47.Camilo V., Garrido M., Valente P., et al. Differentiation reprogramming in gastric intestinal metaplasia and dysplasia: role of SOX2 and CDX2. Histopathology. 2015;66(3):343–350. doi: 10.1111/his.12544. [DOI] [PubMed] [Google Scholar]
- 48.Zhang Y., Xu J., Zhang S., et al. HOXA-AS2 promotes proliferation and induces epithelial-mesenchymal transition via the miR-520c-3p/GPC3 axis in hepatocellular carcinoma. Cellular Physiology and Biochemistry. 2018;50(6):2124–2138. doi: 10.1159/000495056. [DOI] [PubMed] [Google Scholar]
- 49.Jin S., Liu M. D., Wu H., et al. Overexpression of hsa-miR-125a-5p enhances proliferation, migration and invasion of head and neck squamous cell carcinoma cell lines by upregulating C-C chemokine receptor type 7. Oncology Letters. 2018;15(6):9703–9710. doi: 10.3892/ol.2018.8564. [DOI] [PMC free article] [PubMed] [Google Scholar]
- 50.Markopoulos G. S., Roupakia E., Tokamani M., et al. Senescence-associated microRNAs target cell cycle regulatory genes in normal human lung fibroblasts. Experimental Gerontology. 2017;96:110–122. doi: 10.1016/j.exger.2017.06.017. [DOI] [PubMed] [Google Scholar]
- 51.Pivonello C., De Martino M. C., Negri M., et al. The GH-IGF-SST system in hepatocellular carcinoma: biological and molecular pathogenetic mechanisms and therapeutic targets. Infectious Agents and Cancer. 2014;9(1) doi: 10.1186/1750-9378-9-27. [DOI] [PMC free article] [PubMed] [Google Scholar]
- 52.Herrera-Martínez A. D., Gahete M. D., Pedraza-Arevalo S., et al. Clinical and functional implication of the components of somatostatin system in gastroenteropancreatic neuroendocrine tumors. Endocrine. 2018;59(2):426–437. doi: 10.1007/s12020-017-1482-3. [DOI] [PubMed] [Google Scholar]
- 53.Saqui-Salces M., Covés-Datson E., Veniaminova N. A., et al. Inflammation and Gli2 suppress gastrin gene expression in a murine model of antral hyperplasia. PLoS One. 2012;7(10, article e48039) doi: 10.1371/journal.pone.0048039. [DOI] [PMC free article] [PubMed] [Google Scholar]
- 54.Pannequin J., Delaunay N., Buchert M., et al. Beta-catenin/Tcf-4 inhibition after progastrin targeting reduces growth and drives differentiation of intestinal tumors. Gastroenterology. 2007;133(5):1554–1568. doi: 10.1053/j.gastro.2007.08.023. [DOI] [PubMed] [Google Scholar]
- 55.Gu H., Ding L., Xiong S. D., Gao X. M., Zheng B. Inhibition of CDK2 promotes inducible regulatory T-cell differentiation through TGFβ-Smad3 signaling pathway. Cellular Immunology. 2014;290(1):138–144. doi: 10.1016/j.cellimm.2014.05.004. [DOI] [PubMed] [Google Scholar]
- 56.Chen C., Breslin M. B., Lan M. S. Sonic hedgehog signaling pathway promotes INSM1 transcription factor in neuroendocrine lung cancer. Cellular Signalling. 2018;46:83–91. doi: 10.1016/j.cellsig.2018.02.014. [DOI] [PubMed] [Google Scholar]
- 57.Fink D. M., Sun M. R., Heyne G. W., et al. Coordinated d-cyclin/Foxd1 activation drives mitogenic activity of the Sonic Hedgehog signaling pathway. Cellular Signalling. 2018;44:1–9. doi: 10.1016/j.cellsig.2017.12.007. [DOI] [PMC free article] [PubMed] [Google Scholar]
Associated Data
This section collects any data citations, data availability statements, or supplementary materials included in this article.
Supplementary Materials
Supplementary file 1 contains 371 differentially expressed genes including 81 upregulated and 290 downregulated genes and compares Hp-positive atrophic gastritis with normal gastric mucosal tissues.
Supplementary file 2 contains 173 differentially expressed genes including 84 upregulated and 89 downregulated genes and compares Hp-positive gastric cancer with Hp-positive atrophic gastritis.
Data Availability Statement
The microarray data used to support the findings of this study are included within the article.


