Key Points
Question
What are the sex-based differences in Canadian residency applications and matching?
Findings
This cross-sectional analysis of aggregate data from the Canadian Residency Matching Services database revealed a total of 48 424 applicants between 1995 and 2019. Female applicants had the highest representation in obstetrics and gynecology and the lowest representation in neurosurgery.
Meaning
In this study, representation of residency applicants by sex varied among specialties.
This cross-sectional analysis examines the representation of female medical school graduates in residency programs by specialty using aggregate data from the Canadian Residency Matching Service database.
Abstract
Importance
Disparities in representation between sexes have been shown at multiple career stages in medicine despite increasing representation in the overall physician workforce.
Objective
To assess sex representation of applicants to the Canadian R-1 entry match for postgraduate training programs from 1995 to 2019, comparing distribution between different specialties as well as applied vs matched applicants.
Design, Setting, and Participants
This cross-sectional analysis of aggregate data provided by the Canadian Resident Matching Service between 1995 and 2019 analyzed aggregate data for the Canadian R-1 residency match from 1995 through 2019.
Exposures
Applicant sex as reported in the Canadian Resident Matching Service database.
Main Outcomes and Measures
The sex representation of applicants was compared and the longitudinal trends in sex representation were analyzed by specialty between 1995 and 2019. The sex representation of overall applicants to the Canadian R-1 entry match were compared with matched applicants, and both were stratified by specialty.
Results
A total of 48 424 applicants were identified (26 407 [54.5%] female applicants), of which 41 037 were matched applicants. Using specialty groupings, female applicants were most highly represented in obstetrics and gynecology (1776 of 2090 [85.0%]) and least represented in radiology (658 of 2055 [32.0%]). Within individual subspecialties, female applicants had the lowest representation in neurosurgery (90 of 394 [22.8%]). While female applicants represented an increasing proportion of the overall applicant population between 1995 and 2019 (z = 2.71; P = .007), significant increases were seen in some, but not all, individual specialties. Differences by sex were found among Canadian medical graduate match rates to their top-ranked specialty: female applicants had a lower likelihood of being rejected for family medicine (rejection of male applicants: OR, 0.46; 95% CI, 0.39-0.54; P < .001) and psychiatry (OR, 0.59; 95% CI, 0.46-0.76; P < .001) and were more likely to be rejected for all-encompassing surgery (acceptance of male applicants: OR, 1.19; 95% CI, 1.10-1.28; P < .001).
Conclusions and Relevance
Increasing representation of female residency applicants over time was seen in some, but not all, medical specialties in Canada, and sex-based differences in successful match rates were observed in some specialties. The reasons for these disparities require further investigation for corrective strategies to be identified.
Introduction
Sex disparities have been shown at multiple levels of female physicians’ careers, despite increasing representation in the physician workforce. A 2006 study1 focusing on sex demonstrated that the majority of physicians working in pediatrics, obstetrics and gynecology, and family medicine are female. In 2003, 75% of Canadian physicians between the ages of 45 to 65 were male2; today, more than 50% of medical school matriculants are female. Analyzing data from the Canadian Residency Matching Services (CaRMS), Baerlocher and Detsky2 determined that between 1995 and 2004, the odds ratio of being rejected from a first-choice residency program was 1.6-fold greater for male applicants than for female applicants. Furthermore, psychiatry, family medicine, and emergency medicine showed statistically significantly increased odds of rejection for men.2 Although increasing attention has been paid recently to gender disparities within the medical profession, what is lacking is a contemporary and updated analysis of applicants to the Canadian R-1 entry match for postgraduate training positions to identify whether disparities in sex representation occur at this stage of career in specialty choice and whether applicant success within the medical specialties varies by sex.
This study sought to examine sex representation in different medical specialties of matched R-1 entry match applicants from Canadian medical schools between 1995 and 2019. Secondarily, we aimed to analyze sex differences among successful match rates between different specialties.
Methods
We conducted a retrospective analysis of the sex of Canadian medical graduate (CMG) applicants to the R-1 entry match (ie, first year of residency after matriculating from medical school) between 1995 and 2019. We obtained institutional research ethics board approval from the University Health Network Research Ethics Board with a waiver of informed consent because the study used publicly available aggregate data. This study abided by the Strengthening the Reporting of Observational Studies in Epidemiology (STROBE) reporting guideline.
Data Sources
We extracted publically available sex-stratified aggregate data from CaRMS database from 1995 to 2019.26 Data were analyzed in January 2020. Prior to 1995, CaRMS did not collect applicant sex as part of their match-related data.
Study Population
We included matched and unmatched CMG applicants to the R-1 specialty match between 1995 and 2019, inclusively. Specialty choice was defined as the applicant’s first-ranked choice. We included only CMGs because the processes for international medical graduates are distinct from those of CMGs.
Data Collection and Outcome Measures
We extracted the following information: (1) aggregate data of both male and female applicants applying to a top-ranked chosen specialty as well as those who matched to their top-ranked specialty; and (2) sex-stratified CMGs. Only sex binaries (ie, male or female) are provided in the CaRMS database.
Specialty Groups
Specialties were considered to be independent of each other, and specialties with less than 5 applicants per year were not presented individually to maintain anonymity. Specialties were collapsed into the following groups for ease of analysis, with specialities with less than 5 applicants matched per year excluded from individual analysis or grouped together as noted to maintain anonymity: (1) surgical specialties (cardiac surgery, general surgery, neurosurgery, ophthalmology, orthopedic surgery, otolaryngology, plastic surgery, thoracic surgery, urology, and vascular surgery) were analyzed both as an overall group and as individual specialities (thoracic and vascular surgery both had <5 matched applicants per year and trends were not presented individually); (2) pathology and laboratory medicine subspecialties were grouped together because of the low and variable numbers of applicants to individual subspecialties (ie, anatomical pathology, general pathology, laboratory medicine, medical biochemistry, medical microbiology, and neuropathology); (3) medical genetics was grouped with pediatrics because of the small absolute number of applicants to this specialty; (4) internal medicine was grouped with dermatology, as well as occupational health; (5) family medicine was grouped with community/public health; and (6) diagnostic radiology was grouped with nuclear medicine. We also note that neurology programs in Canada incorporate both adult and pediatric neurology training.
Statistical Analysis
Specialty-stratified data were analyzed using percentages. Trends in sex representation over the study period were analyzed using a nonparametric test for trend.3 Logistic regression was used to analyze the relationship between sex and successful first choice. P < .05 was considered statistically significant in 2-tailed tests, and data analysis was performed using R version 3.6.0 (R Project for Statistical Computing) and STATA version 12.1 (StataCorp).
Results
Study Population Characteristics
The final study population included a total of 48 557 CMG applicants to the R-1 entry match, including 41 131 applicants who were successfully matched to their first-choice specialty. Of all CMG applicants, 26 460 (54.5%) were female, and of the CMG successfully matched applicants, 22 808 (55.5%) were female. There was an average of 1942 (range, 949-2915) applicants per year over the 25-year period analyzed.
Data were missing between 1995 and 1997, inclusively, for the following subspecialties: anatomical pathology, general pathology, hematological pathology, neuropathology, medical biochemistry, medical microbiology, medical genetics, surgical specialties, nuclear medicine, occupational medicine, community and public health, dermatology, physical medicine and rehabilitation, and radiation oncology. Several specialties reported data for limited years of the data set: medical biochemistry from 2005 to 2012; neuropathology from 1998 to 2007; occupational medicine from 1998 to 2006; thoracic surgery from 1998 to 2002; and vascular surgery from 2012 to 2019. This observation likely reflects ongoing changes to programs participating in the R-1 match process. Other random missing data points were minimal and included general pathology (5), hematological pathology (4), laboratory medicine (3), and medical microbiology (1). Finally, applicants could list their specialty category as other from 1995 through 1997; these respondents (133 applicants; 94 applicants matched) were omitted from the analysis as the specialty could not be determined, leaving 48 424 total applicants (26 407 [54.5%] female) and 41 037 matched applicants for the final analysis (eTable in Supplement).
Sex Representation in Applicants by Specialty
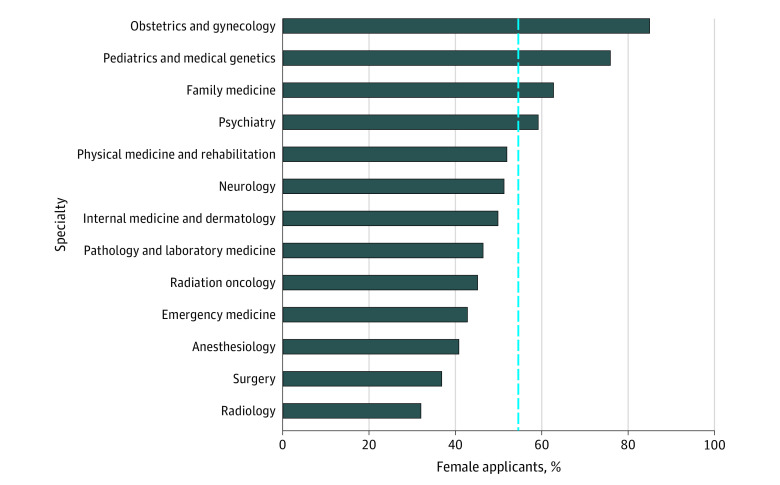
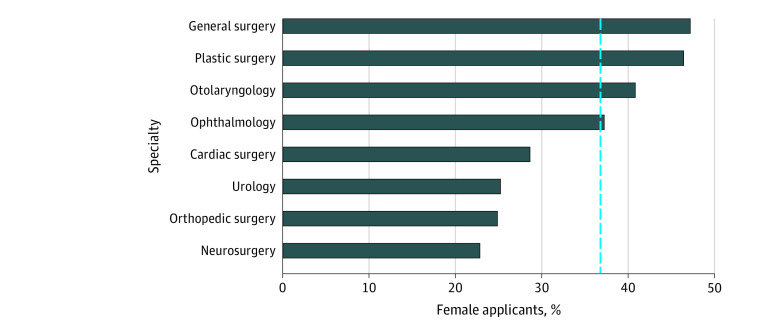
The overall proportion of female applicants varied by specialty (Figure 1; eAppendix in the Supplement). Specialties with a higher than average proportion of female applicants included: obstetrics and gynecology (1776 of 2090 [85.0%]), pediatrics and medical genetics (2427 of 3198 [75.9%]), family medicine (10 333 of 16 473 [62.7%]), and psychiatry (1663 of 2810 [59.2%]). In contrast, specialty groupings with the lowest proportion of female applicants included radiology (658 of 2055 [32.0%]), surgery (2711 of 7357 [36.8%]), anesthesiology (1005 of 2463 [40.8%]), and emergency medicine (716 of 1673 [42.8%]). There was considerable variation in the representation of female applicants to the following surgical subspecialties: general surgery (901 of 1909 [47.2%]), plastic surgery (423 of 911 [46.4%]), otolaryngology (303 of 742 [40.8%]), vascular surgery (34 of 88 [38.6%]), ophthalmology (382 of 1026 [37.2%]), cardiac surgery (59 of 206 [28.6%]), urology (195 of 773 [25.2%]), orthopedic surgery (324 of 1303 [24.9%]), and neurosurgery (90 of 394 [22.8%]) (Figure 2).
Figure 1. Percentage of Female Canadian Medical Graduate R-1 Entry Match Applicants to Each Specialty Group.
The blue reference line indicates the overall percentage of female applicants in the data set (54.5%).
Figure 2. Percentage of Female Canadian Medical Graduate R-1 Entry Match Applicants Matched to Each Surgical Subspecialty.
The blue reference line indicates the overall percentage of female applicants matched to surgery (36.8%).
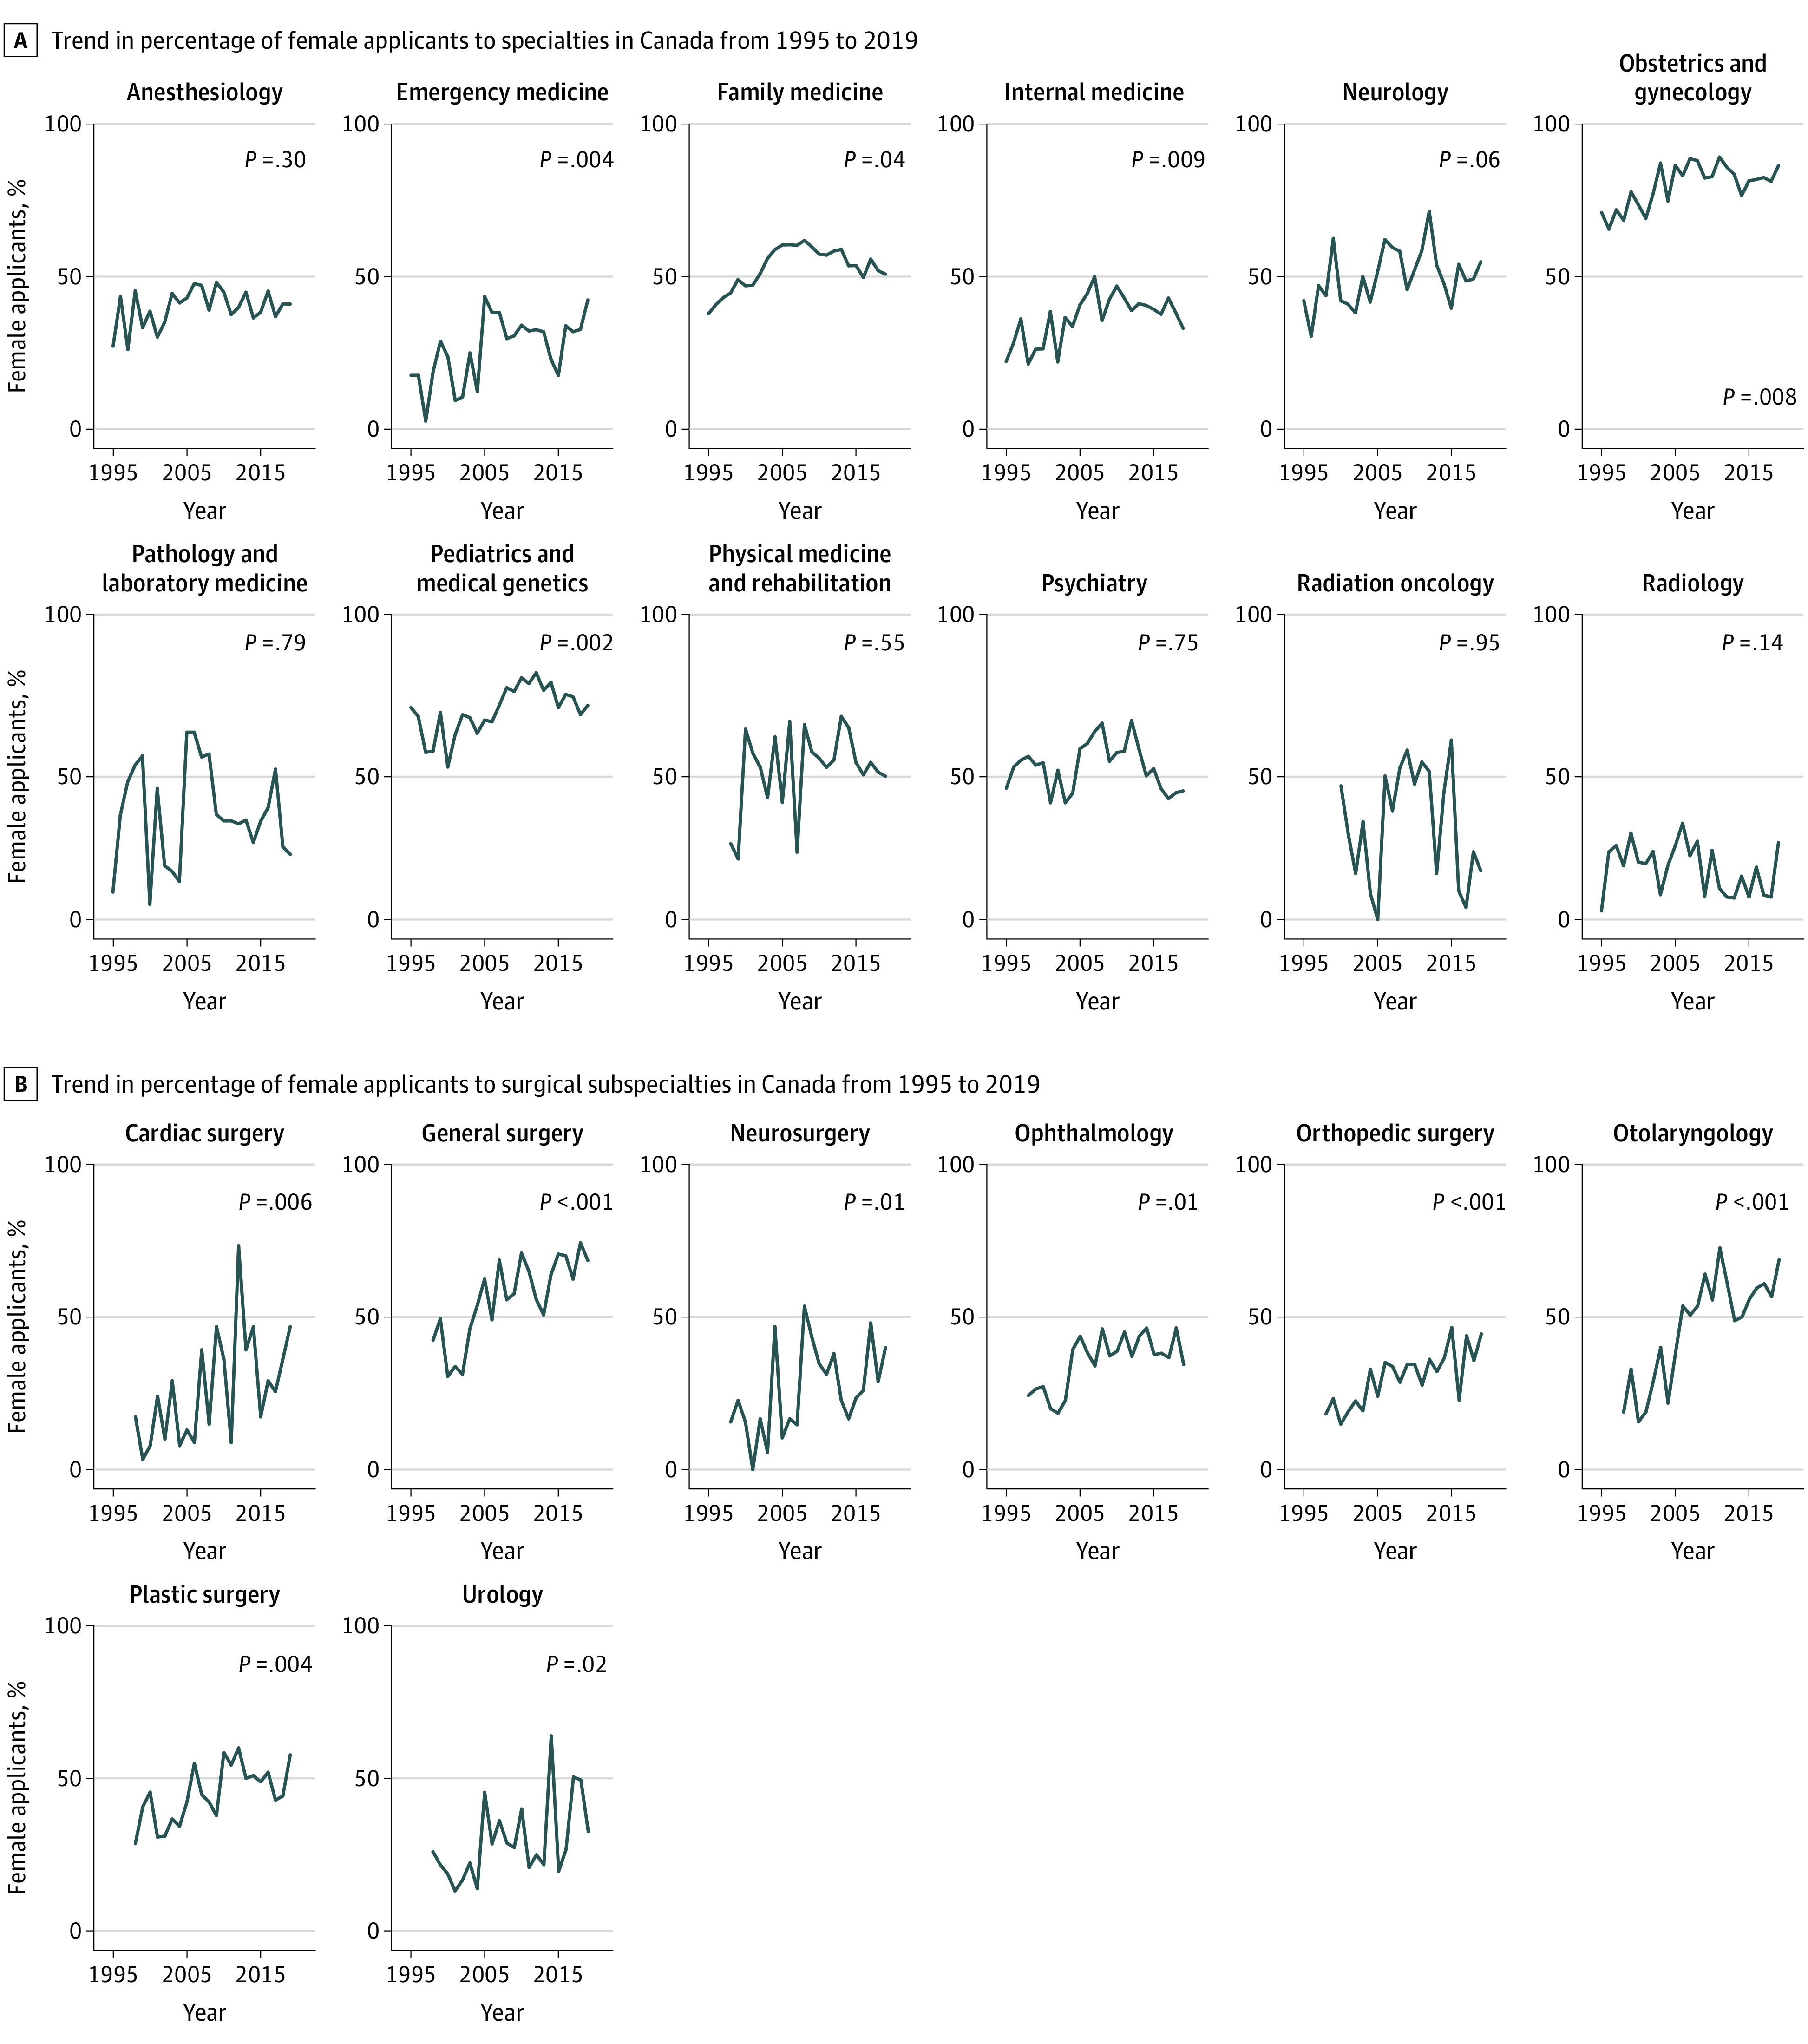
We observed an overall increase in female applicants to the R-1 entry match between 1995 and 2019 (z = 2.71; P = .007) as well as within several, but not all, specialties (Figure 3). Within individual surgical subspecialties, significant increases in female applicants over the study period were seen in all surgical specialties (Figure 3).
Figure 3. Trend in Percentage of Female Applicants to Specialties in Canada From 1995 to 2019.

Successful Match Rates to First-Ranked Specialties
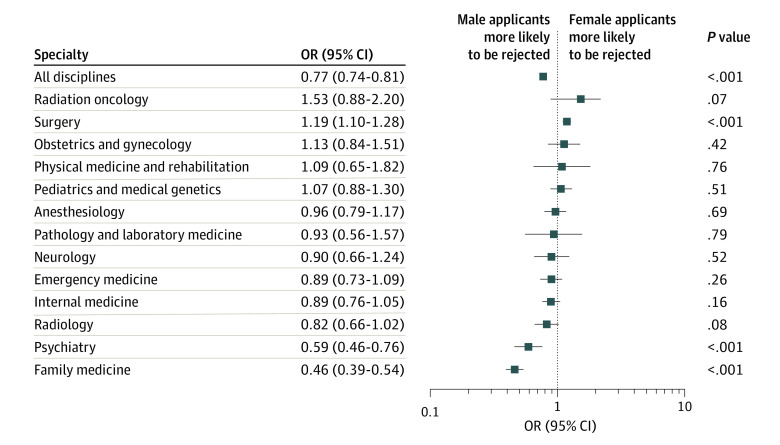
The percentage of applicants successfully matched to their first-choice specialty, stratified by specialty, is provided in Figure 4. Overall, male applicants were more likely to be unsuccessfully matched than female applicants, although variation existed within subspecialties. Female applicants were less likely to be successfully matched to surgery (acceptance of male applicants: OR, 1.19; 95% CI, 1.10-1.28; P < .001) and more likely to be successfully matched to family medicine (rejection of male applicants: OR, 0.46; 95% CI, 0.39-0.54; P < .001) and psychiatry (OR, 0.59; 95% CI, 0.46-0.76; P < .001).
Figure 4. Odds Ratio of Female:Male Canadian Medical Graduate Applicants Not Matched to Their Top-Ranked Specialty From 1995 to 2019.
Discussion
We examined sex-related differences in Canadian medical residency applicants using the most comprehensive residency matching services database available to date. We identified wide disparities in the representation of female applicants in subspecialties, with obstetrics and gynecology, pediatrics and medical genetics, and internal medicine having high rates of female applicants matched compared with specialties such as radiology, surgery, and radiation oncology. Increases in female matched applicants over time also varied considerably, with some specialties showing a consistent increase and others not. Finally, we detected a difference by sex for successful match rates to first-ranked specialty, with female applicants being more likely to match overall but less likely to match to a surgical specialty. These observations suggest that sex plays a role in specialty choice and in program selection of successful applicants. Our results do not address the reasons behind these observations, which are important next steps for research.
Although female applicants make up the majority of the R-1 entry match over the 25 years examined in our study, we found wide variation in representation by specialty as well as within surgical subspecialties. We did not study causality; however, these findings are almost certainly multifactorial and described in other reports.4,5,6 For example, expected work hours and flexibility varies across different specialties. Since female physicians spend a disproportionate amount of time on domestic work and parenting compared with male physicians,7 they may be more inclined to select specialties with more flexibility. Female applicants were also more likely to attribute increased significance to additional factors such as culture, inclusion, and diversity more than men in a previous study.8 An increase in the visibility of female physicians within specialties and the percentage of their representation as program directors within a specialty have been shown to be correlated with the percentage of female physicians entering a specialty.9,10 Moreover, medical students’ exposure to sex discrimination influences female students’ choice of specialty more than for male students; as a result, female medical graduates may be less likely to pursue an academic career.11,12 Evidence suggests that the surgical culture is changing,13,14,15,16 potentially accounting for the gradual increase in female physicians seen in all surgical subspecialties. More concerning are the differences in successful match rates among male and female applicants in surgery, psychiatry, and family medicine. Some literature17,18,19,20,21 suggests the fact that male applicants are more likely to match to male-dominated specialties, and female applicants to female-dominated specialties, may reflect stereotyping, culture and climate, exposure to the specialty, and/or mentoring, although these deserve more investigation.
Program directors and residency program match committees should be cognizant of inherent personal, though often unconscious, bias (ie, implicit bias) as well as structural or systemic biases when reviewing medical student applications.22,23,24,25 Increasing representation of all sexes and genders at a faculty level may increase medical student interests as they are able to witness role models and picture themselves in these positions. Over a 10-year period (2010-2019), 74.2% of 388 027 R-1 entry match applicants chose cultural diversity of the town or city in which they would be embarking on residency as the most influential factor in their first-choice program location.26
The effect of the novel coronavirus disease 2019 pandemic on workforce disparities has yet to be fully revealed, but it is predicted that progress in gender equity will suffer.27 For female medical graduates in medicine, many will be at a more marked disadvantage regarding pay and promotion disparities.28 While not known, it is plausible that virtual interviews for medical school and other positions will promote higher levels of implicit bias for female applicants and/or racial minorities.29
Limitations
This study has several limitations. First, this study is limited by the nature of the data available from the CaRMS database. Although sex and gender exist on a spectrum, CaRMS reports sex in binary terms; therefore, we decided to stay consistent with the collected sex-related data and report it as such. However, this study of sex-related representation is relevant to the gendered phenomenon regarding disparities within specialties utilizing the Canadian R-1 match data. Second, some data points were missing or unavailable at the time of analysis. Third, we are unable to determine which applicants switched specialty or took a leave of absence, which may influence overall proportions (although we expect these events to be uncommon). Fourth, we were also unable to determine the reasons why CMGs apply to specific programs or for further subspecialization (ie, for fellowships), which were not included in our analysis.
Conclusions
Trends in the representation of female CMGs among R-1 entry match applicants varied by specialty, with an overall increase over time seen in most, but not all, specialties. When considering applicant success, female applicants were more likely to be unsuccessful in matching to their first-ranked specialty when applying to a surgical specialty and more likely to be successful when applying to psychiatry and family medicine. The reasons for differences in specialty selection and match success by sex require further research, and strategies must be developed to address these disparities. Furthermore, future research should be performed looking at the intersection of gender (for all gender identities) and other self-identified social constructs (eg, race, ethnicity, ability).
eTable. Number of CaRMS Applicants by Specialty, Stratified by Gender
References
- 1.Jagsi R, Guancial EA, Worobey CC, et al. The “gender gap” in authorship of academic medical literature—a 35-year perspective. N Engl J Med. 2006;355(3):281-287. doi: 10.1056/NEJMsa053910 [DOI] [PubMed] [Google Scholar]
- 2.Baerlocher MO, Detsky AS. Are applicants to Canadian residency programs rejected because of their sex? CMAJ. 2005;173(12):1439-1440. doi: 10.1503/cmaj.050739 [DOI] [PMC free article] [PubMed] [Google Scholar]
- 3.Cuzick J. A Wilcoxon-type test for trend. Stat Med. 1985;4(4):543-547. doi: 10.1002/sim.4780040416 [DOI] [PubMed] [Google Scholar]
- 4.Silver JK. Understanding and addressing gender equity for women in neurology. Neurology. 2019;93(12):538-549. doi: 10.1212/WNL.0000000000008022 [DOI] [PubMed] [Google Scholar]
- 5.Spector ND, Asante PA, Marcelin JR, et al. Women in pediatrics: progress, barriers, and opportunities for equity, diversity, and inclusion. Pediatrics. 2019;144(5):e20192149. doi: 10.1542/peds.2019-2149 [DOI] [PubMed] [Google Scholar]
- 6.Bucknor A, Kamali P, Phillips N, et al. Gender inequality for women in plastic surgery: a systematic scoping review. Plast Reconstr Surg. 2018;141(6):1561-1577. doi: 10.1097/PRS.0000000000004375 [DOI] [PubMed] [Google Scholar]
- 7.Jolly S, Griffith KA, DeCastro R, Stewart A, Ubel P, Jagsi R. Gender differences in time spent on parenting and domestic responsibilities by high-achieving young physician-researchers. Ann Intern Med. 2014;160(5):344-353. doi: 10.7326/M13-0974 [DOI] [PMC free article] [PubMed] [Google Scholar]
- 8.Agawu A, Fahl C, Alexis D, et al. The influence of gender and underrepresented minority status on medical student ranking of residency programs. J Natl Med Assoc. 2019;111(6):665-673. doi: 10.1016/j.jnma.2019.09.002 [DOI] [PubMed] [Google Scholar]
- 9.Bissing MA, Lange EMS, Davila WF, et al. Status of women in academic anesthesiology: a 10-year update. Anesth Analg. 2019;128(1):137-143. doi: 10.1213/ANE.0000000000003691 [DOI] [PubMed] [Google Scholar]
- 10.Long TR, Elliott BA, Warner ME, Brown MJ, Rose SH. Resident and program director gender distribution by specialty. 2011;20(12):1867-1870. doi: 10.1089/jwh.2011.2906 [DOI] [PubMed] [Google Scholar]
- 11.Stratton TD, McLaughlin MA, Witte FM, Fosson SE, Nora LM. Does students’ exposure to gender discrimination and sexual harassment in medical school affect specialty choice and residency program selection? Acad Med. 2005;80(4):400-408. doi: 10.1097/00001888-200504000-00020 [DOI] [PubMed] [Google Scholar]
- 12.Haviland MG, Yamagata H, Werner LS, Zhang K, Dial TH, Sonne JL. Student mistreatment in medical school and planning a career in academic medicine. Teach Learn Med. 2011;23(3):231-237. doi: 10.1080/10401334.2011.586914 [DOI] [PubMed] [Google Scholar]
- 13.Freischlag JA. Women surgeons—still in a male-dominated world. Yale J Biol Med. 2008;81(4):203-204. [PMC free article] [PubMed] [Google Scholar]
- 14.Buyske J. Women in surgery: the same, yet different. Arch Surg. 2005;140(3):241-244. doi: 10.1001/archsurg.140.3.241 [DOI] [PubMed] [Google Scholar]
- 15.Joshi ART, Vargo D, Mathis A, Love JN, Dhir T, Termuhlen PM. Surgical residency recruitment-opportunities for improvement. J Surg Educ. 2016;73(6):e104-e110. doi: 10.1016/j.jsurg.2016.09.005 [DOI] [PubMed] [Google Scholar]
- 16.Grover K, Agarwal P, Agarwal N, Tabakin MD, Swan KG. Students to surgeons: increasing matriculation in surgical specialties. Surg Innov. 2016;23(6):623-634. doi: 10.1177/1553350616656283 [DOI] [PubMed] [Google Scholar]
- 17.Bates C, Gordon L, Travis E, et al. Striving for gender equity in academic medicine careers: a call to action. Acad Med. 2016;91(8):1050-1052. doi: 10.1097/ACM.0000000000001283 [DOI] [PMC free article] [PubMed] [Google Scholar]
- 18.O’Connor MI. Medical school experiences shape women students’ interest in orthopaedic surgery. Clin Orthop Relat Res. 2016;474(9):1967-1972. doi: 10.1007/s11999-016-4830-3 [DOI] [PMC free article] [PubMed] [Google Scholar]
- 19.Dzau VJ, Johnson PA. Ending sexual harassment in academic medicine. N Engl J Med. 2018;379(17):1589-1591. doi: 10.1056/NEJMp1809846 [DOI] [PubMed] [Google Scholar]
- 20.Schmidt LE, Cooper CA, Guo WA. Factors influencing US medical students’ decision to pursue surgery. J Surg Res. 2016;203(1):64-74. doi: 10.1016/j.jss.2016.03.054 [DOI] [PubMed] [Google Scholar]
- 21.Zuzuarregui J-R, Wu C, Hohler AD. Promoting careers in neurology: mentorship of medical students. Semin Neurol. 2018;38(4):413-417. doi: 10.1055/s-0038-1666988 [DOI] [PubMed] [Google Scholar]
- 22.Maxfield CM, Thorpe MP, Desser TS, et al. Bias in radiology resident selection: do we discriminate against the obese and unattractive? Acad Med. 2019;94(11):1774-1780. doi: 10.1097/ACM.0000000000002813 [DOI] [PubMed] [Google Scholar]
- 23.Ross DA, Boatright D, Nunez-Smith M, Jordan A, Chekroud A, Moore EZ. Differences in words used to describe racial and gender groups in medical student performance evaluations. PLoS One. 2017;12(8):e0181659. doi: 10.1371/journal.pone.0181659 [DOI] [PMC free article] [PubMed] [Google Scholar]
- 24.Jagsi R, Griffith KA, DeCastro RA, Ubel P. Sex, role models, and specialty choices among graduates of US medical schools in 2006-2008. J Am Coll Surg. 2014;218(3):345-352. doi: 10.1016/j.jamcollsurg.2013.11.012 [DOI] [PubMed] [Google Scholar]
- 25.Klein R, Julian KA, Snyder ED, et al. ; From the Gender Equity in Medicine (GEM) workgroup . Gender bias in resident assessment in graduate medical education: review of the literature. J Gen Intern Med. 2019;34(5):712-719. doi: 10.1007/s11606-019-04884-0 [DOI] [PMC free article] [PubMed] [Google Scholar]
- 26.Canadian Resident Matching Service Most influential factors on R-1 match discipline and program location choice. Accessed Dec 30, 2019. https://www.carms.ca/data-reports/R-1-data-reports/influential-factors
- 27.Connor J, Madhavan S, Mokashi M, et al. Health risks and outcomes that disproportionately affect women during the Covid-19 pandemic: a review. Soc Sci Med. 2020;266:113364. doi: 10.1016/j.socscimed.2020.113364 [DOI] [PMC free article] [PubMed] [Google Scholar]
- 28.Silver JK, Larson AR, Jagsi R. COVID-19 and the effect on the gender pay gap in medicine. BMJ Opinion. July 31, 2020. Accessed September 20, 2020. https://blogs.bmj.com/bmj/2020/07/31/covid-19-and-the-effect-on-compensation-and-financial-stress-for-women-in-medicine/
- 29.Nwora C, Allred DB, Verduzco-Gutierrez M. Mitigating bias in virtual interviews for applicants who are underrepresented in medicine. J Natl Med Assoc. 2020;(August):S0027-9684(20)30151-6. doi: 10.1016/j.jnma.2020.07.011 [DOI] [PMC free article] [PubMed] [Google Scholar]
Associated Data
This section collects any data citations, data availability statements, or supplementary materials included in this article.
Supplementary Materials
eTable. Number of CaRMS Applicants by Specialty, Stratified by Gender


