

Abstract
For brain computer interfaces (BCI), the immune response to implanted electrodes is a major biological cause of device failure. Bioactive coatings such as neural adhesion molecule L1 have been shown to improve the biocompatibility, but are difficult to handle or produce in batches. Here, a synthetic zwitterionic polymer coating, poly(sulfobetaine methacrylate) (PSBMA) is developed for neural implants with the goal of reducing the inflammatory host response. In tests in vitro, the zwitterionic coating inhibits protein adsorption and the attachment of fibroblasts and microglia, and remains stable for at least 4 weeks. In vivo two-photon microscopy on CX3CR1-GFP mice shows that the zwitterionic coating significantly suppresses the microglial encapsulation of neural microelectrodes over a 6 h observation period. Furthermore, the lower microglial encapsulation on zwitterionic polymer-coated microelectrodes is revealed to originate from a reduction in the size but not the number of microglial end feet. This work provides a facile method for coating neural implants with zwitterionic polymers and illustrates the initial interaction between microglia and coated surface at high temporal and spatial resolution.
Keywords: microglia, neural implants, two-photon microscopy, zwitterionic polymer
1. Introduction
Microscale electrodes are an essential tool in basic neuroscience research and are emerging as therapeutic devices due to their capability to record action potentials from neural populations and modulate neural activity via electrical stimulation.[1–12] In clinical applications, brain computer interfaces (BCI) utilizing implantable electrode arrays have demonstrated promising results in restoring functional motor control via recorded movement signals,[13,14] while sensory feedback provided by microstimulation is poised to achieve close-loop control.[15,16] Although the applications of implantable electrode arrays in both clinical and research settings continue to expand rapidly, these devices face the general issue of signal quality degradation.[17,18] Maintaining a healthy electrode–tissue interface has been particularly challenging due to the subtle and complex tissue responses.[17,19] BBB disruption, acute and chronic inflammation, gliosis, neural degeneration and demyelination have all been suggested as key biological responses attenuating recording quality of these devices.[17,20–28] Among the complex tissue responses, protein adsorption on the electrode surface has been hypothesized to be the key step initiating the inflammatory response.[1,17,29] Device implantation inevitably disrupts the BBB, resulting in leakage of plasma proteins into the extracellular space.[28] These proteins, including albumin, fibrinogen, and complement proteins, can adsorb to the surface of implants and activate the inflammation pathways.[29,30] Over time, inflammation leads to glial scarring and neuronal loss, resulting in degradation of recording quality and yield.[1,23,31]
In the brain, microglia acts as the first responder to brain injury,[32] and their activity modulates both glial and neuronal tissue responses.[33] In neural inflammation, the microglial contribution has been well documented.[34] Microglia constantly survey tissue and once it detects tissue damage, they become “activated” resulting in biochemical and morphological changes.[35,36] Biochemical changes in microglial activation associated with implantation injury include upregulation of proinflammatory cytokines, which can drive neurons toward excitotoxicity and neurodegeneration.[17,23,37] Prolonged inflammation results in gliosis characterized by a dense sheath of microglia and astrocytes encapsulating the electrodes and preventing the information flow from and to the devices.[17,20,23,38] Microglial morphological changes in response to electrode implantation have been characterized on CX3CR1-GFP mice by our group.[20,25,39–42] CX3CR1 promoter is expressed exclusively in microglia in the brain, and some types of leukocytes in the periphery. Using two-photon microscopy and CX3CR1-GFP mice, we observed immediate extension of microglial processes toward the implanted electrode device with minimal cell body movement over the first 6 h postimplantation.[20] Microglia close to the probe exhibited polarized morphology while those at intermediate distances remained ramified. [20] 24 h postimplantation, these CX3CR1-GFP cells near the implant displayed amoeboid morphology.[20] This immediate microglial reaction to the implanted device and the interaction between microglial processes and the device surface suggests a possible intervention time window to modulate the downstream inflammatory host tissue response.
Our previous work using biomimetic neurocamouflage coatings showed that neural adhesion molecule L1-modified electrode surfaces enhanced neurite outgrowth and reduced astrocytes attachment in vitro.[43] Follow up work demonstrated that L1 modified probes implanted in rat cortex for up to 8 weeks showed significantly reduced loss of neuronal cell bodies, increased axonal density, and lower activation of microglia and reaction of astrocytes around implantation site compared to uncoated devices.[44] Additionally, L1-coated electrodes showed enhanced neuronal survival around implantation sites in rat spinal cord and dorsal root ganglion.[45] Recent in vivo two-photon microscopy studies demonstrated a reduction in microglial surface coverage on L1 coated probes surface.[46] Although such biomimetic and bioactive strategies have been successful, biomolecules are fragile and can lose bioactivity during handling, storage, and in vivo use. Additionally, biomolecules derived from biological tissue can be immunogenic and present a greater regulatory challenge for commercialization.[47] Thus, synthetic polymer coatings represent a compelling alternative.
Zwitterionic polymers, whose monomer contains both positive and negative charges, have gained increased attention in recent years. Applications of zwitterionic polymers span a broad range of research fields including membrane,[48,49] drug delivery,[50] smart polymers,[51] and biosensors, [52–54] because of their superior hydrophilicity and ultralow-fouling properties. A rich body of literature has demonstrated that using zwitterionic polymers can create antifouling surfaces to resist nonspecific protein adsorption, bacterial adhesion, and cell attachment in vitro.[55–59] In vivo experiments of subcutaneously implanted zwitterionic hydrogels have also been shown to resist fibrosis in mice.[55] However, research exploring the application of zwitterionic polymer coatings on neural electrodes has been limited.[60,61] To the best of our knowledge, our group published the first report evaluating the impact of zwitterionic coatings on in vivo tissue response to intracortical microelectrodes.[62] In that work, we codeposited zwitterionic catechol-poly(sulfobetaine methacrylate) (PSBMA) with polydopamine (PDA) on silicon neural probes. PDA was codeposited to improve the stability of zwitterionic catechol–PSBMA.[62] Histological results revealed decreased activation of microglia and astrocytes near the catechol–PSBMA–PDA coated neural implants at 1 week postimplant. This promising result motivated us to further optimize the zwitterionic coating and investigate how zwitterionic coatings interact with the brain tissue at high temporal and spatial resolution.
Here, we adapted a photoiniferter mediated polymerization method to anchor pure zwitterionic PSBMA polymer onto the surface of silicon neural probes.[63] Using this surface chemistry method, we are able to produce a stable and pure PSBMA coating, which is more resistant to biofouling than the catechol–PSBMA–PDA composite coating. In this work, we first characterized the surface chemistry, coating thickness and stability of the prepared zwitterionic PSBMA coating using X-ray photo electron spectroscopy (XPS), ellipsometry, and water contact angle measurements. We then evaluated the antifouling performance of PSBMA using a protein adsorption and cell culture assay in vitro. Finally, we implanted PSBMA-coated devices into the brain of CX3CR1-GFP mice and monitored microglia responses toward neural implants using in vivo two-photon microscopy for 6 h. Two-photon microscopy enabled direct observations of the immediate microglia–implant interaction at subcellular resolution, which shed light on the mechanism of the action of zwitterionic coatings in vivo.
2. Results
2.1. PSBMA Coating Method Is Robust and Produces Stable Coating
The general surface coating procedure is demonstrated in Figure 1. The silicon substrate (silicon wafer for in vitro test or Michigan probe for in vivo test) is first treated with oxygen plasma to functionalize surface with hydroxyl groups, which are then used to covalently immobilize N,N-(diethylamino) dithiocarbamoyl-benzyl (trimethoxy silane) (SBDC) through dip coating. After the surface is functionalized with a SBDC self-assembled monolayer (SAM), PSBMA polymer is then grown on the surface through photopolymerization. The surface modification method was first examined on a Si wafer to examine the reproducibility of the coating procedure and coating stability. Successful synthesis of SBDC with an improved procedure was confirmed with 1H NMR spectrum (Figure S1, Supporting Information). XPS analysis was used to characterize the SBDC and PSBMA modified Si wafer surface. For SBDC coated surface, XPS spectra analysis showed peaks for O1s (537.5eV), C1s (285.43eV), S2p (167.66eV), N1s (402.69eV), and Si2p (99.82eV) (Figure 2a), which are elements expected from the SBDC on silicon. Furthermore, the atomic ratio of oxygen, carbon, sulfur, nitrogen, and silicon is 22.86%, 48.91%, 7.42%, 4.88%, and 15.94%, respectively. The ratio between N to S is 0.66, which is close to the theoretical value of 0.5 for SBDC. After polymerizing PSBMA on top of the SBDC modified surface through photopolymerzation, the XPS spectra showed peaks of O1s (530.89 eV), C1s (285.01 eV), S2p (167.08 eV), N1s (401.8 eV), and Si2p (101.38 eV) (Figure 2b). The atomic ratio of oxygen, carbon, sulfur, nitrogen, and silicon is 25.82%, 61.60%, 5.14%, 5.56%, and 1.88%, respectively. The increase in O and C, and decrease in Si indicate the successful addition of the polymer layer. The ratio of N to S is 1.08, consistent with the theoretical value of 1 for PSBMA. The atomic ratio change of elements as well as the N to S ratio change both confirmed the successful modification of silicon wafer surface with PSBMA.
Figure 1.
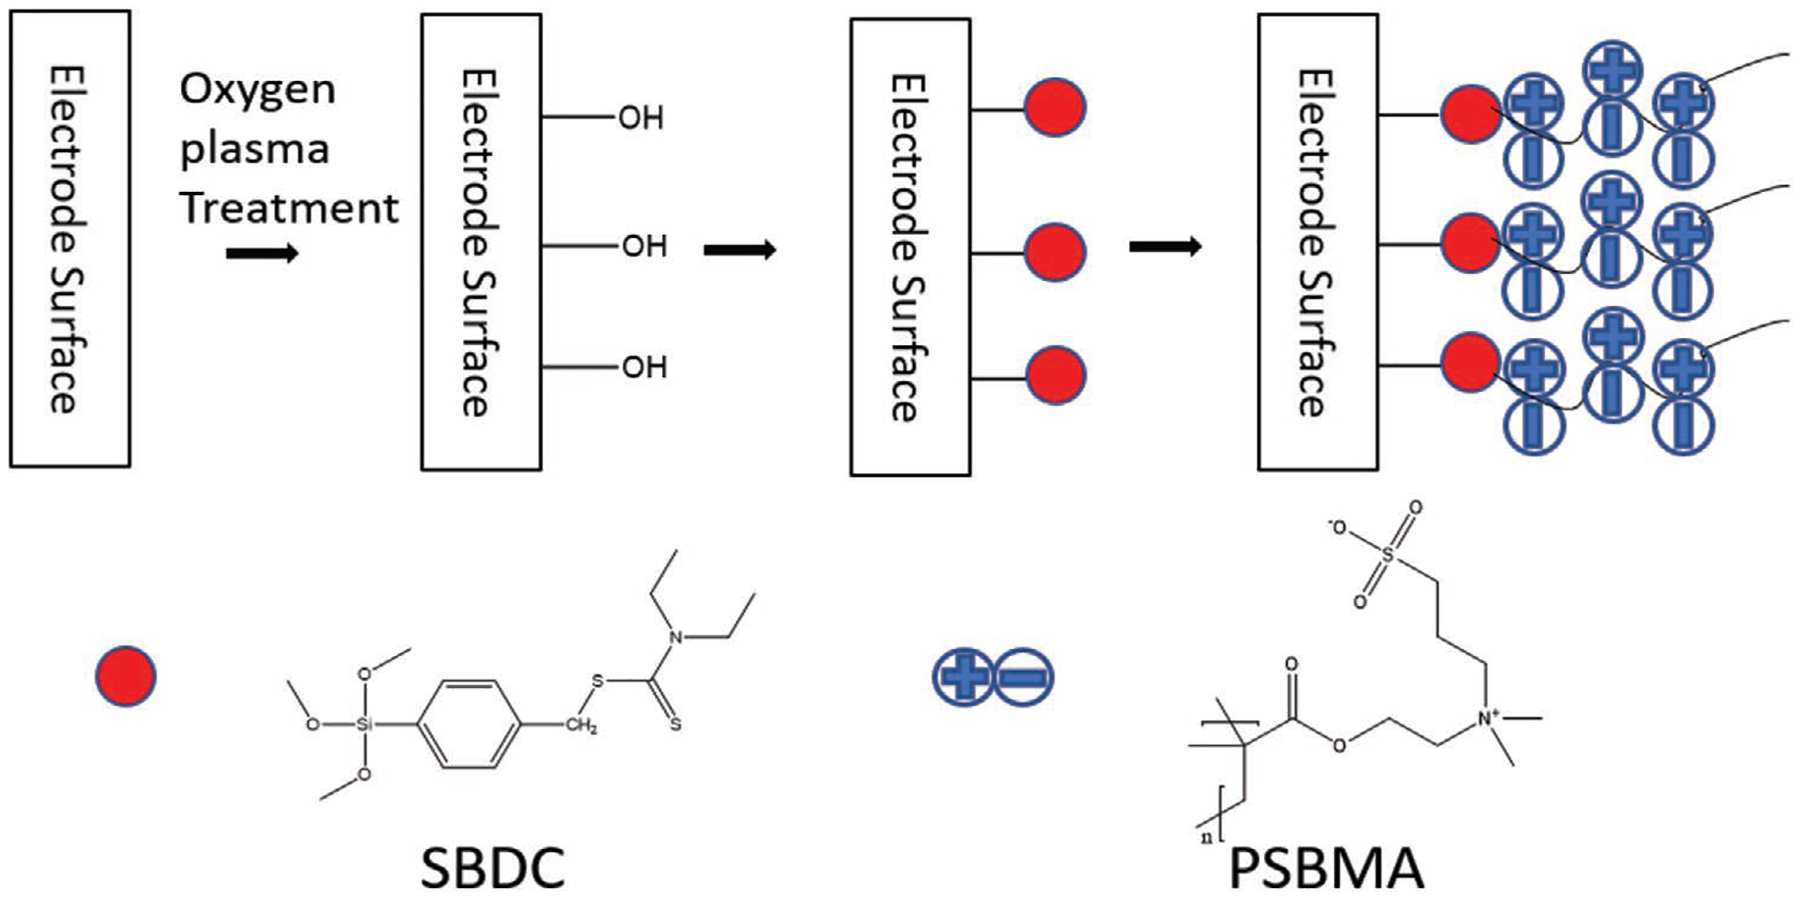
Schematic demonstration of procedures on coating zwitterionic polymer. The red circles represent SBDC, which was bonded to electrode surface through hydroxyl functional groups. The chain of plus/minus combinations represents PSBMA polymer, which is grafted to the surface through SBDC photoiniferter.
Figure 2.

PSBMA characterization and in vitro stability. a,b) XPS spectra of SBDC and PSBMA-coated surface, respectively. Peaks are labeled with corresponding elements. c) PSBMA polymer thickness tracked over 4 week period (n = 6). d) PSBMA polymer water contact angle tracked over 4 week period. PSBMA-coated Si wafers were soaked in PBS solution at room temperature (n = 4 for 1 week, n = 6 for other time points). No significant changes were observed in both experiments (one-way ANOVA, mean ± SD, p = 0.3567 and p = 0.664 respectively).
Stability of the PSBMA coating was tested by soaking PSBMA-coated silicon wafer in PBS for up to 4 weeks, which is beyond the typical initial acute inflammation time window. The polymer thickness and water contact angle (WCA) was measured at 0, 1, and 4 week time points. The average thickness of PSBMA before soaking is 1.547 ± 0.325 nm (mean ± SD). At 1 and 4 week, the average thickness is 1.598 ± 0.563 and 1.287 ± 0.178 nm respectively. No significant film thickness change was detected during the 4 week time period, p = 0.3567 (Figure 2c). The WCA measurements reflect the surface wettability changes, which supplements ellipsometry measurements to characterize the stability of the surface polymer coating. The average WCA of the PSBMA-coated wafer is 24.37° ± 4.27°, 25.40° ± 2.73°, and 23.75° ± 4.92° at 0, 1, and 4 week time points, respectively (Figure 2d). Similar to the ellipsometry results, no significant change was detected, p = 0.664.
2.2. PSBMA Coating Resists Protein Adsorption and Cell Attachment In Vitro
To test PSBMA’s ability to resist protein adsorption, bare and PSBMA-coated Si wafers were exposed to fibrinogen solution for 1h and washed with deionized (DI) water. Fibrinogen was chosen because of its high abundance in blood and high surface selectivity, both of which will lead to high probability of adsorption onto the implant surface.[64,65] Additionally, adsorbed fibrinogen may trigger the inflammatory response cascade.[66,67] Changes in thickness before and after exposure were determined using ellipsometry as a measure of the amount of protein adsorbed. Bare wafers have an average change in thickness of 3.455 ± 0.333 nm (mean ± SD) due to protein adsorption, whereas PSBMA-coated wafers have no detectable protein layer adsorbed with an average change in thickness of −0.243 ± 0.522 nm, and this difference is significant with p < 0.0001 (Figure 3a). We also characterized the adsorption of albumin, another abundant plasma protein with known neurotoxicity [68,69] on PSBMA-coated probes using fluorescence tag albumin and observed nonfouling properties of PSBMA coating (Figure S2, Supporting Information). Two types of cell line, 3T3 fibroblast cells and HAPI cells (immortalized microglia [70]) were tested on bare and PSBMA-coated wafers. The average density of fibroblast cells attached is 1061.1 ± 226.7 mm−2 and 7.4 ± 7.4 mm−2 for bare and PSBMA-coated samples (p < 0.0001), respectively. PSBMA surfaces have reduced fibroblast cell attachment by 99.3% (Figure 3b). A similar cell attachment profile was obtained with HAPI cells. The average cell density of HAPI cells on bare and PSBMA wafers are 1734.4 ± 486.8 mm−2 and 51.6 ± 62.7 mm−2, respectively. PSBMA coating significantly (p < 0.0001) reduced microglial cell attachment by 97% compared to bare Si wafer (Figure 3e). Representative immunofluorescence images of adhered cells on bare and coated surfaces are shown in Figure 3d,e for fibroblast cells and microglial cells, respectively. In both cases, almost no cell adhesion can be observed on PSBMA-coated surface. Additional cytotoxicity tests were carried out using HAPI cells. HAPIs cells were cultured on a half-coated Si wafer surface and stained with DAPI. A clear boundary between PSBMA-coated and uncoated sides was observed. Abundant cell attachment and growth is seen on the bare side and almost no cell is observed on the PSBMA-coated side. The healthy growth of cells on the bare side immediately next to the PSMA coating indicates that PSBMA is not producing cytotoxic factors and the lack of the cells on the coated side is the results of PSBMA’s ability to prevent cell attachment (Figure S3, Supporting Information).
Figure 3.

PSBMA resist protein adsorption and cell adhesion in vitro. a) Protein fouling assay using fibrinogen solution. PSBMA-coated wafers showed significantly less protein adsorption compared to bare wafers (Welch’s t-test, ****p < 0.0001, n = 10, mean ± SD). Cell adhesion tests on bare and PSBMA-coated Si wafers. b) Quantification of fibroblast cells adhesion on bare (n = 21) and PSBMA-coated surfaces (n = 28). The PSBMA-coated surface had significantly less cell attachment compared to the bare surface (Welch’s t-test ****p < 0.0001). c) Quantification of microglial cells adhesion on bare (n = 51) and PSBMA-coated surfaces (n = 57). The PSBMA-coated surface showed significantly less cell attachment compared to the bare surface. (Welch’s t-test ****p < 0.0001, mean ± SD). d,e) Representative images of d) fibroblast and e) microglial cells cultured for 24 h on bare (left) and PSBMA-coated (right) substrates, respectively. Scale bar = 60 μm. Cell nucleus was stained with DAPI (cyan).
2.3. PSBMA Coating Inhibits Immediate Microglial Encapsulation In Vivo
To investigate whether the PSBMA coating can suppress the inflammatory response of brain tissue, we implanted uncoated or PSBMA-coated silicon probes into the cortex of CX3CR1-GFP mice through a cranial window (Figure 4a). A four shank Michigan probe (nonfunctional) was inserted at a 30° angle to the horizontal plane to allow for visualization of the probe surface in the tissue (Figure 4b,d). Vasculature was imaged after intraperitoneal (IP) injection of sulforhodamine 101 (SR 101) to help spatially register the imaged area, monitor microglia, and avoid imaging under large blood vessels (Figure 4c). The dynamic activity of microglia was imaged by two-photon microscopy for up to 6 h after probe insertion.
Figure 4.

In vivo two-photon imaging setup. a) A schematic of the surgery and probe implantation in the mouse brain. A cranial window (≈4 mm × 3 mm) was created on the skull of CX3XR1-GFP mouse. A four-shank and nonfunctional Michigan style probe was inserted into the cortex. b) A side view of the imaging area. The probe was implanted at roughly a 30° angle. The water immersion objective was immersed in physiological saline. c) A summed z-stack showing the representative imaging area after probe implantation. Microglia are displayed in green, and blood vessels (SR101) in red, with the shape of probes superimposed in semitransparent blue. d) A representative side projection of the imaging area above a probe shank. The lower-left corner is dark because it is underneath the probe. Microglia are displayed in green, and blood vessels (SR101) in red.
Consistent with our previous study,[20,71] adjacent microglia started to send processes towards the implants immediately (within a minute) after the probe was inserted into the brain (Supplementary movies). PSBMA did not significantly affect the moving speed or direction of microglial processes in the observation period. For both control and PSBMA group, the average moving speed of microglial processes peaked at around 1 μm min−1 within 10 min, then decayed gradually and stabilized at around 0.3 μm min−1 after 35 min (Figure 5a). The average moving direction started at around 0.8 in the first 10–15 min for both groups, indicating that about 80% of the processes were moving toward the probe; while after ≈30 min, the curve fluctuated around 0, meaning that the processes were wandering randomly (Figure 5b). However, the PSBMA-coated probe surface areas were less encapsulated by microglia compared to noncoated probes starting from ≈10 min postimplant (Figure 5c).
Figure 5.

PSBMA coating does not affect the movement of microglial processes, but suppresses immediate microglial coverage of probe surface. a) The speed of microglial process movement towards control probes and PSBMA-coated probes is similar (Kolmogorov-Smirnov test; p = 0.0728). Data showed as mean ± SD. N = 30 processes from three animals for the control group. And N = 41 processes from four animals for the PSBMA group. Same sample size for (b). b) The average moving direction of microglial processes is similar between the control and the PSBMA-coated group (Kolmogorov-Smirnov test; p = 0.8720). Data showed as mean ± SEM. For individual processes, value 1, −1, or 0 was given when a process moved toward probe surface, away from the probe surface, or did not move at the direction perpendicular to probe surface, respectively. c) Representative images of microglial encapsulation change on probe surface after probe insertion. Upper two rows: microglial response to noncoated probes at different time points postimplant. Higher magnification views of the probe surface are shown in the lower row. Lower two rows: microglial response to PSBMA-coated probes at different time points postimplant. Higher magnification views of the probe surface are shown in the lower row. Green: CX3CR1-GFP (microglia); Red: SR101 (blood vessel). Yellow dot square: probe surface. For all images, scale bar = 20 μm.
2.4. Sustained Inhibition for Microglial Encapsulation of PSBMA Coating
The attenuation of microglial encapsulation for the zwitterionic coating was sustained for at least 6 h (Figure 6a). The microglial encapsulation percentage of probe surface was calculated based on an iterative thresholding algorithm. At both 2 and 6 h postimplantation, the microglial coverage percentage of PSBMA-coated probes was significantly lower than noncoated control probes (Figure 6b). At 2 h postimplantation, the percentage of surface covered by microglia was significantly lower (p < 0.0001) on the PSBMA-coated probes (10.67 ± 7.38%) than the noncoated control probes (35.27 ± 7.90%). And similarly at 6 h, 12.57 ± 8.15% on the PSBMA-coated probes versus 39.90 ± 14.15% on control probes (p < 0.0001). The microglial coverage on PSBMA-coated probes was reduced by 69.7% at 2 h and 68.5% at 6 h compared to the control probes, showing that the PSBMA coating strongly inhibited microglial attachment. There were no statistical differences between the 2 and 6 h for the same type of surface, indicating that the microglial encapsulation was relatively stable during 2 to 6 h postimplantation. To check how far away from the electrode surface microglia was affected, we plotted the microglial signal change over the distance to the probe surface in a 3D stack above the probe surface (Figure 6a). Consistent with the probe surface coverage, the side projection also showed less microglial signal near the probe surface with PSBMA coating compared to control probes. The difference was significant within ≈7 μm above the probe surface (p < 0.01), while not significant for beyond (Figure 6c).
Figure 6.

PSBMA coating suppresses microglial coverage of probe surface for hours. a) Z-projections of 20 μm stacks on the probe surface and side projections of z-stacks above non-coated probes or PSBMA-coated probes at 6 h postimplant. Scale bar = 20 μm. b) The percentage of probe surface covered by microglia is significantly less for PSBMA-coated probes compared to noncoated control probes (Two-way ANOVA and Tukey’s post-hoc tests; ****p < 0.0001 for both 2 and 6 h). No significant differences within the same probe surface at different time points. Data showed as mean ± SD. N = 9 probe shanks from four animals for the control groups. And N = 9 probe shanks from five animals for the PSBMA groups. c) The microglial signal density in ≈7 μm above probes’ surface is significantly lower for PSBMA coated probes. (Two-way ANOVA and Sidak’s multiple comparisons test. Pink shaded region: **p < 0.01). Data showed as mean ± SD. N = 8 probe shanks from four animals for the control group. And N = 7 probe shanks from five animals for the PSBMA group.
2.5. PSBMA Coating Reduces the Size but not the Number of Microglial End Feet on Probe Surface
In order to further investigate how the zwitterionic coating inhibits microglial coverage, we looked into the characteristics of microglial end-feet on the probe surface. We asked whether zwitterionic coating suppresses microglial encapsulation by reducing the number of microglial end-feet attached to the surface or by inhibiting the end-feet spreading. To answer this question, we quantified the density (number per area) and the surface coverage area of each individual microglial end-feet on probe surface with ImageJ (Figure 7a), and the volume of the microglial end-feet near the probe surface by Imaris software. Interestingly, zwitterionic coated probes significantly reduced the surface area and the volume of microglial end-feet on probe surface (Figure 7c,e), but did not show significant effect on the number of end-feet per area (Figure 7b). When looking at the distribution of the area of individual end feet, the zwitterionic coating group had a greater fraction of smaller microglial end-feet (coverage < 20 μm2) and lower fraction of larger end-feet (coverage between 20 and 90 μm2) than control (Figure 7d). Similarly, a greater fraction of smaller end-feet volume (<400 μm3) and reduced fraction of larger end-feet volume (400–1400 μm3) were found on coated probes compared to control probes (Figure 7f). In summary, reduction in the size but not the density of microglial end feet suggests that the zwitterionic coating attenuated the spreading of microglial end feet, but did not affect the polarization or migration of microglial processes towards the probe immediately after implantation.
Figure 7.

Zwitterionic coating decreases the size of microglial end-feet on probe surface but not the density (number per area). a) Microglial end-feet identification on probe surface using ImageJ at 6 h postimplant. Microglial cell bodies are excluded (red arrows). b) The density of microglial end-feet had no significant difference between PSBMA-coated and control probes (Mann-Whitney test; p = 0.1738). Data showed as mean ± SD. N = 9 probe shanks from four animals for the control group, and N = 7 probe shanks from five animals for the PSBMA group. The same sample size for (c). c) The average surface coverage of individual microglial end-feet on PSBMA-coated probes was significantly smaller than the control probes (Mann-Whitney test; p = 0.0003). Data showed as mean ± SD. d) Relative frequency distribution of the surface coverage area of microglial end-feet on probe surface. Coated surface had higher fraction of smaller end-feet area and lower fraction of larger end feet areas than control. e) The average volume of individual microglial end feet on PSBMA-coated probes was significantly smaller than the control probes (Mann-Whitney test; p = 0.0087). Data showed as mean ± SD. N = 6 probe shanks from four animals for the control group, and N = 6 probe shanks from five animals for the PSBMA group. f) Relative frequency distribution of the volume of microglial end feet. Coated surface had higher fraction of smaller end-feet volumes and lower fraction of larger end-feet volumes than control.
3. Discussion
In summary, we developed a novel strategy for the synthesis of a zwitterionic coating on silicon-based neural electrodes and demonstrated its antifouling performance compared to uncoated devices in both in vitro and in vivo models of neural electrode implants.
3.1. Stability of PSBMA Coating
From in vitro tests, we demonstrated that the PSBMA coating resists protein absorption as well as fibroblast and microglial cell attachment. These in vitro nonfouling results are consistent with other PSBMA surfaces reported in the literature for non-neural devices.[72–74] Importantly, the PSBMA coating is stable for at least 4 weeks. This stands as an improvement from our previous study, where we use catechol groups to deposit PSBMA on the same silicon surface and found the coating to be unstable after 1 week.[62] The covalent linkage of photo iniferter to substrate surface and the subsequent PSBMA grafting provided a more stable film than the adhesive catechol-based coating method, which utilizes primarily hydrogen bonds and coordination bonds that are weaker in comparison to covalent bonds.[63,75,76]
3.2. Advantages of Zwitterionic Coating
Previous works have attempted other hydrophilic coatings such as poly(ethylene glycol) (PEG) based antifouling coating on neural electrodes with limited success.[77,78] Lee et al. utilized dip-coated PEG and did not see any significant reduction of foreign body response on PEG-coated electrode. This is possibly due to dip-coated coating and the high-swelling properties of PEG that increased the thickness of electrode shank compare to noncoated electrode.[78] The electrode used in this study is only 15 μm thick and the thickness of PEG coating reached a maximum of 46.05 ± 4.86 μm (mean ± SEM), which is almost three times thicker than the probe, significantly increasing the probe footprint. Gutowski et al. used microgel coating around 60 nm thick, which is made of poly(N-isopropylacrylamide), acrylic acid cross-linked, and PEG copolymer particles.[77] They did not observe any reduced inflammation response possibly due to the rough surface created by the coating that escalates initial implantation damage and the collapsing of particles causing elevated phagocytotic activity in effort to clear the particles. There is an emerging body of literature reporting the undesirable presence of both pre-existing and treatment-induced antibodies that specifically recognize and bind to PEG.49 Such antibody binding may elicit adaptive immune response. PEG has also been reported to have undesired degradation in vivo through Fenton reaction mechanism and causing inflammatory tissue response.[79,80] In contrast to above mentioned disadvantage of PEG, our method produced zwitterionic PSBMA coating around 1.5 nm thick that minimally changes the device’s footprint. There are also opportunities for PSBMA–zwitterionic polymers to be an excellent stealth coating for delivering a range of protein therapeutics and without eliciting observable immune response.[81,82]
3.3. Advantages of Photopolymerization
The surface-initiated photopolymerization method reported in this work can be easily adapted to current commercially available state of art silicon-based microelectrode devices with minimum modification to electrode designs. Previous research has demonstrated that surface properties of neural electrodes can modulate neural tissue inflammation response.[83,84] The photopolymerization method reported here can also be patterned using microfabrication techniques to spatially tune surface properties of neural electrodes. The surface immobilized SBDC iniferter also enables living polymerization, a form of chain growth polymerization in which chain transfer and chain termination are not present, for block copolymer synthesis making it possible to produce block copolymers with both antifouling and bioactive blocks. By modulating the block length, one can optimize the surface properties of devices for desired tissue response.
3.4. In Vivo Microglial Responses toward PSBMA-Coated Implants
Microglia, the resident macrophages in the brain, was evaluated in this study due to their rapid activation to injury. Prior to insult, these microglia actively survey the surrounding environment by moving their branchy processes back and forth.[85] Once recognizing a injurious stimulus, microglia react immediately by sending their processes toward the injury site.[32,86] These microglia later transform to amoeboid-like morphology,[25,87] phagocytose pathogens and cell debris, and recruit more immune cells.[88,89] Similar to our previous work,[71] we observed that microglia polarized and sent processes toward the implants several minutes after probe insertion, regardless of surface chemistry. As expected, this suggests that zwitterionic coating has little impact on the initial extension of microglial processes because the initial microglial polarization is not triggered by the surface chemistry of the implant, but by mechanical stress and/or soluble molecules released by damaged cells and blood-brain barrier (BBB) leakage.[90] For example chemokines, such as CCL2, CCL21, and CX3CL1, have been reported to play an important role in regulating microglial activation and migration after neuronal injury in various studies.[91–93] Also ATP released from damaged cells in the parenchyma are known to quickly recruit microglia through purinergic receptors.[86,94] In addition, cultured microglia have demonstrated sensitivity to stiffness gradients.[95]
Although the coating does not impact the initial microglial process polarization, the PSBMA-coated probes reduced microglial encapsulation as early as several minutes after probe insertion. At 6 h postimplantation, the percentage of surface area covered by microglia on PSBMA coating (12.57 ± 8.15%, mean ± SD) was significantly less than control (39.90 ± 14.15%, mean ± SD), about 68.5% reduction (p < 0.0001) (Figure 6b). In our previous neuroadhesive protein L1 coating study,[71] the microglial surface coverage was 35.8 ± 6.9% for the control (mean ± SEM) and 6.2 ± 2.4% (mean ± SEM) for the L1 coated surface at 6 h postimplant, about 82.7% reduction. PSBMA coating seems slightly less effective in attenuating microglial coverage, which could be attributed to the bioactive properties of the L1 cell adhesion molecule (L1CAM) protein compared to the passive zwitterionic coating. Interestingly, L1 is rather hydrophobic, with a water contact angle of 69.8 ± 1.7°,[96] while PSBMA is highly hydrophilic, with a water contact angle of 24.367 ± 4.268° measured here. Therefore, it is important to consider how different hydrophilicity leads to interaction with different molecules and the bioactivity of those molecules. The optimal hydrophilicity for a healthy brain–device interface remains to be investigated. In addition, L1CAM is a bioactive molecule that attract neuron adhesion through L1–L1 homophilic binding,[97,98] and potentially inhibit microglial activation through heterophilic interactions with β1 integrin,[99,100] while there is no evidence that PSBMA directly interacts with any cell surface receptors.
3.5. Mechanisms of Reduced Microglial Encapsulation by the PSBMA Coating
To investigate the mechanism by which the PSBMA coating reduce microglial encapsulation, we conducted more detailed characterizations of the microglial end-feet on the probe surface. We postulated that the surface coverage decline was either due to smaller microglial end-feet or a reduction in the number of processes attached to the probe surface, or both. Our results revealed that the size of the microglial end-feet was significantly reduced (p = 0.0003 for surface coverage area and p = 0.0087 for the volume, Figure 7c,e) on PSBMA coating but not the number/area (p = 0.1738, Figure 7b), suggesting that the zwitterionic coating suppressed immediate microglial encapsulation mainly by inhibiting the expansion of microglial end feet into lamellipodia without affecting the number of microglial processes. While the molecular mechanisms of microglial end-feet dynamics are not well understood, the extension of microglial processes toward neural implants have great similarities in morphology and time course with the directional motility of microglial processes after laser ablation or ATP release.[86,101] Thus, it is probable that they share some mechanisms, such as sensitive to ATP gradients. Since the mechanism that triggers process extension is expected to be similar, it is expected that the number of processes sent by each microglia is also similar. Therefore, it stands to reason that the surface chemistry of probe would not dramatically affect the number of microglia in the proximity or the number of processes reached out by each microglia. However, once the end feet touch the zwitterionic coating, the surface chemistry played a significant role in reducing the activation of the end feet into lamellipodia sheaths (p = 0.0003, Figure 7c). There are two major significant findings from the end feet quantification results. First of all, the end-feet measurement validated the antifouling properties of the zwitterionic coating in vivo, and provides implications on the mechanisms of the coating in affecting host tissue responses. The reduction on the spreading of microglial end feet on the PSBMA-coated probe surface suggests less surface adsorbed plasma proteins for cells to bind, which corroborates our in vitro results of reduced protein adsorption and cell attachment. Second, this is the first time that microglia end feet spreading on implant surface is quantified in vivo in real time. In the biomaterial literature, the spreading of macrophages or monocytes have been commonly used to access the potential of a surface to be pro or anti-inflammatory.[102,103] Larger spreading indicates more bindings between the cell surface receptors, integrin being a major player, with the proteins adsorbed on the surface. Such binding can trigger a number of intracellular events that activate the cells to undergo inflammatory responses.[104] Following similar mechanisms, we think the size of microglial end-feet and the overall coverage on the probe surface may provide a physiologically meaningful predictor for reduced microglial response over longer term. In the central nervous system, inflammatory response to implants starts with microglial process polarization and lamellipodia attachment and spreading on the implant surface, followed by microglial cell body enlargement, migration, proliferation, and secretion of signal molecules that recruit other immune cells. Just like macrophages, each of these responses may be initiated by interactions between microglia cell surface receptors and their binding ligands. The ligands can be from other cells, extracellular matrix (ECM) or plasma proteins that leaked out from the vasculature due to injury. For example, it has been shown that plasma proteins such as fibrinogen can bind with microglial integrin receptors, which triggers the downstream microglia activation and clustering.[30] Combining in vitro and in vivo results, it can be inferred that our zwitterionic coating effectively suppresses the end-feet spreading by inhibiting ligand molecule adsorption on the surface. Reduced spreading indicates less cell-surface interaction, which may decrease the downstream inflammatory responses. Results from recent studies of neural implant surface modification and microglia response support this hypothesis. For example, another antifouling coating made of PSBMA and poly dopamine composite has been shown to reduce glial reaction around coated probes 1 week postimplantation in mice.[62] In addition, a neuroadhesive protein L1 coating was found to reduce the initial microglial surface coverage at 2 and 6 h postimplant,[71] and the same coating elicited significantly less chronic inflammatory gliosis after 1, 4, and 8 weeks.[96,105]
3.6. Limitations and Future Directions
In this study, we demonstrate that the PSBMA coating can limit the short-term encapsulation of intracortical implants without using bioactive protein molecules. Although the thickness and antifouling effect of PSBMA coating were stable in vitro for 4 weeks, the chronic demonstration of the chemical and mechanical stability in vivo remains to be evaluated. A longer stability test would provide vital information on the longevity of the coating for longer-term applications. Also, some confounding effects under chronic in vivo conditions such as neural probes insulation failure due to mechanical stress, and material degradation due to reactive oxygen and nitrogen species or pH fluctuation as a result of inflammatory responses,[106–109] could also contribute to coating degradation,[110,111] Thus, future coating stability should also be evaluated with conditions better mimicking these situations.[109] While the PSBMA coating attenuated microglia encapsulation of the probe surface over the first 6 h after implantation, future studies will investigate whether the attenuated immediate microglial encapsulation will actually lead to reduced microglial recruitment and amoeboid activation in the following hours to days, and eventually result in an improved long-term inflammatory tissue response. Future experiments will focus on characterizing the performance of PSBMA coating over chronic time points. Over the chronic periods, it is also important to consider the contributions of different types of CX3CR1+ cells (resident microglia, peripheral macrophage, neutrophils etc.) or different microglial subtypes.[112] Specific cell markers or more careful morphological analysis will be necessary to distinguish these different cell types. Furthermore, there are many other types of cells involved in the inflammatory response, such as astrocytes, oligodendrocytes, and infused peripheral macrophages that can impact the performance of neural interfaces.[26,113–117] Finally, due to the lack of a clear causal link between tissue reaction and decay of electrophysiological signals,[118–121] it is important to investigate whether the PSBMA coating can improve electrophysiological recording performance by testing the coatings in vivo on functional electrodes. Combining chronic imaging and recording with functional electrodes will provide a more comprehensive understanding of the effects of zwitterionic coating on tissue responses and its benefits on neural electrode technology.
4. Conclusion
In short, we first demonstrated that the photoinifertor based grafting method produced a PSBMA coating that is stable for at least 4 weeks in vitro and potent at inhibiting protein adsorption and cell attachment. Then using in vivo two-photon microscopy, we observed that the acute microglial encapsulation was reduced on PSBMA-coated neural implants, and this reduction was resulted from a decrease in the size of microglial end-feet. This work indicates that zwitterionic coating is a promising application for neural implants to alleviate acute microglial encapsulation and has the potential to improve the tissue integration of implanted neural devices.
5. Experimental Section
Materials:
Silicon wafers were purchased from University Wafer (4 in diameter, 1000 Å wet thermal oxide). All in vivo tests used nonfunctional 16-channel Michigan-style silicon probes with 15 μm in thickness, 3 mm in length, and 30–55 μm in the width of the near-tip region, purchased from NeuroNexus (TrainingKit-CM). Anhydrous tetrahydrofuran(THF), [2-(methacryloyloxy) ethyl]-dimethyl-(3-sulfopropyl) ammonium hydroxide 97% (SBMA), p-(chloromethyl)phenyltrimethoxysilane were purchased through Sigma. Anhydrous methanol (MeOH) and diethylammonium diethyldithiocarbamate were purchased from Fisher. All materials were used as purchased without further purification.
Synthesis of N,N-(Diethylamino) dithiocarbamoyl-Benzyl (trimethoxy silane):
SBDC was synthesized using an optimized protocol similar to previous reported method.[63] In brief, 1.65 g (6mmol) of p-(chloromethyl) phenyltrimethoxysilane (1) and 1.334 g (6 mmol) of diethylammonium diethyldithiocarbamate (2) were dissolved in 10 mL of dry THF separately. Solution of (2) was then slowly added into (1). The solution was stirred for 3 h at room temperature. After filtration and THF evaporation, the product SBDC (3) was obtained as light-yellow viscous liquid (g, yield). Product was kept cool and in dark. (1H NMR, (CD3Cl, 40MHz), δ ppm 7.598(2H, d, J = 7.6Hz), 7.419(2H, d, J = 7.6 Hz), 4.558(2H, s), 4.045(4H, d, J = 7.2 Hz), 3.615(9H, s), 1.281(4H, t, J = 6.8 Hz).
Surface Modification and Polymer Grafting:
Silicon wafers/dummy probes were first rinsed with anhydrous MeOH for three times and air dried for 15 min. After which, all samples were exposed to O2 plasma for 5 min and then immediately immersed in 4 mL of SBDC (2 mg mL−1, 5 × 10⁻³ m) anhydrous MeOH solution, sealed and covered with aluminum foil, and left overnight. The next day, probes/wafers were rinsed with anhydrous MeOH for three times, kept in Petri-dish, air dried, and covered with foil before use. 4 mL of PBS solution was prepared in a quartz tube, sealed and degassed with N2 for 30 min. Meanwhile, 1 g of SBMA monomer was prepared in a test tube and the powder was vacuumed for 15 min then purged with N2 gas, repeated three times. Degassed PBS solution was then transferred with a syringe and needle into SBMA containing tube, then well mixed SBMA PBS solution was transferred back to quartz tube. Wafers/probes were then lowered into SBMA solution under N2 flow. The apparatus was then sealed and placed under the UV lamp (100 w, Standard filter (320–500 nm), Series 1000 Omni Cure) for 2 h under 35% power output setting. The distance between light source and substrate was 1.5 cm and area covered by light was 63.17cm2. For probe coating, the quartz tube was rotated 180° every half hour to ensure a uniform polymer growth. After polymerization, probes were rinsed with DI water, dried under N2, covered with aluminum foil and stored at room temperature before surgery.
XPS Spectra Analysis:
XPS measurements were performed using Surface Science Instruments X-Probe spectrometers to investigate the surface composition of the PSBMA film. The ESCALAB 250Xi XPS spectrometer microprobe (Thermo Fisher Scientific, MA, USA) with an Al Kα X-ray source (1486.71 eV of photons) was used. The pressure in the analysis chamber was maintained at about 8 × 10⁻⁷ Pa during each measurement. The survey spectra (from 0 to1400 eV) and the core-level spectra with higher resolution were both collected. An ion gun was used to compensate for surface charge effects. The software Thermo ScientificTM Avantage Data system was used to fit the XPS spectra peaks.
Ellipsometer and Water Contact Angle Measurement:
All PSBMA-coated wafers were rinsed with DI-water and dried under N2 flow. The thickness of the polymer film was measured using an ellipsometer (J. A. Woollam α-SE) and data was fitter with Cauchy Model using refractive index of 1.45. Water contact angles were measured using AST Products VCA Optima. Then all samples were immersed in PBS solution for 4 weeks. At week 1 and week 4, all samples were pulled out, rinsed with DI-water, dried under N2 flow, and subjected to ellipsometry and water contact angle measurements.
Protein Adsorption Assay:
All samples were rinsed with DI-water, dried under N2 flow. The thickness of polymer films was determined using ellipsometer (J. A. Woollam α-SE), then soaked into fibrinogen (1 mg mL−1) PBS solution for 30 min. Then, all samples were rinsed with DI water and dried under N2. Postsoaking thicknesses were measured and initial polymer thickness were subtracted from the measurement to get a final value of protein absorption. Bare silicon wafers were used as control group.
Cell Adhesion Assay:
All samples were dried under N2, sterilized under UV for 20 min, and placed into 24-wells plates before culturing cells. 3T3 fibroblast cells (NIH/3T3 (ATCC CRL-1658) fibroblast, within 20 passages) or HAPI cells (generous gift from Dr. Xiaoming Hu, Department of Neurology, University of Pittsburgh, 5th passage) were plated on top of substrate surface with a cell density of 25k cells cm−2 then supplemented with 500 mL of culture medium—DMEM/F-12, HEPES medium (Gibco) supplemented with 10% fetal bovine serum (FBS) (Gibco) and 1% PenStrep (Life Technologies). All samples were incubated for 24 h at 37 °C, then fixed with 4% paraformaldehyde, stained with DAPI (1:1000 in PBS, incubated for 10 min), and subjected to fluorescence imaging (Leica, DMI 4000B microscope with DFC 350 FX camera).
Animal and Surgery:
Probe implantation surgeries were conducted on 10 CX3CR1-GFP mice in total (B6.129P2(Cg)-Cx3cr1tm1Litt/J purchased from The Jackson Laboratory). Five of them received PSBMA-coated probe implantation, and the other five were implanted with noncoated probe. Under the control of CX3CR1 promoter, these mice expressed EGFP in brain microglia and peripheral leukocytes such as monocytes, dendritic cells, and NK cells. Since in the brain, CX3CR1 is almost exclusively expressed in microglia, and few peripheral leukocytes can migrate to the probe inserted area within 6 hours, all the fluorescent signals inside the brain were considered coming from microglia. All the mice were male and aged 8–20 weeks at the time of surgery. The probe implantation surgery was similar to the previous studies. [42,71] A ketamine(75 mg kg−1)/xylazine(10 mg kg−1) mixture in saline was injected intraperitoneally (IP) to induce anesthesia in each animal. To maintain the anesthesia state, updates of ketamine(22.5 mg kg−1) were administered when animals started showing toe-pinch response, whiskers twitching, and obvious increased respiratory rate. The body temperature of the animal was kept at around 37 °C with an electric heating pad. The animals were shaved using electric hair clipper, then had their head fixed on a stereotaxic frame. After three times cleaning with 70% isopropyl alcohol, scalps from the middle of two eyes to cerebellum were resected to expose the skull. Excess soft tissues on the skull were removed, then a 1–3 mm tall well with around 1.2 cm diameter was built by repeated application of light-curable dental cement on the dried skull. This well was intended to hold a saline immersion for microscopic objective later. Inside the well, a ≈4 × 3 mm cranial window was performed on one hemisphere of the skull with high speed dental drill, roughly over the somatosensory cortex. The exposed brain surface was covered and gently petted with saline rinsed gel form to help stop bleeding and remove bone debris. The animal was then transferred under two-photon microscope. For vasculature visualization, animals were IP injected with sulforhodamine 101 (SR101) (≈0.05 cc; 1 mg mL−1) before imaging and updated with the same dose every 1–2 h. The probe was placed at 30–35° to the horizontal plane and inserted for 600 μm into the brain at a speed of 200 μm s−1 by a stereotaxic manipulator. All experimental protocols were approved by the University of Pittsburgh, Division of Laboratory Animal Resources and Institutional Animal Care and Use Committee in accordance with the standards for humane animal care as set by the Animal Welfare Act and the National Institutes of Health Guide for the Care and Use of Laboratory Animals.
In Vivo Two-Photon Imaging:
The two-photon imaging system was previously described.[42,71] Basically it consists of a scan head (Prairie Technologies, Madison, WI), a OPO laser (Insight DS+; Spectra-Physics, Menlo Park, CA) tuned at 920 nm wavelength, a nondescanned photomultiplier tubes (Hamamatsu Photonics KK, Hamamatsu, Shizuoka, Japan) for signal detection, and a 16×, 0.8 numerical aperture water immersion objective (Nikon Inc. Milville, NY). Prairie View software was used to collect all the images. 411.6 × 411.6 × 24 μm3 z-stack images were scanned every minute from 1 min prior insertion to 50 min after probe insertion. At 2 h to 6 h postimplantation, z-stack images were taken from the brain surface to the most visible depth (≈300 μm) once per hour. Stack of images covered a view of 411.6 × 411.6 μm2 at 0.4 × 0.4 μm (1024 × 1024 pixel) resolution in X–Y plane, and 2 μm step size in Z direction. Laser power was kept under 40 mV to avoid thermal damage to the tissue.
Statistical Analysis—In Vitro Tests:
GraphPad Prism software was used to analyze in vitro data. Ellipsometry (n = 6) and water contact angle measurements (n = 4, for 1 week, n = 6 for remaining time point) were analyzed by one-way ANOVA with Bonferroni post-hoc test. P < 0.05 deemed significant. Protein adsorption (five sample, two measurements per sample, n = 10) and cell adhesion (3T3 cell, three samples, seven photos each sample, n = 21 for control, and four samples, seven photos, n = 28 for PSBMA coated sample. HAPI cell, two replicates, six samples, nine photos each sample, three photos excluded due to poor counting quality, n = 51 for control and seven samples, nine photos, six photos excluded due to poor counting quality, n = 57 for PSBMA coated samples) data were analyzed using two-tailed Welch’s t test. p < 0.05 deemed significant. Cell counting was done in ImageJ, the photos were first converted into 8 bits, then auto threshold, and counted with particle analyzer tool. Data are all presented in mean ± SD, unless specified otherwise.
Analysis of Microglial Processes Movement:
ImageJ software was used for analysis of microglial processes moving speed and direction. First, the tissue drifting artifacts in ZT-images were corrected with “Correct 3D drift” function in ImageJ.[122] After that, the 24 μm thick z-stack was summed to a single 2D image at every time point, and the position of microglial end feet was tracked manually using “measure” function in ImageJ. The moving speed of microglial processes was calculated based on the XY coordinates of microglial end-feet at different time points. The moving direction was determined by a sign-function as following, so that outcome 1 represented coming closer to probe surface, outcome −1 represented moving away from probe surface, and outcome 0 represented that the distance to probe surface remained the same.
where Δd is the change of the distance between the probe surface and the microglial process end foot.
In total 30 processes from three animals for the control group and 41 processes from four animals for the PSBMA group were analyzed. One animal from control group and one animal from PSBMA group were disregarded because of large motion artifacts or blurry images.
Analysis of Microglial Coverage and Microglial Signal Change over Distance:
ImageJ software was used for the microglial coverage and microglial signal intensity over distance analysis. Due to the 30–35° insertion angle of probe, stacks of images were first rotated using the “Interactive stack rotation” plugin to visualize the probe surface at a single plane. Usually the probes were inserted along the X axes, thus rotations were mainly along the Y axes. A 20 μm stack of images above the probe surface was picked out by “make substack” function. After cropping out the dark edge caused by digital rotation, the stack was summed with “Z project” function in ImageJ. To reduce the effect of noise level variation, an iterative-thresholding strategy was adopted. The threshold was first set at mean + SD from the “Histogram” of the whole 20 μm stack summed image. Signals below this threshold was considered as noise, and a second threshold was defined based on the mean and SD of the noise (mean + 3*SD here). The probe surface outline was determined by checking the shadow of the probe from the whole stack images. And because of the CX3CR1+ peripheral leukocytes in the meningeal layer, probe surface within 30–50 μm from the brain surface was excluded. The percentage of area that possessed a signal intensity above the second threshold over the probe surface area was calculated and used as microglial coverage for each probe shank. The percentage of coverage decrease between PSBMA and control was calculated by dividing the percentage difference by the coverage percentage of control probes. In total, nine noncoated probe shanks from four animals and seven PSBMA-coated probe shanks from five animals were analyzed. These numbers were different from the total number of shanks because the imaging window allowed for visualization of only two to three shanks at a time, and some shanks happened to be underneath many blood vessels or became less visible due to bleeding, thus were excluded from analysis. One animal with noncoated probe implantation was found having microglia with fragmented morphology probably caused by severe craniotomy damage, thus was excluded from all the analysis. The statistical differences were examined by two-way ANOVA and Tukey’s posthoc tests with p < 0.05 deemed significant.
For microglial signal over distance analysis, stack of images after rotation to the probe surface plane were used. Images were further rotated along Z axes with “Rotate” function to align the shank of probe to X axes. The region of interest (ROI) was selected just cover the probe surface. The stack was then projected to X–Z plane using the “3D project” function with linear interpolation. A binary mask was set at default threshold to detect signals from microglia. From the projection image at X–Z plane, a rectangle (≈50 μm × 100 μm) with probe surface at the long edge was selected, the ratio of area occupied by microglial signal were calculated and plotted over distance to the probe surface. In total eight noncoated probe surfaces from four animals and seven PSBMA-coated probe surface from five animals were analyzed. One sample of control probe shank was excluded because the probe surface was too close to the brain surface. Two-way ANOVA and Sidak’s multiple comparisons test were used to examine if the PSBMA group is significantly different from the control group at every sampled distance.
Characterizations of Microglial End Feet:
ImageJ software was used for the density and surface coverage area of microglial end-feet analysis. Similar to previous analysis, stack of images after rotation to align with the probe surface plane were used. Eight micrometer thick stacks of images on the probe surface were characterized instead of 20 μm here because based on our observation, microglial end-feet that touched the probe mostly localized within 8 μm above probe surface. Microglial end-feet were detected by “Analyze particles” function of ImageJ, which was based on autothresholding. Microglial cell bodies were excluded from the analysis based on the morphology and the stronger expression of CX3CR1-EGFP in the soma. The density of microglial end feet was calculated by dividing the total number of recognized particles by the area of the ROI. The statistical differences between control and coated probes were examined by two-tailed Mann-Whitney test with p < 0.05 deemed significant.
Imaris 9.3.0 software (Bitplane) was used for the volume characterization of microglial end feet. A ≈411.6 × 411.6 × 20 μm (xyz) stack of images above the probe surface was imported to the software, and microglial end feet on the probe surface were detected using Imaris “surface” tool based on automatic threshold. The areas of microglial cell bodies were deleted manually afterwards. The statistical differences between control and coated probes were examined by two-tailed t test (Mann-Whitney test).
Supplementary Material
Acknowledgements
This research was financially supported by the NIH R01NS062019, R01NS089688 and R21DA043817. The authors thank Dr. Bin Cao for the help in developing the coating protocol.
Footnotes
Supporting Information
Supporting Information is available from the Wiley Online Library or from the author.
Conflict of Interest
The authors declare no conflict of interest.
Contributor Information
Qianru Yang, Biomedical Science Tower 3, University of Pittsburgh, 3501 Fifth Ave, Pittsburgh, PA 15232, USA.
Bingchen Wu, Biomedical Science Tower 3, University of Pittsburgh, 3501 Fifth Ave, Pittsburgh, PA 15232, USA.
James R. Eles, Biomedical Science Tower 3, University of Pittsburgh, 3501 Fifth Ave, Pittsburgh, PA 15232, USA
Alberto L. Vazquez, McGowan Institute for Regenerative Medicine, University of Pittsburgh, 3025 East Carson Street, Pittsburgh, PA 15219, USA
Takashi D. Y. Kozai, Center for Biotechnology and Bioengineering, University of Pittsburgh, 300 Technology Dr, Pittsburgh, PA 15213, USA
X. Tracy Cui, Biomedical Science Tower 3, University of Pittsburgh, 3501 Fifth Ave, Pittsburgh, PA 15232, USA.
References
- [1].Schwartz AB, Cui XT, Weber DJ, Moran DW, Neuron 2006, 52, 205. [DOI] [PubMed] [Google Scholar]
- [2].Hatsopoulos NG, Donoghue JP, Annu. Rev. Neurosci 2009, 32, 249. [DOI] [PMC free article] [PubMed] [Google Scholar]
- [3].Santhanam G, Ryu SI, Yu BM, Afshar A, Shenoy KV, Nature 2006, 442, 195. [DOI] [PubMed] [Google Scholar]
- [4].Vansteensel MJ, Pels EGM, Bleichner MG, Branco MP, Denison T, Freudenburg ZV, Gosselaar P, Leinders S, Ottens TH, Van Den Boom MA, Van Rijen PC, Aarnoutse EJ, Ramsey NF, N. Engl. J. Med 2016, 375, 2060. [DOI] [PMC free article] [PubMed] [Google Scholar]
- [5].Wolpaw JR, McFarland DJ, Proc. Natl. Acad. Sci. USA 2004, 101, 17849. [DOI] [PMC free article] [PubMed] [Google Scholar]
- [6].Taylor DM, Tillery SIH, Schwartz AB, Science 2002, 296, 1829. [DOI] [PubMed] [Google Scholar]
- [7].Iordanova B, Vazquez AL, Kozai TDY, Fukuda M, Kim SG, J. Cereb. Blood Flow Metab 2018, 38, 627. [DOI] [PMC free article] [PubMed] [Google Scholar]
- [8].Michelson NJ, Kozai TDY, J Neurophysiol. 2018. [DOI] [PMC free article] [PubMed] [Google Scholar]
- [9].Michelson NJ, Eles JR, Vazquez AL, Ludwig KA, Kozai TDY, J. Neurosci. Res 2019, 97, 620. [DOI] [PMC free article] [PubMed] [Google Scholar]
- [10].Kozai TDY, Du Z, Gugel ZV, Smith MA, Chase SM, Bodily LM, Caparosa EM, Friedlander RM, Cui XT, J. Neurosci. Methods 2015, 242, 15. [DOI] [PMC free article] [PubMed] [Google Scholar]
- [11].Stocking KC, Vazquez AL, Kozai TDY, IEEE Trans Biomed. Eng 2019, 66, 2402. [DOI] [PubMed] [Google Scholar]
- [12].Wellman SM, Eles JR, Ludwig KA, Seymour JP, Michelson NJ, McFadden WE, Vazquez AL, Kozai TD, Adv. Funct. Mater 2018, 28, 1701269. [DOI] [PMC free article] [PubMed] [Google Scholar]
- [13].Collinger JL, Wodlinger B, Downey JE, Wang W, Tyler-Kabara EC, Weber DJ, McMorland AJ, Velliste M, Boninger ML, Schwartz AB, Lancet 2013, 381, 557. [DOI] [PMC free article] [PubMed] [Google Scholar]
- [14].Hochberg LR, Bacher D, Jarosiewicz B, Masse NY, Simeral JD, Vogel J, Haddadin S, Liu J, Cash SS, van der Smagt P, Donoghue JP, Nature 2012, 485, 372. [DOI] [PMC free article] [PubMed] [Google Scholar]
- [15].Grahn PJ, Mallory GW, Berry BM, Hachmann JT, Lobel DA, Lujan JL, Front. Neurosci 2014, 8, 296. [DOI] [PMC free article] [PubMed] [Google Scholar]
- [16].Davis TS, Wark HA, Hutchinson DT, Warren DJ, O’Neill K, Scheinblum T, Clark GA, Normann RA, Greger B, J. Neural Eng 2016, 13, 036001. [DOI] [PubMed] [Google Scholar]
- [17].Salatino JW, Ludwig KA, Kozai TDY, Purcell EK, Nat. Biomed. Eng 2017, 1, 862. [DOI] [PMC free article] [PubMed] [Google Scholar]
- [18].Biran R, Martin DC, Tresco PA, Exp. Neurol 2005, 195, 115. [DOI] [PubMed] [Google Scholar]
- [19].Michelson NJ, Vazquez AL, Eles JR, Salatino JW, Purcell EK, Williams JJ, Cui XT, Kozai TDY, J. Neural Eng 2018, 15, 033001. [DOI] [PMC free article] [PubMed] [Google Scholar]
- [20].Kozai TDY, Vazquez AL, LWeaver C, Kim SG, Cui XT, J. Neural Eng 2012, 9, 066001. [DOI] [PMC free article] [PubMed] [Google Scholar]
- [21].Polikov VS, Tresco PA, Reichert WM, J. Neurosci. Methods 2005, 148, 1. [DOI] [PubMed] [Google Scholar]
- [22].McConnell GC, Rees HD, Levey AI, Gutekunst CA, Gross RE, Bellamkonda RV, J. Neural Eng 2009, 6, 056003. [DOI] [PubMed] [Google Scholar]
- [23].Kozai TD, Jaquins-Gerstl AS, Vazquez AL, Michael AC, Cui XT, ACS Chem. Neurosci 2015, 6, 48. [DOI] [PMC free article] [PubMed] [Google Scholar]
- [24].Wellman SM, Li L, Yaxiaer Y, McNamara IN, Kozai TD, Front. Neurosci 2019, 13, 493. [DOI] [PMC free article] [PubMed] [Google Scholar]
- [25].Wellman SM, Kozai TDY, Biomaterials 2018, 164, 121. [DOI] [PMC free article] [PubMed] [Google Scholar]
- [26].Wellman SM, Cambi F, Kozai TD, Biomaterials 2018, 183, 200. [DOI] [PMC free article] [PubMed] [Google Scholar]
- [27].Wellman SM, Kozai TDY, ACS Chem. Neurosci 2017, 8, 2578. [DOI] [PMC free article] [PubMed] [Google Scholar]
- [28].Kozai TDY, Marzullo TC, Hooi F, Langhals NB, Majewska AK, Brown EB, Kipke DR, J. Neural Eng 2010, 7, 046011. [DOI] [PMC free article] [PubMed] [Google Scholar]
- [29].Kozai TD, Langhals NB, Patel PR, Deng X, Zhang H, Smith KL, Lahann J, Kotov NA, Kipke DR, Nat. Mater 2012, 11, 1065. [DOI] [PMC free article] [PubMed] [Google Scholar]
- [30].Davalos D, Ryu JK, Merlini M, Baeten KM, Le Moan N, Petersen MA, Deerinck TJ, Smirnoff DS, Bedard C, Hakozaki H, Nat. Commun 2012, 3, 1227. [DOI] [PMC free article] [PubMed] [Google Scholar]
- [31].Ralay Ranaivo H, Wainwright MS, Brain Res. 2010, 1313, 222. [DOI] [PMC free article] [PubMed] [Google Scholar]
- [32].Kozai TDY, Vazquez AL, Weaver CL, Kim S-G, Cui XT, J. Neural Eng 2012, 9, 066001. [DOI] [PMC free article] [PubMed] [Google Scholar]
- [33].Eugenin EA, Eckardt D, Theis M, Willecke K, Bennett MV, Saez JC, Proc. Natl. Acad. Sci. USA 2001, 98, 4190. [DOI] [PMC free article] [PubMed] [Google Scholar]
- [34].Streit WJ, Mrak RE, Griffin WS, J. Neuroinflammation 2004, 1, 14. [DOI] [PMC free article] [PubMed] [Google Scholar]
- [35].Liu B, Hong JS, J. Pharmacol. Exp. Ther 2003, 304, 1. [DOI] [PubMed] [Google Scholar]
- [36].Nimmerjahn A, Kirchhoff F, Helmchen F, Science 2005, 308, 1314. [DOI] [PubMed] [Google Scholar]
- [37].Perry VH, Teeling J, Semin. Immunopathol 2013, 35, 601. [DOI] [PMC free article] [PubMed] [Google Scholar]
- [38].Fitch MT, Doller C, Combs CK, Landreth GE, Silver J, J. Neurosci 1999, 19, 8182. [DOI] [PMC free article] [PubMed] [Google Scholar]
- [39].Eles J, Vazquez A, Kozai T, Cui XJB, Biomaterials 2018, 174, 79. [DOI] [PMC free article] [PubMed] [Google Scholar]
- [40].Eles JR, Vazquez AL, Snyder NR, Lagenaur CF, Murphy MC, Kozai TDY, Cui XT, Biomaterials 2017, 113, 279. [DOI] [PMC free article] [PubMed] [Google Scholar]
- [41].Kozai TDY, Jaquins-gerstl AS, Vazquez AL, Michael AC, Cui XT, Biomaterials 2016, 87, 157. [DOI] [PMC free article] [PubMed] [Google Scholar]
- [42].Kozai TD, Eles JR, Vazquez AL, Cui XT, J. Neurosci. Methods 2016, 258, 46. [DOI] [PMC free article] [PubMed] [Google Scholar]
- [43].Azemi E, Stauffer WR, Gostock MS, Lagenaur CF, Cui XT, Acta Biomater. 2008, 4, 1208. [DOI] [PubMed] [Google Scholar]
- [44].Azemi E, Lagenaur CF, Cui XT, Biomaterials 2011, 32, 681. [DOI] [PMC free article] [PubMed] [Google Scholar]
- [45].Kolarcik CL, Bourbeau D, Azemi E, Rost E, Zhang L, Lagenaur CF, Weber DJ, Cui XT, Acta Biomater. 2012, 8, 3561. [DOI] [PMC free article] [PubMed] [Google Scholar]
- [46].Eles JR, Vazquez AL, Snyder NR, Lagenaur C, Murphy MC, Kozai TD, Cui XT, Biomaterials 2017, 113, 279. [DOI] [PMC free article] [PubMed] [Google Scholar]
- [47].Cui X, Wiler J, Dzaman M, Altschuler RA, Martin DC, Biomaterials 2003, 24, 777. [DOI] [PubMed] [Google Scholar]
- [48].Sun Q, Su Y, Ma X, Wang Y, Jiang Z, J. Membr. Sci 2006, 285, 299. [Google Scholar]
- [49].Wang J, Wang Z, Wang J, Wang S, J. Membr. Sci 2015, 493, 188. [Google Scholar]
- [50].Yuan YY, Mao CQ, Du XJ, Du JZ, Wang F, Wang J, Adv. Mater 2012, 24, 5476. [DOI] [PubMed] [Google Scholar]
- [51].Yameen B, Ali M, Neumann R, Ensinger W, Knoll W, Azzaroni O, J. Am. Chem. Soc 2009, 131, 2070. [DOI] [PubMed] [Google Scholar]
- [52].Vaisocherova H, Yang W, Zhang Z, Cao Z, Cheng G, Piliarik M, Homola J, Jiang S, Anal. Chem 2008, 80, 7894. [DOI] [PubMed] [Google Scholar]
- [53].Wang G, Han R, Su X, Li Y, Xu G, Luo X, Biosens. Bioelectron 2017, 92, 396. [DOI] [PubMed] [Google Scholar]
- [54].Cui M, Wang Y, Jiao M, Jayachandran S, Wu Y, Fan X, Luo X, ACS Sens. 2017, 2, 490. [DOI] [PubMed] [Google Scholar]
- [55].Zhang L, Cao Z, Bai T, Carr L, Ella-Menye JR, Irvin C, Ratner BD, Jiang S, Nat. Biotechnol 2013, 31, 553. [DOI] [PubMed] [Google Scholar]
- [56].Yang J, Chen H, Xiao S, Shen M, Chen F, Fan P, Zhong M, Zheng J, Langmuir 2015, 31, 9125. [DOI] [PubMed] [Google Scholar]
- [57].Kobayashi M, Terayama Y, Yamaguchi H, Terada M, Murakami D, Ishihara K, Takahara A, Langmuir 2012, 28, 7212. [DOI] [PubMed] [Google Scholar]
- [58].Xu FJ, Neoh KG, Kang ET, Prog. Polym. Sci 2009, 34, 719. [Google Scholar]
- [59].Münch AS, Fritzsche T, Haufe H, Uhlmann P, J. Coat. Technol. Res 2018, 15, 703. [Google Scholar]
- [60].Leigh BL, Cheng E, Xu L, Andresen C, Hansen MR, Guymon CA, Biomacromolecules 2017, 18, 2389. [DOI] [PMC free article] [PubMed] [Google Scholar]
- [61].Zhu B, Luo SC, Zhao H, Lin HA, Sekine J, Nakao A, Chen C, Yamashita Y, Yu HH, Nat. Commun 2014, 5, 4523. [DOI] [PubMed] [Google Scholar]
- [62].Golabchi A, Wu B, Cao B, Bettinger CJ, Cui XT, Biomaterials 2019, 225, 119519. [DOI] [PMC free article] [PubMed] [Google Scholar]
- [63].de Boer B, Simon HK, Werts MPL, van der Vegte EW, Hadziioannou G, Macromolecules 2000, 33, 349. [Google Scholar]
- [64].Brash J, Uniyal S, J. Polym. Sci.: Polym. Symp 1979, 66, 377. [Google Scholar]
- [65].Brash J, Ten Hove P, Thromb. Haemostasis 1984, 52, 326. [PubMed] [Google Scholar]
- [66].Ryu JK, McLarnon JG, J. Cell. Mol. Med 2009, 13, 2911. [DOI] [PMC free article] [PubMed] [Google Scholar]
- [67].Schachtrup C, Ryu JK, Helmrick MJ, Vagena E, Galanakis DK, Degen JL, Margolis RU, Akassoglou K, J. Neurosci 2010, 30, 5843. [DOI] [PMC free article] [PubMed] [Google Scholar]
- [68].Iversen EG, Fonnum F, Neurosci. Lett 1994, 167, 29. [DOI] [PubMed] [Google Scholar]
- [69].Ivens S, Kaufer D, Flores LP, Bechmann I, Zumsteg D, Tomkins O, Seiffert E, Heinemann U, Friedman A, Brain 2007, 130, 535. [DOI] [PubMed] [Google Scholar]
- [70].Cheepsunthorn P, Radov L, Menzies S, Reid J, Connor JR, Glia 2001, 35, 53. [DOI] [PubMed] [Google Scholar]
- [71].Eles JR, Vazquez AL, Snyder NR, Lagenaur C, Murphy MC, Kozai TDY, Cui XT, Biomaterials 2017, 113, 279. [DOI] [PMC free article] [PubMed] [Google Scholar]
- [72].Yue W-W, Li H-J, Xiang T, Qin H, Sun S-D, Zhao C-S, J. Membr. Sci 2013, 446, 79. [Google Scholar]
- [73].Ladd J, Zhang Z, Chen S, Hower JC, Jiang S, Biomacromolecules 2008, 9, 1357. [DOI] [PubMed] [Google Scholar]
- [74].Chien HW, Tsai CC, Tsai WB, Wang MJ, Kuo WH, Wei TC, Huang ST, Colloids Surf., B 2013, 107, 152. [DOI] [PubMed] [Google Scholar]
- [75].Li G, Xue H, Cheng G, Chen S, Zhang F, Jiang S, J. Phys. Chem. B 2008, 112, 15269. [DOI] [PubMed] [Google Scholar]
- [76].Saiz-Poseu J, Mancebo-Aracil J, Nador F, Busque F, Ruiz-Molina D, Angew. Chem., Int. Ed 2019, 58, 696. [DOI] [PubMed] [Google Scholar]
- [77].Gutowski SM, Templeman KL, South AB, Gaulding JC, Shoemaker JT, LaPlaca MC, Bellamkonda RV, Lyon LA, García AJ, J. Biomed. Mater. Res. Part A 2014, 102, 1486. [DOI] [PMC free article] [PubMed] [Google Scholar]
- [78].Lee HC, Gaire J, Currlin SW, McDermott MD, Park K, Otto KJ, Front. Neurosci 2017, 11, 513. [DOI] [PMC free article] [PubMed] [Google Scholar]
- [79].Zhang P, Sun F, Liu S, Jiang S, J. Controlled Release 2016, 244, 184. [DOI] [PMC free article] [PubMed] [Google Scholar]
- [80].Reid B, Gibson M, Singh A, Taube J, Furlong C, Murcia M, Elisseeff J, J. Tissue Eng. Regener. Med 2015, 9, 315. [DOI] [PMC free article] [PubMed] [Google Scholar]
- [81].Zhang P, Sun F, Tsao C, Liu S, Jain P, Sinclair A, Hung HC, Bai T, Wu K, Jiang S, Proc. Natl. Acad. Sci. USA 2015, 112, 12046. [DOI] [PMC free article] [PubMed] [Google Scholar]
- [82].Li B, Yuan Z, Hung HC, Ma J, Jain P, Tsao C, Xie J, Zhang P, Lin X, Wu K, Jiang S, Angew. Chem. Int. Ed 2018, 57, 13873. [DOI] [PubMed] [Google Scholar]
- [83].Ereifej ES, Smith CS, Meade SM, Chen K, Feng H, Capadona JR, Adv. Funct. Mater 2018, 28, 170. [Google Scholar]
- [84].Xiao Y, Martin DC, Cui X, Shenai M, Appl. Biochem. Biotechnol 2006, 128, 117. [DOI] [PubMed] [Google Scholar]
- [85].Nimmerjahn A, Kirchhoff F, Helmchen F, Science 2005, 308, 1314. [DOI] [PubMed] [Google Scholar]
- [86].Davalos D, Grutzendler J, Yang G, Kim JV, Zuo Y, Jung S, Littman DR, Dustin ML, Gan W-B, Nat. Neurosci 2005, 8, 752. [DOI] [PubMed] [Google Scholar]
- [87].Kreutzberg GW, Trends Neurosci. 1996, 19, 312. [DOI] [PubMed] [Google Scholar]
- [88].Perry VH, Nicoll JAR, Holmes C, Nat. Rev. Neurol 2010, 6, 193. [DOI] [PubMed] [Google Scholar]
- [89].Hanisch U-K, Kettenmann H, Nat. Neurosci 2007, 10, 1387. [DOI] [PubMed] [Google Scholar]
- [90].Eles J, Vazquez A, Kozai T,Cui X, Biomaterials 2018, 174, 79. [DOI] [PMC free article] [PubMed] [Google Scholar]
- [91].Biber K, Vinet J, Boddeke H, J. Neuroimmunol 2008, 198, 69. [DOI] [PubMed] [Google Scholar]
- [92].El Khoury J, Toft M, Hickman SE, Means TK, Terada K, Geula C, Luster AD, Nat. Med 2007, 13, 432. [DOI] [PubMed] [Google Scholar]
- [93].Rappert A, Bechmann I, Pivneva T, Mahlo J, Biber K, Nolte C, Kovac AD, Gerard C, Boddeke HW, Nitsch R, J. Neurosci 2004, 24, 8500. [DOI] [PMC free article] [PubMed] [Google Scholar]
- [94].Haynes SE, Hollopeter G, Yang G, Kurpius D, Dailey ME, Gan W-B, Julius D, Nat. Neurosci 2006, 9, 1512. [DOI] [PubMed] [Google Scholar]
- [95].Bollmann L, Koser DE, Shahapure R, Gautier HO, Holzapfel GA, Scarcelli G, Gather MC, Ulbricht E, Franze K, Front. Cell. Neurosci 2015, 9, 363. [DOI] [PMC free article] [PubMed] [Google Scholar]
- [96].Azemi E, Stauffer WR, Gostock MS, Lagenaur CF, Cui XT, Acta Biomater. 2008, 4, 1208. [DOI] [PubMed] [Google Scholar]
- [97].Moos M, Tacke R, Scherer H, Teplow D, Früh K, Schachner M, Nature 1988, 334, 701. [DOI] [PubMed] [Google Scholar]
- [98].Kowitz A, Kadmon G, Eckert M, Schirrmacher V, Schachner M, Altevogt P, Eur. J. Immunol 1992, 22, 1199. [DOI] [PubMed] [Google Scholar]
- [99].Kadmon G, Altevogt P, Differentiation 1997, 61, 143. [DOI] [PubMed] [Google Scholar]
- [100].Nasu-Tada K, Koizumi S, Inoue K, Glia 2005, 52, 98. [DOI] [PubMed] [Google Scholar]
- [101].Hierro-Bujalance C, Bacskai B, Garcia-Alloza M, Front. Aging Neurosci 2018, 10, 218. [DOI] [PMC free article] [PubMed] [Google Scholar]
- [102].Tsai IY, Kuo C-C, Tomczyk N, Stachelek SJ, Composto RJ, Eckmann DM, Soft Matter 2011, 7, 3599. [DOI] [PMC free article] [PubMed] [Google Scholar]
- [103].McWhorter FY, Wang T, Nguyen P, Chung T, Liu WF, Proc. Natl. Acad. Sci. USA 2013, 110, 17253. [DOI] [PMC free article] [PubMed] [Google Scholar]
- [104].Lee HS, Stachelek SJ, Tomczyk N, Finley MJ, Composto RJ, Eckmann DM, J. Biomed. Mater. Res. Part A 2013, 101A, 203. [DOI] [PMC free article] [PubMed] [Google Scholar]
- [105].Kolarcik CL, Bourbeau D, Azemi E, Rost E, Zhang L, Lagenaur CF, Weber DJ, Cui XT, Acta Biomater. 2012, 8, 3561. [DOI] [PMC free article] [PubMed] [Google Scholar]
- [106].Zheng XS, Snyder NR, Woeppel K, Barengo JH, Li X, Eles J, Kolarcik CL, Cui XT, Acta Biomater. 2019, 99, 72. [DOI] [PMC free article] [PubMed] [Google Scholar]
- [107].Potter-Baker KA, Stewart WG, Tomaszewski WH, Wong CT, Meador WD, Ziats NP, Capadona JR, J. Neural Eng 2015, 12, 046002. [DOI] [PMC free article] [PubMed] [Google Scholar]
- [108].Prasad A, Sanchez JC, J. Neural Eng 2012, 9, 026028. [DOI] [PubMed] [Google Scholar]
- [109].Takmakov P, Ruda K, Phillips KS, Isayeva IS, Krauthamer V, Welle CG, J. Neural Eng 2015, 12, 026003. [DOI] [PMC free article] [PubMed] [Google Scholar]
- [110].Kozai TD, Catt K, Li X, Gugel ZV, Olafsson VT, Vazquez AL, Cui XT, Biomaterials 2015, 37, 25. [DOI] [PMC free article] [PubMed] [Google Scholar]
- [111].Barrese JC, Rao N, Paroo K, Triebwasser C, Vargas-Irwin C, Franquemont L, Donoghue JP, J. Neural Eng 2013, 10, 066014. [DOI] [PMC free article] [PubMed] [Google Scholar]
- [112].Tang Y, Le W, Mol. Neurobiol 2016, 53, 1181. [DOI] [PubMed] [Google Scholar]
- [113].Polikov VS, Tresco PA, Reichert WM, J. Neurosci. Methods 2005, 148, 1. [DOI] [PubMed] [Google Scholar]
- [114].McConnell GC, Rees HD, Levey AI, Gutekunst C-A, Gross RE, Bellamkonda RV, J. Neural Eng 2009, 6, 056003. [DOI] [PubMed] [Google Scholar]
- [115].Schultz RL, Willey TJ, J. Neurocytol 1976, 5, 621. [DOI] [PubMed] [Google Scholar]
- [116].Golabchi A, Wu B, Li X, Carlisle DL, Kozai TDY, Friedlander RM, Cui XT, Biomaterials 2018, 180, 225. [DOI] [PMC free article] [PubMed] [Google Scholar]
- [117].Kozai TDY, Gugel Z, Li X, Gilgunn PJ, Khilwani R, Ozdoganlar OB, Fedder GK, Weber DJ, Cui XT, Biomaterials 2014, 35, 9255. [DOI] [PubMed] [Google Scholar]
- [118].Kozai TD, Li X, Bodily LM, Caparosa EM, Zenonos GA, Carlisle DL, Friedlander RM, Cui XT, Biomaterials 2014, 35, 9620. [DOI] [PMC free article] [PubMed] [Google Scholar]
- [119].McCreery D, Cogan S, Kane S, Pikov V, J. Neural Eng 2016, 13, 036012. [DOI] [PMC free article] [PubMed] [Google Scholar]
- [120].Michelson NJ, Vazquez AL, Eles JR, Salatino JW, Purcell EK, Williams JJ, Cui XT,Kozai TDY, J. Neural Eng 2018, 15, 033001. [DOI] [PMC free article] [PubMed] [Google Scholar]
- [121].Kozai TDY, Catt K, Li X, Gugel ZV, Olafsson VT, Vazquez AL, Cui XT, Biomaterials 2015, 37, 25. [DOI] [PMC free article] [PubMed] [Google Scholar]
- [122].Parslow A, Cardona A, Bryson-Richardson RJ, J. Visualized Exp 2014, 86, e51086. [DOI] [PMC free article] [PubMed] [Google Scholar]
Associated Data
This section collects any data citations, data availability statements, or supplementary materials included in this article.