Abstract
Mating and egg-laying are tightly coordinated events in the reproductive life of oviparous females. Oviposition is typically rare in virgin females but is initiated after copulation. Here, we identify the neural circuitry that links egg-laying to mating status in Drosophila melanogaster. Activation of female-specific descending interneurons, the oviDNs, is necessary and sufficient for egg-laying, and is equally potent in virgin and mated females. Upon mating, a male seminal fluid protein, the sex peptide (SP), triggers many behavioural and physiological changes in the female, including the onset of egg-laying1. SP is detected by sensory neurons (SPSNs) in the uterus2–4, and silences both SPSNs and their postsynaptic SAG ascending neurons5. We show here that SAG neurons directly activate the female-specific pC1 neurons. GABAergic oviINs mediate feedforward inhibition from pC1 neurons to both oviDNs and their major excitatory input, the oviENs. Thus, by attenuating the SAG inputs to pC1 neurons and oviINs, SP disinhibits oviDNs to enable egg-laying after mating. This circuitry thus coordinates the two key events in female reproduction: mating and egg-laying.
We reasoned that egg-laying is likely to be dependent upon cell types that are female-specific, and hence express either of the sex determination genes6 fruitless (fru) and doublesex (dsx). In particular, egg-laying is blocked by either silencing7 or masculinizing8 all fru+ neurons. Some of these fru+ neurons are descending interneurons, which project from the brain to the ventral nerve cord and are thought to convey high-level motor commands9. We therefore focused on female-specific fru+ descending neurons and used the split-GAL4 technique10–12 to obtain two driver lines that label two female-specific fru+ dsx− cholinergic descending neurons per brain hemisphere (Fig. 1a, b, Extended Data Figs. 1–3). In optogenetic activation experiments using Chrimson13, both split-GAL4 driver lines reliably induced oviposition behaviour in mated females, with most but not all females also depositing an egg (Fig. 1c, d, Video 1; we presume that not all females had an egg in the uterus at the time of oviDN activation). Accordingly, we refer to these neurons as the oviposition descending neurons (oviDNs) and the two split-GAL4 driver lines that label them as oviDN-SS1 and oviDN-SS2. Stochastic labelling of single neurons14 resolved two morphologically distinct oviDN cell types, which we refer to as the oviDNa and oviDNb cells (Fig. 1b). In an electron microscope (EM) volume of a full adult female brain (FAFB15), we identified two oviDNa-like cells and one oviDNb-like cell in each hemisphere (Fig. 1b, Video 2).
Fig. 1 |. oviDNs control oviposition.
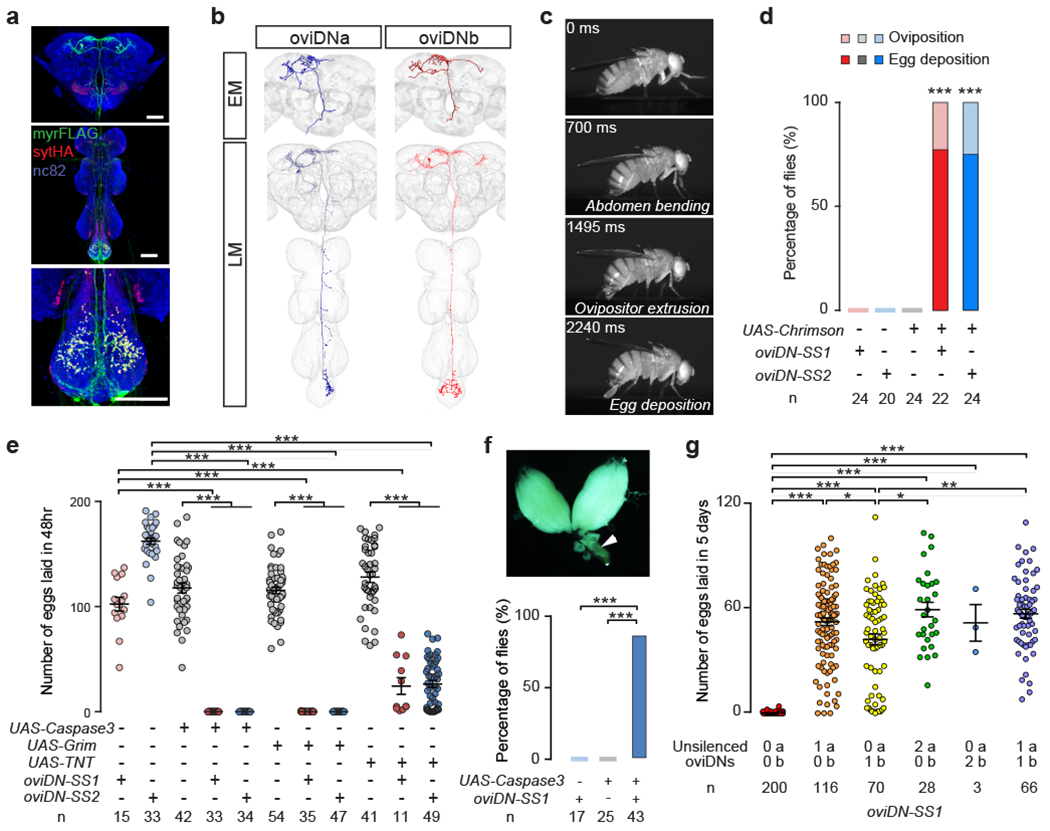
a, Confocal images showing brain (top), ventral nerve cord (middle), and abdominal ganglion (bottom) of an oviDN-SS1 female stained to reveal oviDN membranes (UAS-myrFLAG, green), presynaptic sites (UAS-sytHalo, red), and all synapses (nc82, blue). Scale bars, 50 μm. b, EM reconstructions (top) and confocal images (bottom) of single oviDNa and oviDNb neurons. c, Snapshots of the oviposition sequence induced upon photoactivation of oviDNs (5 s, 635 nm, 261 μW/mm2; see Video 1). d, Percentage of mated females exhibiting oviposition and egg deposition upon illumination. e, Number of eggs laid per female in 48 hr after mating. f, Percentage of females with an arrested egg (arrow in image) or embryo in the uterus 10 d after mating. g, Number of eggs laid in 5 d after mating by females with all but one or two oviDNs silenced. ***, P < 0.001, **, P < 0.01, *, P < 0.05, Fisher’s exact test in d and f, Wilcoxon test in e and g. Data in e and g shown as scatter plots with mean ± s.e.m.
Egg-laying by mated females was completely blocked by genetic ablation of oviDNs and dramatically reduced by chronic silencing oviDNs (Fig. 1e, Extended Data Fig. 4a, b). Virgin oviDN-ablated females were as receptive to mating as control females (Extended Data Fig. 4c). Several days after mating, their ovaries contained many mature eggs, and most carried either a fertilized egg or first-instar larva in the uterus (Fig. 1f). We conclude that oviDNs are essential for oviposition, but dispensable for mating, ovulation, and fertilization.
We were unable to generate driver lines that specifically target either the oviDNa or oviDNb cells. To determine which oviDN subtype is involved in oviposition, we therefore performed a stochastic “unsilencing” experiment, in which a tdTomato-tagged silencing transgene was targeted to all oviDNs, but stochastically replaced in some of these cells with GFP. Individual females were assayed for egg-laying over 5 days after mating, then dissected and stained to determine their complement of red (tdTomato, silenced) and green (GFP, unsilenced) oviDNs. Females with no unsilenced cells laid no or very few eggs, whereas those with just a single functional oviDN cell generally laid large numbers of eggs (Fig. 1g, Extended Data Fig. 5). The number of eggs laid per female was somewhat variable in these cases, but there was no appreciable difference between females in which either an oviDNa or oviDNb cell was unsilenced, nor between those in which either one or two cells of either type were functional. While the oviDNa and oviDNb subtypes differ in their morphology, and likely also their connectivity and physiology, these data suggest that they nonetheless serve similar functions in oviposition.
Oviposition involves a coordinated and highly stereotyped sequence of motor actions16,17 that progresses from abdomen bending to ovipositor extrusion and egg deposition (Fig. 2a). Abdomen bending, ovipositor extrusion, and egg deposition were all eliminated in oviDN-ablated females (Fig. 2b). Conversely, abdomen bending and ovipositor extrusion were reliably triggered by strong photoactivation of oviDNs in either virgin or mated females (Fig. 2c). Egg deposition was also induced, but only in mated females (presumably because mating is required to stimulate ovulation). In all of these oviDN activation experiments, the sequence of motor actions was the same as in natural egg-laying (Fig. 2a, c). By varying the stimulus intensity, we found that egg deposition has a higher activation threshold than abdomen bending and ovipositor extrusion (Fig. 2d), and that action latencies were shorter at higher stimulus intensities (Fig. 2e). Moreover, at low stimulus intensities, the oviposition sequence was often truncated, but an action was never skipped and only once did we observe a single action occurring out of order (in a total of 38 flies at each of 3 intensities; Extended Data Fig. 6). These data suggest that oviDNs may use a ramp-to-threshold mechanism to elicit the successive oviposition motor actions18. More importantly, the activation thresholds and action latencies were indistinguishable between virgins and mated females (Fig. 2d, e) indicating that mating status regulates egg-laying through oviDN’s upstream brain circuits rather than downstream motor circuits.
Fig. 2 |. oviDNs induce the oviposition motor sequence with equal potency in virgin and mated females.
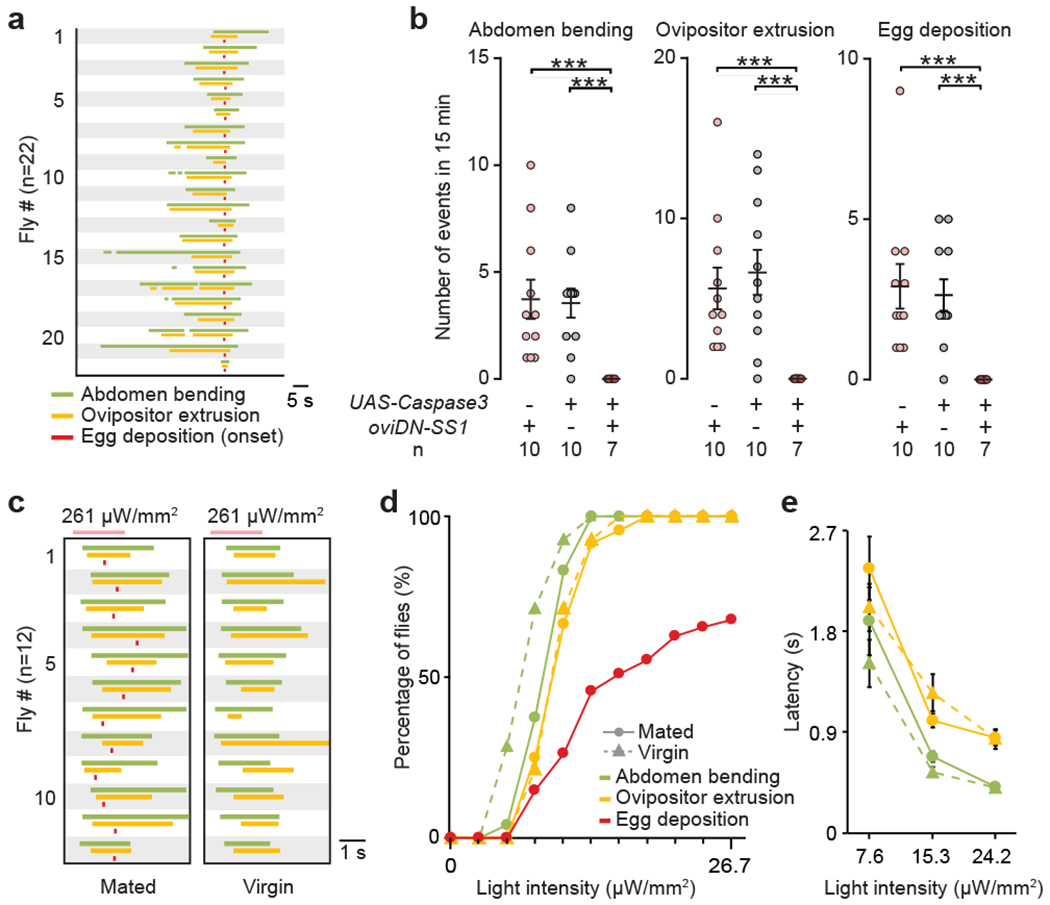
a, Ethograms of oviposition actions by mated wild-type females, aligned to the onset of egg deposition. b, Frequency of oviposition motor actions by mated females, shown as scatter plots with mean ± s.e.m. ***, P < 0.001, Wilcoxon test. c, Ethograms of oviposition actions induced by photoactivating oviDNs in mated and virgin females, aligned to the onset of the light stimulus. Pink bars: 2 s of 635 nm illumination. d, e, Percentage of flies exhibiting indicated actions (d) and latencies to action onsets, shown as mean ± s.e.m. (e) at varying light intensities. Egg deposition was assessed in different flies at each light intensity (n = 28–46). Other actions were examined on the same set of flies in order of increasing light intensity (virgin: n = 14; mated: n = 24). No significant difference between virgin and mated females, Fisher’s exact test (d) and Wilcoxon test (e).
The onset of egg-laying after mating is induced by SP, a male seminal fluid protein1 that is detected by SP sensory neurons (SPSNs) of the uterus3,4. SP silences both SPSNs and their postsynaptic targets in the abdominal ganglion, the SAG neurons5. Artificially activating either SPSNs or SAGs suppressed egg-laying by mated females (Fig. 3a, Extended Data Fig. 1, refs. 35). Conversely, ablating (Fig. 3b) or silencing3–5 these cells increased the number of eggs laid by virgins. Virgin egg-laying as a result of SPSN or SAG ablation was dependent upon the oviDNs, as it was prevented if these cells were co-ablated (Fig. 3b). SPSN and SAG activity is thus critical in keeping oviDNs inactive until after mating. This inhibition is most likely indirect, because the SAGs are cholinergic, and hence likely excitatory (Extended Data Fig. 3). We identified and extensively traced the ascending projections of the two SAGs in the FAFB volume (Fig. 3c) and found just a single synapse from SAGs to oviDNs (Extended Data Table 1).
Fig. 3 |. pC1 neurons suppress egg-laying and oviDN activity and are regulated by the SP pathway.
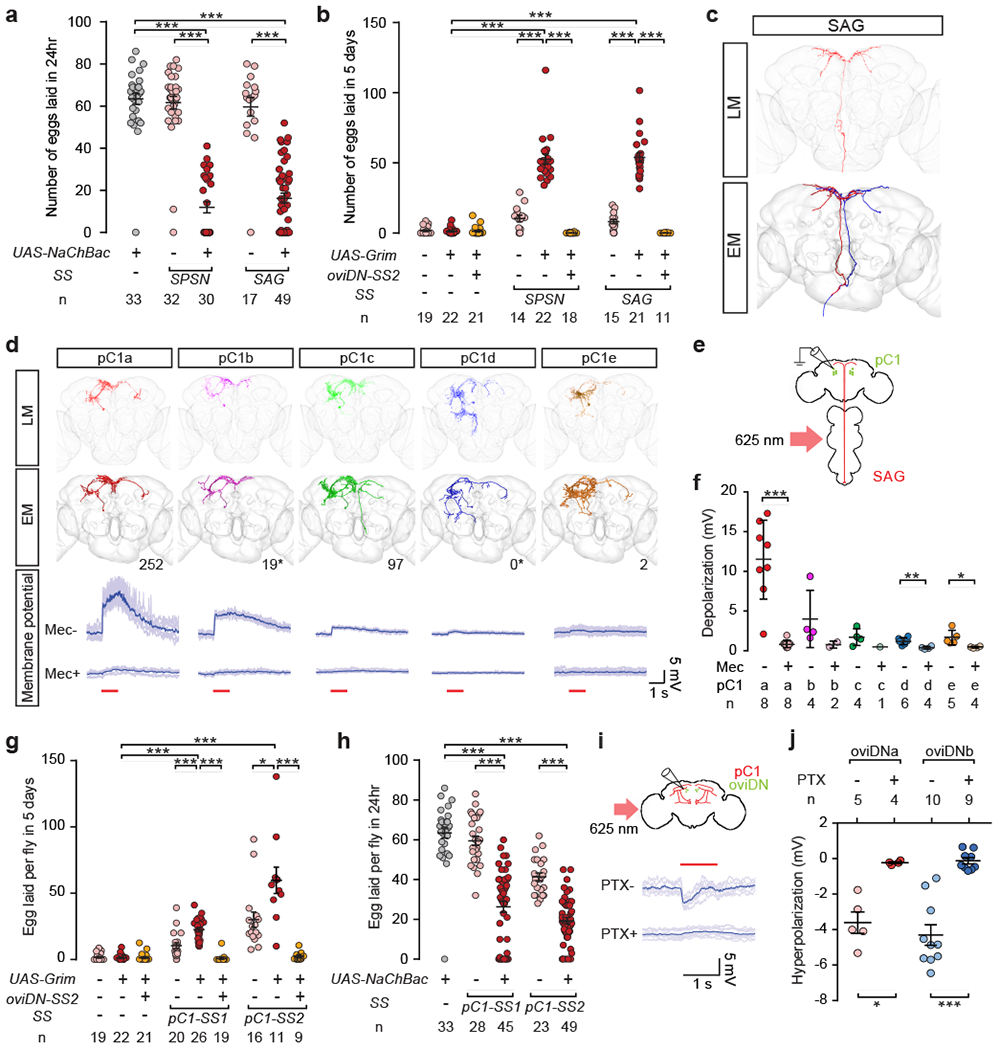
a, b, Number of eggs laid by mated females in 24 hr after mating (a), or by virgin females in 5 d after eclosion (b). c, Confocal image (top) and EM reconstructions (bottom) of SAGs. d, Confocal images (top) and EM reconstructions (second row) of distinct pC1 subtypes, including the number of SAG>pC1 synapses detected in the EM volume (* pC1 cells only partly traced). Bottom rows show example traces of membrane potential changes in pC1 cells upon photoactivation of SAGs (1 s at 625 nm, red line). Darker traces were averaged from lighter ones. e, Schematic of experimental design. f, Peak response in each pC1 subtype upon photoactivation of SAGs, before (Mec-) and after (Mec+) mecamylamine application. g, h, Number of eggs laid by virgin females in 5 d after eclosion (g), or by mated females in 24 hr after mating (h). i, Schematic of experimental design (top), and example traces (bottom) showing membrane potential changes in an oviDNb cell upon photoactivation of pC1 neurons before (PTX-) and after (PTX+) picrotoxin application. j, Maximum changes in oviDNa and oviDNb membrane potential in response to photoactivation of pC1 cells. ***, P < 0.001, **, P < 0.01, *, P < 0.05, Wilcoxon test. Data shown as scatter plots with mean ± s.e.m. in a, b, f, g, h, j.
The targets of SAGs in the brain have not been identified. Because SAGs regulate female receptivity as well as egg-laying5, we speculated that their targets may include the female-specific fru dsx+ pC1 neurons in the protocerebrum, which are known to regulate receptivity19. Within FAFB we identified 5 morphologically distinct pC1 cells in each hemisphere, which we refer to as the pC1a-e cells (Fig. 3d, Extended Data Fig. 7a, Video 3). Our extensive tracing of a single pC1a, pC1c, and pC1e cell, as well as more limited tracing of a pC1b and pC1d cell, suggests that the SAGs provide numerous synaptic inputs to the pC1a, pC1b and pC1c cells, with fewer if any direct inputs to pC1d and pC1e cells (Fig. 3d, Extended Data Table 1, Video 4). We performed whole-cell recordings from individual pC1 neurons while photoactivating the SAGs (Fig. 3d–f, Extended Data Fig. 7b). We found that pC1a cells were strongly depolarized, pC1b cells were weakly depolarized, and pC1c, pC1d and pC1e cells showed little or no response upon SAG activation (Fig. 3d–f). We note however the numerous synaptic connections amongst all 5 pC1 subtypes (Extended Data Table 1), suggesting that any mating status information obtained from SAGs by pC1a and pC1b cells is potentially shared across the entire set of pC1 cells.
We obtained two split-GAL4 driver lines for pC1 neurons: pC1-SS1, which labels pC1a, pC1c and pC1e, and pC1-SS2, which labels all 5 pC1 cells (Extended Data Fig. 1). Ablation of pC1 cells using either driver resulted in virgins with increased egg-laying that was dependent upon oviDN function (Fig. 3g), whereas mated females in which pC1 neurons were chronically activated laid fewer eggs (Fig. 3h). Brief optogenetic silencing of pC1 neurons in virgins did not acutely trigger egg-laying, as would be expected if pC1-inactivated virgins, like pC1-intact mated females20, rely on additional substrate-borne cues to induce egg-laying (Extended Data Fig. 7c, d).
These behavioural data indicate that, like SPSNs and SAGs, the pC1 neurons suppress oviDN function and hence egg-laying in virgin females. Consistent with this interpretation, we found by in vivo imaging that basal calcium levels in pC1 neurons, though variable, are generally higher in virgin than mated females (Extended Data Fig. 7e). Moreover, whole-cell recordings from oviDNs revealed that both the oviDNa and oviDNb cells are hyperpolarized upon photoactivation of pC1 neurons (Fig. 3i, j; Extended Data Fig. 5d), and that this effect is sensitive to picrotoxin, a chloride channel blocker (Fig. 3i, j). This inhibition is likely to be indirect, because pC1 neurons are cholinergic (Extended Data Fig. 3) and have very few synapses onto the oviDNs (Extended Data Table 1).
To look for inhibitory intermediates from pC1 to oviDN cells, as well as excitatory inputs that might stimulate egg-laying upon detection of a preferred substrate, we reconstructed the synaptic inputs to oviDNa and oviDNb cells in the FAFB volume (Fig. 4a, b). We obtained sparse split-GAL4 driver lines for the two cell types with the largest numbers of oviDN input synapses (Fig 4c; Extended Data Fig 1; Video 5). Whole-cell recordings reliably showed membrane potential changes in oviDNs upon photoactivation of either of these two cell types (Fig. 4d, e). The cell type with the most oviDN input synapses is cholinergic (Extended Data Fig. 3), and activation of these cells depolarized oviDNs (Fig. 4d). We therefore named these cells the oviENs (oviposition excitatory neurons). The cell type with the second-most oviDN input synapses is GABAergic (Extended Data Fig. 3), and activation of these cells hyperpolarized oviDNs (Fig. 4e). Accordingly, we named these cells the oviINs (oviposition inhibitory neurons). There is a single oviEN and a single oviIN per hemisphere, and they are reciprocally connected (Fig. 4a–c, Extended Data Table 1). The oviIN cell is also reciprocally connected with pC1 cells (Fig. 4b, Extended Data Table 1), and calcium imaging experiments showed that photoactivation of pC1 cells elicits an excitatory response in oviINs (Fig. 4f). The pC1 cells have few direct synaptic connections with oviEN, and we did not detect any connections between SAG neurons and either oviIN or oviEN (Extended Data Table 1).
Fig. 4 |. oviDNs integrate mating status and substrate signals via distinct upstream pathways.
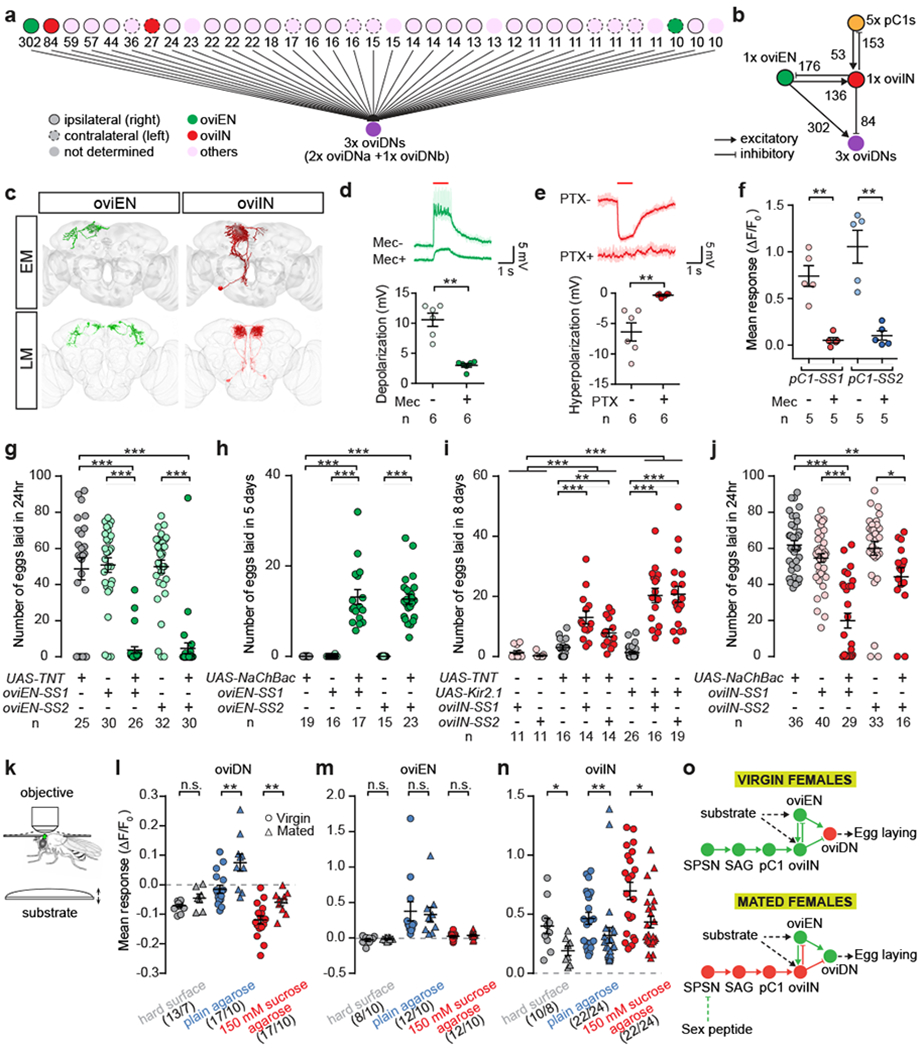
a, Upstream neurons of three oviDNs identified by EM reconstruction, showing the number of oviDN input synapses. b, Synaptic connectivity amongst 4 cell types in the right hemisphere. c, EM reconstructions (top) and confocal images (bottom) of oviENs and oviINs. d, e, Example traces and plots of membrane potential changes in oviDNs evoked by photoactivating (1 s at 625 nm) oviENs (d) or oviINs (e), before and after application of mecamylamine (Mec) or picrotoxin (PTX). f, GCaMP6s signal changes in oviINs in response to photoactivation of pC1 neurons. g-j, Number of eggs laid by mated females in 24 hr after mating (g, j), or by virgin females in 5 d (h) or 8 d (i) after eclosion. k, Schematic of the in vivo Ca2+ imaging experiment. The brain of a female with partially removed head cuticle (green oval) is imaged as substrates are presented to the legs sequentially via an elevator platform. l-n, GCaMP6s signal changes in virgin or mated females. o, Model for the coordination of mating and egg-laying. Solid lines indicate monosynaptic connections. Data shown as scatter plots with mean ± s.e.m. in d-j and l-m. *, P < 0.05, **, P < 0.01, ***, P < 0.001, Wilcoxon test.
Silencing oviENs in mated females strongly suppressed egg-laying (Fig. 4g), similar to the effect observed upon silencing the oviDNs (Fig. 1e). Conversely, potentiating oviENs in virgin females caused them to lay significantly more eggs than control virgins (Fig. 4h), albeit not as many as mated females (presumably because ovulation remains infrequent). Manipulations of oviIN activity had the opposite effects: silencing oviINs caused virgins to lay significantly more eggs (Fig. 4i), whereas depolarizing oviINs reduced the number of eggs laid by mated females (Fig 4j). Thus, as expected from the sign of their inputs to oviDNs, oviENs promote whereas oviINs inhibit egg-laying.
We speculated that oviENs may mediate the external sensory signals that trigger egg-laying in mated females, which likely include both gustatory and mechanosensory cues from the substrate20. When provided with a choice of substrates, females lay more eggs on agarose medium than on either a hard surface or an agarose+sucrose substrate21 (Extended Data Fig. 8a–c). We therefore performed in vivo calcium imaging to determine the responses of oviDN, oviEN, and oviIN cells to the presentation of each of these substrates to the legs (Fig. 4k; Extended Data Fig. 8d, e). In oviDNs, we observed an increase in calcium levels only upon contact with the agarose substrate (Fig. 4l). This response was stronger in mated females than in virgins (Fig. 4l). The agarose+sucrose substrate elicited a small reduction in calcium levels, which was more pronounced in virgin females (Fig. 4l). The oviENs showed a positive calcium response to agarose but neither of other two substrates, and this response was indistinguishable between virgins and mated females (Fig. 4m). The oviINs responded to all three substrates, but more strongly to agarose+sucrose than to agarose alone, and only weakly to the hard surface (Fig. 4n). Regardless of substrate, oviIN responses were stronger in virgins than in mated females (Fig. 4n).
In conclusion, our findings support the following model for the neural coordination of mating and egg-laying in Drosophila (Fig. 4o). The oviDNs control the entire oviposition motor program. They receive excitation from oviENs, which respond to stimulatory cues from the substrate, and inhibition from oviINs, which convey mating status information from pC1 cells. In virgins, elevated pC1 activity potentiates oviIN inhibition of both oviDNs and oviENs, suppressing egg-laying. After mating, SP silences the SAG inputs onto pC1 neurons, thereby decreasing pC1 and oviIN activity to facilitate egg-laying when a preferred substrate is encountered. Reciprocal connections between oviINs and oviENs might ensure that oviDNs respond to oviEN activation with the appropriate temporal pattern and dynamic range, through feedforward and feedback inhibition respectively. The oviDN, oviEN, and oviIN cells all have numerous synaptic inputs in addition to those we have described here, all of which remain functionally uncharacterized. These inputs may mediate further controls on the egg-laying process, such as the presence of an egg in the uterus22 and the nutritional state of the female20. The pC1 neurons may also regulate other female behaviours that switch upon mating, perhaps through different sets of output neurons. Intriguingly, the male counterparts of pC1 neurons are believed to encode an analogous state of courtship arousal23,24 that modulates command pathways for specific motor actions such as courtship song25,26 and “licking”18. Thus, functionally analogous but anatomically divergent circuits, shaped during development by fru and dsx, may account for the distinct reproductive behaviours of Drosophila males and females.
Methods
Flies.
Flies were reared on standard cornmeal-agar-molasses medium or protein-enriched food27 at 25 °C with relative humidity of ~50% and a 12 h/12 h light/dark cycle, unless otherwise noted. Fly stocks used in this study are described and listed in Supplementary Table 1.
GAL4 screen for neurons regulating oviposition.
We searched image collections of “generation 1” GAL4 driver lines12,28 for those that potentially labelled subsets of fru+ or dsx+ neurons. Several hundred selected lines were then screened by examining light-evoked behavioural changes in females using UAS-CsChrimson13. Several GAL4 lines were found to evoke oviposition, and all labelled, amongst various other cells, a common set of descending neurons that were present in females but not males. We then sought to obtain specific split-GAL4 driver lines for these descending neurons.
Split-GAL4 screening and stabilization.
Split-GAL4 lines used in this study have p65ADZp and ZpGAL4DBD inserted at the attP40 site and attP2 site, respectively11,12, except for pC1-SS2, which has p65ADZp inserted at the attP2 site and ZpGAL4DBD inserted at the first coding exon of dsx29. p65ADZp and ZpGAL4DBD lines labelling interested neurons were identified using a color depth MIP mask search30. The expression of selected p65ADZp/ZpGAL4DBD combinations was then examined with a UAS reporter (20 × UAS-CsChrimson-mVenus in attP18) by immunofluorescence staining and confocal microscopy (https://www.janelia.org/project-team/flylight/protocols). Finally, the p65ADZp/ZpGAL4DBD combinations that gave the most specific expression patterns were stabilized by putting the two hemi-drivers in the same flies, and SS (short for stable split-GAL4) numbers were assigned. Images of split-GAL4 lines used in this study can be viewed at http://splitgal4.janelia.org/cgi-bin/splitgal4.cgi.
Stochastic unsilencing.
An FRT-MCS-tdTomato-FRT fragment was chemically synthesized (GenScript, NJ) and inserted into the pJFRC7 20XUAS-IVS-mCD8::GFP backbone. The Kir2.1 coding sequence was synthesized (Integrated DNA Technologies, NJ) and subcloned into 20XUAS-IVS-FRT-MCS-tdTomato-FRT-mCD8::GFP to create the in-frame tdTomato fusion. The resulting plasmid was inserted by phi-C31-mediated transgenesis into the VK00005 landing sites (GenetiVision, TX). Females carrying hs-FlpL2::PEST in attP3, UAS-FRT-Kir2.1::tdTomato-FRT-mCD8::GFP in VK00005, and oviDN-SS1 or oviDN-SS2 were heat shocked during first instar larval stage or prepupal stage, with two to four 1-hour incubations at 37 °C separated by 1-hour intervals at 22 °C. Virgin females were collected shortly after eclosion and kept in groups of 10-20 females on standard cornmeal-agar-molasses medium before being mated with wild-type males 4 days later. Females that successfully mated were then kept individually and their eggs were counted for 5 consecutively days. Females were then sacrificed and examined for Kir2.1::tdTomato or mCD8::GFP expression in oviDNs by immunofluorescence staining and confocal microscopy.
Neuron tracing in FAFB.
Neuron skeletons in a serial section transmission electron microscopy volume of the adult female Drosophila brain15 were manually traced using the annotation software CATMAID31 (http://www.catmaid.org). Neuroanatomical landmarks in the EM volume such as fiber tracts, cell body size and position, and neuropil boundaries were used to search for potential candidates of the oviDNs, SAG and pC1 neurons. The process of finding relevant neurons was consistent for these cell types, relying on distinguishing features such as cell body position and tract orientation, and overall dendritic projection patterns in the confocal images. We then searched for corresponding areas of cell body position in the EM volume and followed the primary neurite emerging from the cell body as it formed fiber bundles and traversed the brain in an orientation that matched the data in the confocal images. Just enough of the primary and secondary neurites (backbone) of each potential candidate was traced to compare with confocal data, and neurons that lacked prominent morphological features in the EM volume were eliminated from consideration. Three oviDNs, five pC1 neurons and one SAG neuron were found in each hemisphere. The morphologies of oviDNs and pC1 neurons varied slightly within each group. One oviDNa, one oviDNb and the pC1a, pC1c and pC1e neurons on the right hemisphere were traced to completion. Synapses were marked on these neurons using previously described criteria for a chemical synapse15. In brief, we annotated instances where the oviDNs, SAG, and pC1 neurons were presynaptic and postsynaptic. Presynaptic locations were identified by the presence of a T-bar at an active zone with vesicles, and postsynaptic sites by the presence of postsynaptic densities (PSDs) across a synaptic cleft. At presynaptic locations in the oviDNa, SAG and pC1 neurons we identified postsynaptic neurons that contained PSDs and marked these as downstream partners; and at sites where PSDs were present in the oviDNa, SAG, and pCl neurons, we identified locations of T-bars in the presynaptic neurons and marked these as upstream partners. Only upstream partners of oviDNb were identified and marked.
One oviIN and one oviEN were identified as upstream partners in FAFB with the most connections to oviDNs. We traced both neurons just enough to confirm their identity. We then traced their arbors within the SMP neuropil to completion as there was significant overlap with the oviDNs in this neuropil. Within the SMP, we identified and marked all synapses between all neurons of interest (oviIN, oviEN, three oviDNs and five pCl neurons).
Electrophysiology.
For ex vivo patch recordings, fly aged 3–5d was immobilized on ice for ~30s, and its nervous system was dissected out in extra-cellular solution (ECS) that contains32 (in millimoles): 103 NaCl, 3 KC1, 5 A-Tris(hydroxymethyl)-methyl-2-aminoethane-sulfonic acid, 10 trehalose, 10 glucose, 2 sucrose, 26 NaHCO3, 1 NaH2PO4, 1.SCacl2, and 4 MgCl2 [pH 7.1 – 7.3 when bubbled with 95% (vol/vol) O2/5% (vol/vol) CO2, ~290 mOsm]. The pia and glia sheath over the somata of interest were carefully removed with fine forceps (Domont #5SF, Fine Science Tools, CA). The explant was subsequently mounted on a Poly-D-lysine (Thermo Fisher) coated coverslip with the somata of the target neurons facing up, and then transferred to an upright Nikon Eclipse FN1 microscope equipped with a 40×/0.8 water-immersion objective (CFI APO NIR, WD = 35 mm, Nikon). A glass micropipette with resistance of 10-15 MΩ (B150-86-7.5, Sutter Instrument, CA) was prepared on a horizontal puller (P-1000, Sutter Instrument), and filled with intracellular solution which has (in millimoles): 140 K-gluconate, 10 HEPES, 1 KC1, 4 MgATP, 0.5 Na3GTP, 1 EGTA, and 1% neurobiotin (SP-1120, Vector Laboratories, CA) (pH near 7.3, ~285 mOsm). Cytoplasmic GCaMP6s33 was expressed in the neurons of interest and visualized under 470 nm illumination to guide placement of the electrode. After obtaining a whole-cell patch, the data were collected with a Multiclamp 700B amplifier (Molecular Devices, CA), low-pass filtered at 2 kHz and acquired at 10 kHz with a Digidata 1440A digitizer (Molecular Devices, CA), and analyzed offline in MATLAB (MathWorks, MA). A small hyperpolarizing current (< 10 pA) was injected to hold the membrane potential around -65 mV. For Chrimson activation, a 625 nm fiber-coupled LED (M625F1, Thorlabs, NJ) was placed ~5 mm away from and pointed to either the brain or ventral nerve cord (power intensity is ~2 mW/mm2). Light stimulations were controlled by using Clampex (Molecular Devices, CA) via the digitizer. For blocking nicotinic acetylcholine receptors or chloride channels, samples were bathed in ECS containing mecamylamine (10 μM, M9020, Sigma-Aldrich, MO) or picrotoxin (150 μM, P1675, Sigma-Aldrich), respectively, for 15 min to allow the action of the antagonists.
Calcium imaging.
Calcium imaging was performed at 21 °C on a customized two-photon microscope equipped with a 12 kHz resonant scanner (CRS 12 KHz, Cambridge Technology, MA), a piezo objective scanner (P-725K129, Physik Instrumente, Germany) with a controller (E-709, Physik Instrumente, Germany), and an Apo LWD 25×/1.1 water immersion objective (Nikon). Z-stacks of 40 frames of either 512 × 512 pixels or 600 × 512 pixels were taken at 0.99 Hz to cover a volume of the sample, and GCaMP6s signal was captured by a photomultiplier tube (Hamamatsu Photonics, Japan) under the illumination of a two-photon laser (Chameleon, Coherent, CA) tuned to 920 nm. The software ScanImage (Vidrio Technologies, VA) was used to control image acquisition and synchronize stimulations. Each imaging session produced 260 volumes and lasted ~260 s. The samples were continuously perfused with ECS.
For ex vivo imaging, flies aged 4-6 days were immobilized on ice for ~30 s. The nervous system was then dissected out in ECS and mounted on a poly-D-lysine coated coverslip. After being placed under the objective, a 625 nm fiber-coupled LED (M625F1, Thorlabs, NJ) was placed ~5 mm away from and pointed to the brain (power intensity is ~2 mW/mm2) to provide light stimulations.
For in vivo imaging, fly aged 4-6 days was immobilized on ice for ~5 min and then inserted into a rectangular hole (1.8mm × 1 mm) on a thin plastic sheet which was the bottom of a customized imaging chamber. The orientation of the fly’s head was adjusted so that the antennae were beneath the plastic sheet, and the posterior head cuticle was facing above. Small amounts of UV curing adhesive (Loctite 352, Henkel, Germany) were applied at gaps between the fly and the hole to fix the fly in position, with a brief (~10 s) UV irradiation (CS2010, Thorlabs, NJ). Fly’s six legs and abdomen could move freely. After filling the chamber with ECS, an observation window was open on the head cuticle over the posterior part of the brain, and fat tissue as well as trachea covering the posterior brain were gently removed with forceps. The esophagus and muscles #1 and #16 were cut to minimize the movement of samples. A small plastic stage (~1 cm in diameter) was placed at ~5 mm underneath the fly, and a manipulator (MP-285, Sutter Instrument, CA) was used to elevate the stage to let the fly legs touch and stand on the stage for a period of time. The stage was either covered with 1% plain agarose, 1% agarose containing 150 mM sucrose, or nothing. Each touch lasts ~10 s (10 volumes) with ~30 s (30 volumes) intervals.
Analysis of calcium imaging data was done offline in Fiji34 and MATLAB. Briefly, z-stacks from each imaging session were averaged across all 260 time points to get a z-stack with a higher signal-to-noise ratio, which was used as a reference for identification of interested neurons or neurites. Then, slices covering the interested neurons or neurites were averaged at each time point to get a time-series of projection images. Sample movements during the imaging session were corrected by using TurboReg35 in Fiji. Regions of interest (ROIs) were then selected by drawing polygons on the corrected time-series. For each ROI, the time course of GCaMP6s signal was obtained by averaging the fluorescence intensity of every pixel inside that ROI at each time point. The averaged fluorescence values over 10 time points before and after the onset of each stimulus were used as the baseline (F0) and response (F), respectively. The absolute fluorescence intensity change (∆F) was calculated by subtracting F0 from F, and the fluorescence intensity changes related to baseline (∆F/F0) in each ROIs were obtained.
Immunofluorescence staining.
Most of the immunofluorescence staining were performed by following the standard protocols described previously36. Detailed protocols for double label staining, polarity staining, and stochastic labelling in multiple colors are available online (https://www.janelia.org/project-team/flylight/protocols). For determining cell types labeled by a particular split-Gal4 driver, polarity staining was used to count the total number of cells, while stochastic labelling in multiple colors was performed to reveal morphology of individual cells. Fluorescent in situ hybridization (FISH) was performed as described previously37.
For staining of Kir::tdTomato and mCD8::GFP, the central nervous system (CNS) was prepared in ECS and fixed in 4% paraformaldehyde (PFA; sc-821692, Santa Cruz, TX) at 22 °C for 15 min. After being washed in phosphate-buffered saline containing 0.5% (vol/vol) Triton X-100 (PBT) for 30 min at 22 °C, the sample was incubated in blocking buffer (Cat# 50062Z, Thermo Fisher) containing primary antibodies which include rabbit anti-dsRed (1:500, Cat# 632496, Takara Bio), chicken anti-GFP (1:500, Cat# A10262, Thermo Fisher), and mouse anti-Bruchpilot (nc82, 1:25, DSHB, IA) for 24–48 hr at 4 °C. The sample was then washed in PBT for 2 hr before being incubated in blocking buffer containing secondary antibodies, which are AF546-conjugated goat-anti-rabbit (1:300, Cat# A11035, Thermo Fisher), AF488-conjugated goat-anti-chicken (1:300, Cat# A32931, Thermo Fisher), and AF647-conjugated goat-anti-mouse (1:300, Cat# A21235, Thermo Fisher) at 4 °C for 24 hr. After being washed in PBT for 30 min at 22 °C, the sample was dehydrated and mounted on a slide.
For staining of neurobiotin loaded into neurons during whole-cell recording, the CNS was dissected out and processed as described above, except that AF647-conjugated streptavidin (1:500, Cat# S21374, Thermo Fisher) was included in primary and secondary antibodies, and AF405-conjugated goat-anti-mouse (1:300, Cat# A31553, Thermo Fisher) was used instead of AF647-conjugated goat-anti-mouse antibody.
Dehydration and DPX mounting.
After incubation with secondary antibodies, the sample was washed in PBT for 15min, fixed in 4% PFA for 10min, and sequentially dehydrated for 5 min in 30%, 50%, and 75% ethanol. The sample was mounted onto a poly-D-lysine coated coverslip in 75% ethanol, and further dehydrated in 100% ethanol for 10 min. The coverslip was then submerged in xylene (X5, Fisher Scientific) for 5min, before being mounted to a drop of DPX mountant (Cat# 50-980-370, Fisher Scientific) on a slide. The slide was left to dry for 24 hr before performing confocal microscopy.
Confocal microscopy and image analysis.
Confocal imaging was performed either under an LSM 800 inverted confocal microscope (ZEISS, Germany) or under an LSM 880 inverted confocal microscope (ZEISS), with a Plan-Apochromat 20×/0.8 M27 objective or a Plan-Apochromat 63×/1.4 oil immersion objective (ZEISS). Images were captured by using ZEN software (ZEISS), and later analyzed by using Fiji34 and VVDViewer (https://github.com/takashi310/WD_Viewer).
Behavioural assays and analysis.
The flies used in behavioural assays were sorted and collected under light CO2 anesthesia 1–6 h after eclosion. Virgin females were kept in groups of 3–10 flies in vials, and males were singly housed in small food chambers (7 mm × 7 mm × 35 mm). Flies used in optogenetic assays were reared on food containing 0.2 mM all-trans-retinal (Sigma-Aldrich) in darkness, prior to and post eclosion.
For evaluating egg-laying by virgin females, 4–5 flies were grouped on standard cornmeal-agar-molasses medium in single vials. The flies were transferred to new vials containing fresh food every 24 hours (at ~ZT 2), and the number of eggs laid in each vial was manually counted under a stereo microscope. For evaluating egg-laying by mated females, virgin females were first mated with wild-type males in courtship chambers (diameter = 10 mm, height = 2 mm), and subsequently kept individually in vials containing protein-enriched medium, or, for the stochastic unsilencing experiments, standard cornmeal-agar-molasses medium. The number of laid eggs was counted as described above every 24 hours.
For the experiment in which the position of eggs in the reproductive organs was determined, female flies were flash-frozen in liquid nitrogen and subsequently dissected in ECS under a stereo microscope. The reproductive organs were carefully uncovered by removing the cuticle over the ventral abdomen, and the presence of egg in uterus, oviducts, and ovaries were assessed.
For examination of natural oviposition, 30 virgin females aged 4–6 d and 35 wild-type males aged 3–5 d were grouped in a food vial containing wet yeast paste, which boosts egg production while preventing the females from laying lots of eggs. After 4–5 d, single females were transferred by gentle aspiration into an observation chamber (10 mm × 30 mm × 10 mm, with a 5 mm × 10 mm groove at the center). A small amount of cornmeal-agar-molasses medium was placed in the central groove as an egg-laying substrate. The chamber was kept in darkness with infrared illumination (880 nm) from below. The behaviour of the female around the food was videotaped from the side at a rate of 30 frames-per-second (fps) for 20 min.
For optogenetic activation, females were kept in darkness before being transferred into the observation chamber (diameter = 10 mm or 18 mm, height = 2 mm) by gentle aspiration. A customized LED panel capable of emitting infrared (880 nm) and red light (635 nm) was placed beneath the chamber to provide uniform backlight for the camera as well as red light stimulations. The intensity and temporal pattern of light were controlled by using customized program written in MATLAB. A camera (Manta-125C, Allied Vision) was placed above the chamber to videotape the behaviour of fly at 30 fps. The IR-cut filter come along with the camera was removed to allow the detection of infrared light.
For high-speed videotaping with optogenetic activation, we modified the setup from ref. 38. Briefly, individual females climbed upwards through a tunnel to a rectangular platform (4 mm × 2 mm) which is surrounded by a groove filled with water. The platform was illuminated by infrared light (850 nm) and was focused by LEDs providing light stimulations (5 s of continuous 625 nm illumination of 200 μW/mm2). The fly’s behaviour on the platform was videotaped (Ace, Basler) from the side at a rate of 200 fps.
To analyze the actions performed by female flies during natural or light-induced oviposition behaviour, videos were manually analyzed offline. Three actions, including abdomen bending, ovipositor extrusion, and egg deposition, were analyzed. Abdomen bending was defined as frames in which the abdomen was bent such that a line connecting the haltere and the abdominal tip came to meet at an angle of 15° or larger to the thoracic midline. Ovipositor extrusion was defined as any frame in which female’s ovipositor was extruded. Egg deposition was defined as frame in which an egg was laid on the substrate.
For receptivity assays, one virgin female aged 3–6 d and one wild-type male aged for 3–5 d were transferred into a courtship chamber (diameter =10 mm, height = 2 mm) by gentle aspiration, and videotaped under white light illumination for a period of 30 min. The copulation rate was checked every 2 min.
For egg-laying preference assays, we adapted a setup developed previously21. Briefly, 30 virgin females aged 4–6 d and 35 wild-type males aged 3–5 d were grouped in a food vial containing wet yeast paste, which boosts egg production but limits egg deposition. After 4–5 d, single females were gently aspirated into the observation chamber, which contains two 1% agarose grooves, one with and one without sucrose. The female’s behaviour was videotaped for 12 hr and the eggs laid were counted. The preference index was calculated as the difference between egg numbers on two grooves divided by the total number of eggs.
Statistics.
All egg-laying and electrophysiology data were analyzed by unpaired Wilcoxon signed-rank test. Egg position data were analyzed by Fischer’s exact test. All the statistical analyses were performed using R software or MATLAB.
Extended Data
Extended Data Fig. 1 |. Split-GAL4 driver lines targeting oviDN, SPSN, SAG, pC1, oviEN, and oviIN neurons.
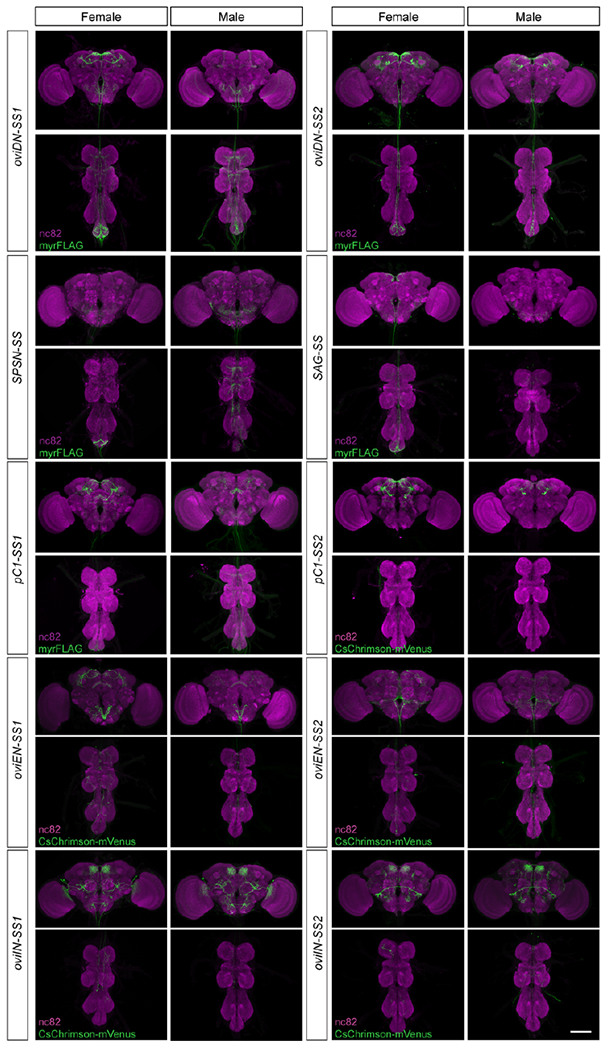
Confocal images of CNSs from female and male flies carrying the indicated split-GAL4 driver lines as well as UAS-myrFLAG or UAS-CsChrimson-mVenus. Samples were stained with mAb nc82 to reveal all synapses (magenta) and anti-FLAG or anti-GFP to reveal membranes of targeted neurons (green). Scale bar: 100 μm. Both oviDN-SS1 and oviDN-SS2 label a single oviDNa and a single oviDNb cell in each hemisphere; oviDN-SS2 also weakly labels an unrelated cell (pMP1) that is present in both sexes.
Extended Data Fig. 2 |. Expression of fru and dsx in oviDNs and pC1 neurons.
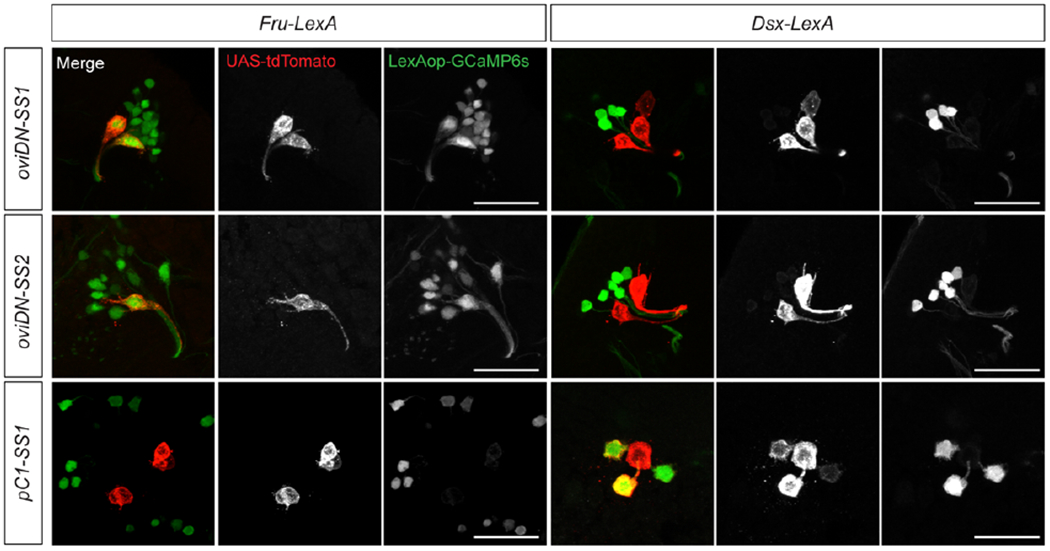
Confocal images of female brains showing the co-labelling of oviDN-SS lines with fru-LexA but not dsx-LexA, and of pC1-SS1 line with dsx-LexA but not fru-LexA. Scale bars: 20 μm.
Extended Data Fig. 3 |. Neurotransmitter types revealed by FISH.
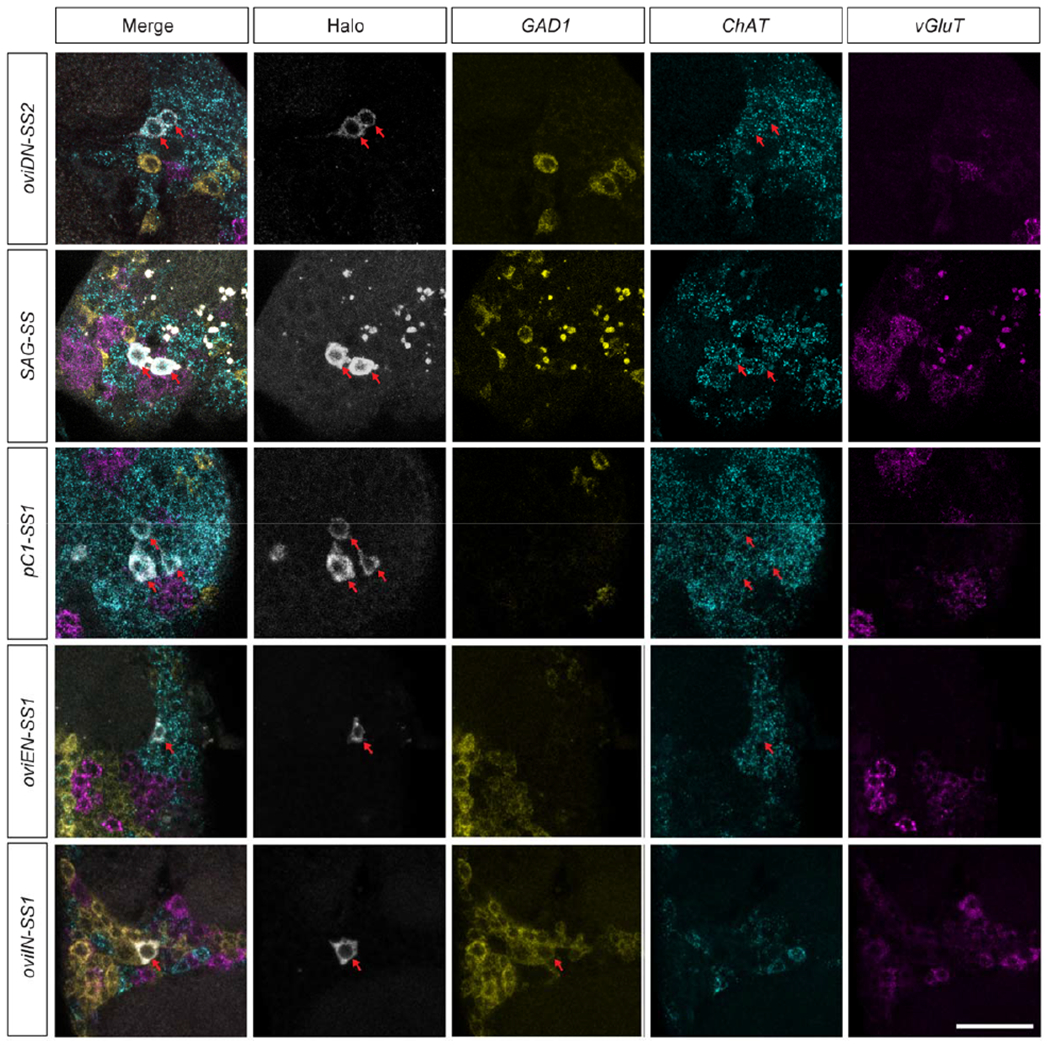
Confocal images showing the expression of GAD1, ChAT, and vGluT in oviDN, SAG, pC1, oviEN, and oviIN neurons in female brains. Red arrows indicate cell bodies of interest. Scale bars: 20 μm.
Extended Data Fig. 4 |. oviDNs are required for oviposition but not copulation.
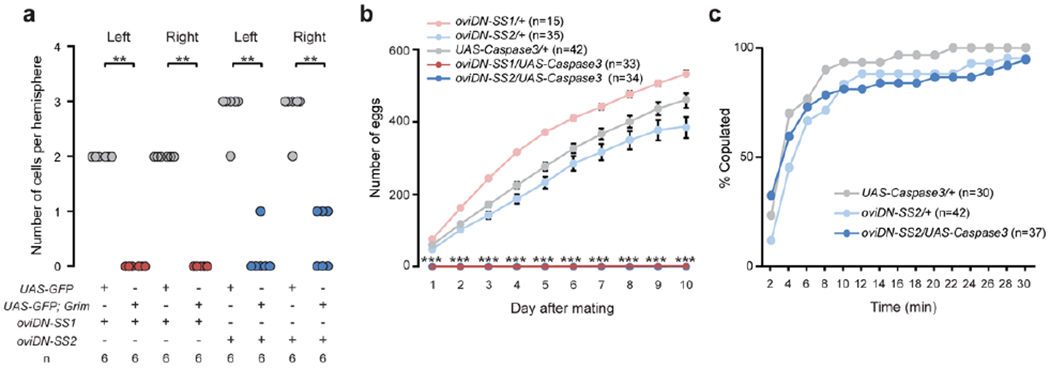
a, Number of GFP-expressing neurons in female brains of indicated genotypes. **, P < 0.01, Wilcoxon test. b, Time course showing the total number of eggs laid by individual mated females over 10 consecutive days after mating, shown as mean ± s.e.m. Note zero values for both oviDN-ablated genotypes at all time points. ***, P < 0.001, Wilcoxon test. c, Cumulative traces showing the percentage of females copulating over a 30-min observation period.
Extended Data Fig. 5 |. Stochastic labelling and unsilencing of oviDNs.
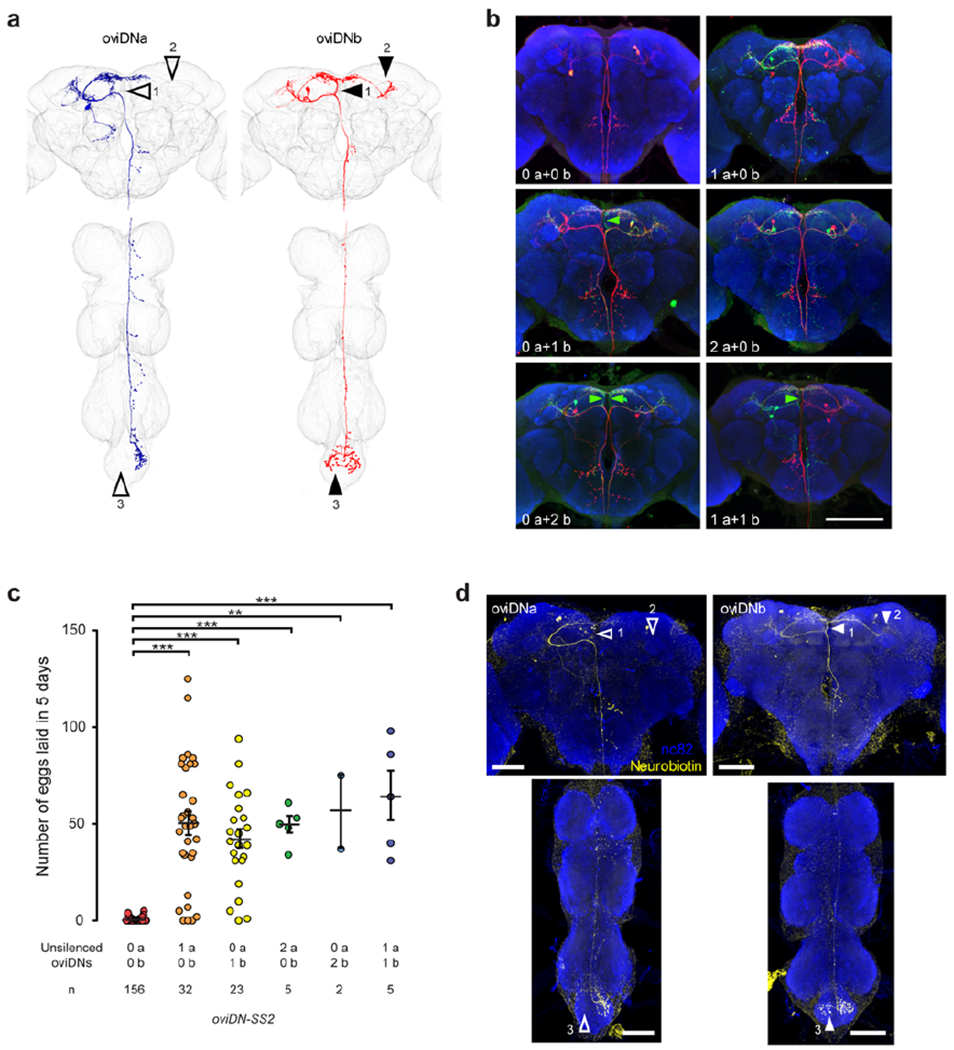
a, Images of two female samples in which a single oviDNa or oviDNb cell is labeled, as shown in Fig. 1b, marked with arrowheads to indicate branches that are present in oviDNb (solid) but absent in oviDNa (open). The branch pointed by arrowhead 1 was primarily used to distinguish oviDNa from oviDNb. b, Example images of brains in which oviDNs were either silenced (red, Kir2.1::tdTomato) or unsilenced (green, mCD8::GFP). The complement of unsilenced oviDNs in each sample is indicated. Green arrowheads indicate distinctive branches of oviDNb. Brains were counter-stained with nc82 (blue). Scale bar: 100 μm. c, Number of eggs laid during 5 days after mating by mated females with different oviDNs unsilenced, shown as scatter plots with mean ± s.e.m. ***, P < 0.001, **, P < 0.01, Wilcoxon test. d, Confocal images of two samples in which a single oviDN was loaded with neurobiotin during whole-cell recording. The samples were stained with streptavidin (to reveal the recorded cell, yellow) and mAb nc82 (blue). Arrowheads indicate oviDNb-specific branches. Scale bars: 100 μm.
Extended Data Fig. 6 |. Sequence of oviposition actions upon oviDN stimulation.
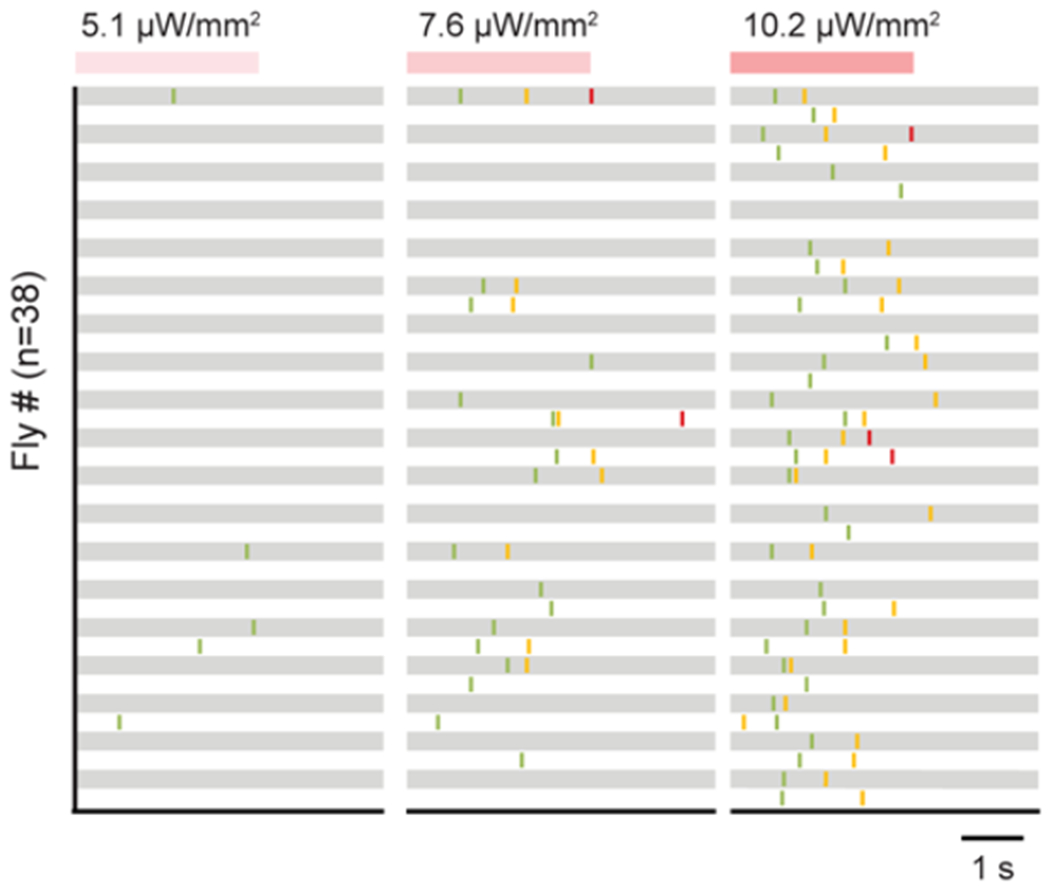
Example ethograms showing the onsets of oviposition actions in mated females upon photoactivation (3 s) of oviDNs at varying light intensities. Each row represents a single female.
Extended Data Fig. 7 |. Anatomical and functional characterization of pC1 neurons.
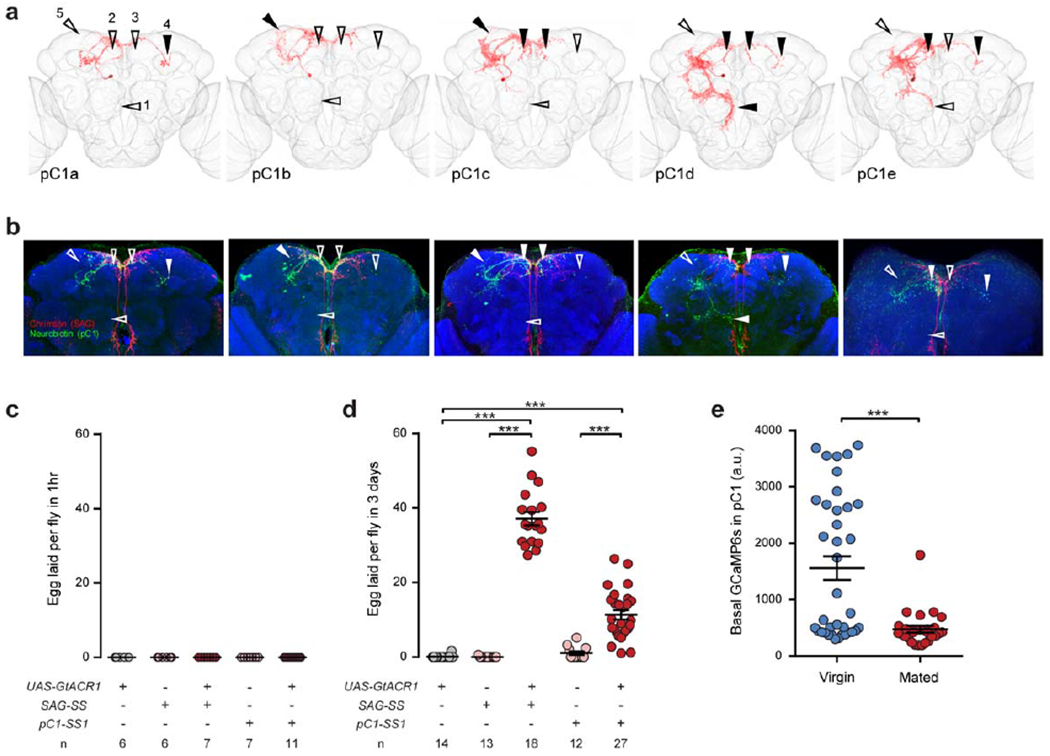
a. Confocal images of single pC1 neurons in the female brain, as in Fig. 3d, marked with arrowheads to indicate the presence (solid) or absence (open) of subtype-specific branches. b, Confocal images of neurobiotin-filled pC1 neurons from which whole-cell patch recordings were obtained, indicating the branches used for subtype identification as in a. c, d, Number of eggs laid by virgin females during a 1-hr (c) or 3-d (d) period in which either SAG or pC1 neurons were optogenetically silenced, shown as scatter plots with mean ± s.e.m. ***, P < 0.001, Wilcoxon test. e, Basal GCaMP6s signals in pC1 cell bodies in virgin and mated females, shown as scatter plots with mean ± s.e.m. ***, P < 0.001, Wilcoxon test.
Extended Data Fig. 8 |. Egg-laying substrate preferences and substrate-evoked calcium responses in oviDN, oviEN, and oviIN.
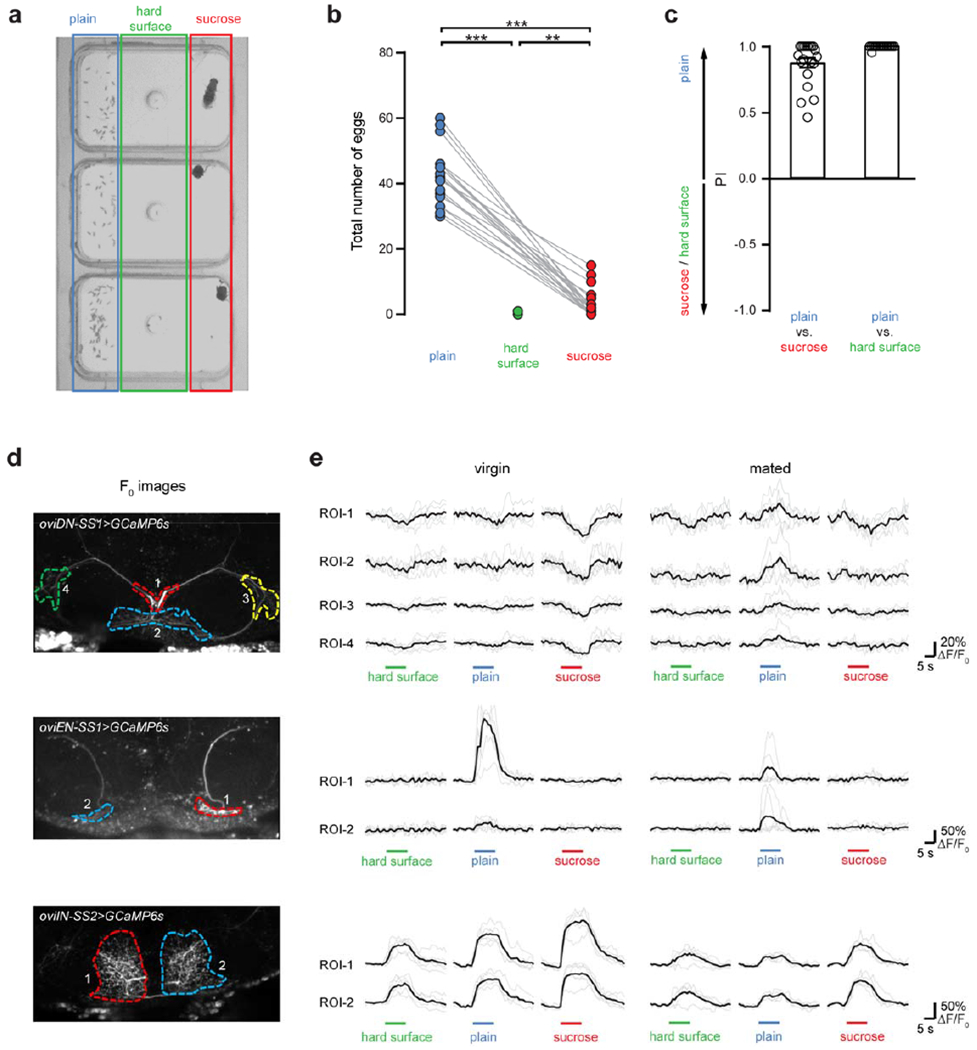
a, Snapshot of egg-laying chambers in each of which an individual mated female had laid numerous eggs. Plain agarose (blue box), agarose containing 150mM sucrose (red box), and plastic surface (green box) are indicated. b, Plots showing total number of eggs laid by individual mated female in 12-hr observation. c, Preference indices showing preference of female flies in laying eggs on different substrates. Preference index is calculated as (number of eggs on plain agarose – number of eggs on other substrate) / total number of eggs. Data are shown as mean ± s.e.m. **, P < 0.01, ***, P < 0.001, Wilcoxon test. d, Projected images of oviDNs (top), oviENs (middle), and oviINs (bottom) expressing GCaMP6s, showing regions-of-interest (ROIs) for quantification. e, Example ΔF/F0 traces for each ROI upon presentation of the indicated substrates, in virgin (left) and mated (right) females. Horizontal bars indicate presentation of the substrate. Darker traces are averaged from 6 trials (lighter traces).
Extended Data Table 1 |.
Synaptic connections identified by EM reconstruction.
| Post | |||||||||||||
|---|---|---|---|---|---|---|---|---|---|---|---|---|---|
| Pre | Cell ID | SAG_R | SAG_L | pC1a | pC1b | pC1d | pC1d | pC1e | oviIN | oviEN | oviDNa | oviDNa | oviDNb |
| SAG_R# | 5353954 | 0 | 0 | 173 | 17 | 78 | 0 | 2 | 0 | 0 | 0 | 0 | 1 |
| SAG_L# | 4358525 | 0 | 0 | 79 | 2 | 19 | 0 | 0 | 0 | 0 | 0 | 0 | 0 |
| pC1a* | 3807213 | 4 | 1 | 3 | 40 | 85 | 20 | 7 | 0 | 0 | 0 | 0 | 1 |
| pC1b# | 3781622 | 0 | 0 | 0 | 0 | 6 | 0 | 0 | 0 | 0 | 0 | 0 | 0 |
| pC1c* | 3794184 | 0 | 0 | 5 | 6 | 0 | 10 | 23 | 2 | 0 | 1 | 0 | 0 |
| pC1d# | 3778246 | 0 | 0 | 2 | 0 | 5 | 0 | 10 | 20 | 0 | 1 | 0 | 0 |
| pC1e* | 1269969 | 0 | 0 | 1 | 3 | 4 | 5 | 4 | 31 | 0 | 0 | 0 | 0 |
| oviIN# | 6244095 | 0 | 0 | 0 | 0 | 75 | 0 | 78 | 0 | 176 | 20 | 35 | 29 |
| oviEN# | 1259227 | 0 | 0 | 2 | 0 | 0 | 0 | 6 | 136 | 0 | 118 | 42 | 142 |
| oviDNa# | 5143347 | 0 | 0 | 0 | 0 | 1 | 0 | 1 | 0 | 0 | 0 | 0 | 0 |
| oviDNa# | 1875105 | 0 | 0 | 0 | 0 | 0 | 0 | 0 | 0 | 0 | 0 | 1 | 0 |
| oviDNb# | 1862763 | 0 | 0 | 0 | 0 | 0 | 0 | 0 | 0 | 0 | 0 | 0 | 0 |
fully-traced cells.
partially-traced cells. SAG_R and SAG_L indicate right and left hemisphere SAG cells, respectively. All other neurons are right hemisphere cells.
Extended Data Table 2 |. oviDN inputs identified by EM reconstruction.
Number of synaptic connections identified between various input neurons and the right hemisphere oviDNa and oviDNb cells. R and L indicate soma location in right (ipsilateral) or left (contralateral) hemisphere; N.D., soma not identified.
| Cell ID | Hemisphere | Cell type | oviDNa (5143347) | oviDNa (1875105) | oviDNb (1862763) | Total |
|---|---|---|---|---|---|---|
| 1259227 | R | oviEN | 118 | 42 | 142 | 302 |
| 6244095 | R | oviIN | 20 | 35 | 29 | 84 |
| 3353966 | R | 31 | 1 | 27 | 59 | |
| 4634382 | R | 3 | 38 | 16 | 57 | |
| 2361058 | R | 19 | 10 | 15 | 44 | |
| 1334539 | L | 21 | 2 | 13 | 36 | |
| 5870279 | L | oviIN | 6 | 10 | 11 | 27 |
| 5390561 | R | 8 | 0 | 16 | 24 | |
| 4590002 | N.D. | 16 | 4 | 3 | 23 | |
| 1879478 | R | 0 | 21 | 1 | 22 | |
| 2141316 | R | 4 | 11 | 7 | 22 | |
| 11122221 | R | 13 | 1 | 8 | 22 | |
| 2360875 | R | 1 | 17 | 0 | 18 | |
| 8460445 | L | 13 | 0 | 4 | 17 | |
| 2712415 | R | 2 | 13 | 1 | 16 | |
| 3243035 | R | 7 | 0 | 9 | 16 | |
| 5330678 | L | 13 | 0 | 3 | 16 | |
| 4295394 | L | 9 | 0 | 6 | 15 | |
| 7054780 | N.D. | 9 | 0 | 6 | 15 | |
| 2232454 | R | 0 | 14 | 0 | 14 | |
| 2613258 | R | 0 | 13 | 1 | 14 | |
| 3188249 | R | 8 | 2 | 4 | 14 | |
| 1576051 | R | 0 | 0 | 13 | 13 | |
| 5470288 | N.D. | 9 | 0 | 4 | 13 | |
| 3588146 | R | 5 | 2 | 5 | 12 | |
| 4344860 | R | 5 | 1 | 5 | 11 | |
| 5316770 | R | 10 | 1 | 0 | 11 | |
| 5325544 | R | 10 | 0 | 1 | 11 | |
| 5431073 | L | 5 | 0 | 6 | 11 | |
| 6759088 | L | 8 | 0 | 3 | 11 | |
| 7021239 | L | 0 | 11 | 0 | 11 | |
| 7532739 | N.D. | 4 | 0 | 7 | 11 | |
| 2255653 | R | 6 | 0 | 4 | 10 | |
| 3709065 | N.D. | 0 | 8 | 2 | 10 | |
| 9040679 | L | oviEN | 0 | 8 | 2 | 10 |
Supplementary Material
Acknowledgements
We thank the Janelia FlyLight, Fly Facility, Project Technical Resources, Molecular Biology, Functional Connectome, and Experimental Technology teams for technical assistance, Amelia Edmonson-Stait and Greg Jefferis for initial tracing of one of the oviIN cells, Ulrike Heberlein, Kai Feng and Vikram Vijayan for comments on the manuscript, and Vikram Vijayan and Gaby Maimon for sharing preliminary oviDN calcium imaging data. This work was funded by the Howard Hughes Medical Institute.
Footnotes
Supplementary Information
Supplementary Tables 1 and 2 and Videos 1-5 are linked to the online version of this paper at www.nature.com/nature
The authors declare no competing interests.
References
- 1.Kubli E The sex-peptide. Bioessays 14, 779–784, doi: 10.1002/bies.950141111 (1992). [DOI] [PubMed] [Google Scholar]
- 2.Yapici N, Kim YJ, Ribeiro C & Dickson BJ A receptor that mediates the post-mating switch in Drosophila reproductive behaviour. Nature 451, 33–37, doi: 10.1038/nature06483 (2008). [DOI] [PubMed] [Google Scholar]
- 3.Hasemeyer M, Yapici N, Heberlein U & Dickson BJ Sensory neurons in the Drosophila genital tract regulate female reproductive behavior. Neuron 61, 511–518, doi: 10.1016/j.neuron.2009.01.009 (2009). [DOI] [PubMed] [Google Scholar]
- 4.Yang CH et al. Control of the postmating behavioral switch in Drosophila females by internal sensory neurons. Neuron 61, 519–526, doi: 10.1016/j.neuron.2008.12.021 (2009). [DOI] [PMC free article] [PubMed] [Google Scholar]
- 5.Feng K, Palfreyman MT, Hasemeyer M, Talsma A & Dickson BJ Ascending SAG neurons control sexual receptivity of Drosophila females. Neuron 83, 135–148, doi: 10.1016/j.neuron.2014.05.017 (2014). [DOI] [PubMed] [Google Scholar]
- 6.Auer TO & Benton R Sexual circuitry in Drosophila. Curr Opin Neurobiol 38, 18–26, doi: 10.1016/j.conb.2016.01.004 (2016). [DOI] [PubMed] [Google Scholar]
- 7.Kvitsiani D & Dickson BJ Shared neural circuitry for female and male sexual behaviours in Drosophila. Curr Biol 16, R355–356, doi: 10.1016/j.cub.2006.04.025 (2006). [DOI] [PubMed] [Google Scholar]
- 8.Demir E & Dickson BJ fruitless splicing specifies male courtship behavior in Drosophila. Cell 121, 785–794, doi: 10.1016/j.cell.2005.04.027 (2005). [DOI] [PubMed] [Google Scholar]
- 9.Kupfermann I & Weiss KR Command Neuron Concept. Behav Brain Sci 1, 3–10, doi:Doi 10.1017/S0140525x00059057 (1978). [DOI] [Google Scholar]
- 10.Luan HJ, Wan KH, Peabody NC & White BH Dissection of a neuronal network required for wing expansion using a novel split Gal4 system. J Neurogenet 20, 168–169 (2006). [Google Scholar]
- 11.Dionne H, Hibbard KL, Cavallaro A, Kao JC & Rubin GM Genetic Reagents for Making Split-GAL4 Lines in Drosophila. Genetics 209, 31–35, doi: 10.1534/genetics.118.300682 (2018). [DOI] [PMC free article] [PubMed] [Google Scholar]
- 12.Tirian L & Dickson BJ The VT GAL4, LexA, and split-GAL4 driver line collections for targeted expression in the Drosophila nervous system. bioRxiv DOI: 10.1101/198648 (2017). [DOI] [Google Scholar]
- 13.Klapoetke NC et al. Independent optical excitation of distinct neural populations. Nat Methods 11, 338–346, doi: 10.1038/Nmeth.2836 (2014). [DOI] [PMC free article] [PubMed] [Google Scholar]
- 14.Nern A, Pfeiffer BD & Rubin GM Optimized tools for multicolor stochastic labeling reveal diverse stereotyped cell arrangements in the fly visual system. P Natl Acad Sci USA 112, E2967–E2976, doi: 10.1073/pnas.1506763112 (2015). [DOI] [PMC free article] [PubMed] [Google Scholar]
- 15.Zheng ZH et al. A Complete Electron Microscopy Volume of the Brain of Adult Drosophila melanogaster. Cell 174, 730–743, doi: 10.1016/j.cell.2018.06.019 (2018). [DOI] [PMC free article] [PubMed] [Google Scholar]
- 16.Yang CH, Belawat P, Hafen E, Jan LY & Jan YN Drosophila egg-laying site selection as a system to study simple decision-making processes. Science 319, 1679–1683, doi: 10.1126/science.1151842 (2008). [DOI] [PMC free article] [PubMed] [Google Scholar]
- 17.Kimura K, Sato C, Koganezawa M & Yamamoto D Drosophila ovipositor extension in mating behavior and egg deposition involves distinct sets of brain interneurons. PLoS One 10, e0126445, doi: 10.1371/journal.pone.0126445 (2015). [DOI] [PMC free article] [PubMed] [Google Scholar]
- 18.McKellar CE et al. Threshold-based ordering of sequential actions during Drosophila courtship. Curr Biol 29, 3 (2019). [DOI] [PubMed] [Google Scholar]
- 19.Zhou C, Pan YF, Robinett CC, Meissner GW & Baker BS Central Brain Neurons Expressing doublesex Regulate Female Receptivity in Drosophila. Neuron 83, 149–163, doi: 10.1016/j.neuron.2014.05.038 (2014). [DOI] [PubMed] [Google Scholar]
- 20.Cury KM, Prud’homme B & Gompel N A short guide to insect oviposition: when, where and how to lay an egg. JNeurogenet 33, 75–89, doi: 10.1080/01677063.2019.1586898 (2019). [DOI] [PubMed] [Google Scholar]
- 21.Gou B, Zhu E, He R, Stern U & Yang CH High Throughput Assay to Examine EggLaying Preferences of Individual Drosophila melanogaster. J Vis Exp, e53716, doi: 10.3791/53716 (2016). [DOI] [PMC free article] [PubMed] [Google Scholar]
- 22.Thomas A Nervous Control of Egg Progression into the Common Oviduct and Genital Chamber of the Stick-Insect Carausius-Morosus. J Insect Physiol 25, 811-+, doi:Doi 10.1016/0022-1910(79)90084-2 (1979). [DOI] [Google Scholar]
- 23.Bath DE et al. FlyMAD: rapid thermogenetic control of neuronal activity in freely walking Drosophila. Nat Methods 11, 756–762, doi: 10.1038/nmeth.2973 (2014). [DOI] [PubMed] [Google Scholar]
- 24.Inagaki HK et al. Optogenetic control of Drosophila using a red-shifted channelrhodopsin reveals experience-dependent influences on courtship. Nat Methods 11, 325–332, doi: 10.1038/nmeth.2765 (2014). [DOI] [PMC free article] [PubMed] [Google Scholar]
- 25.von Philipsborn AC et al. Neuronal control of Drosophila courtship song. Neuron 69, 509–522, doi: 10.1016/j.neuron.2011.01.011 (2011). [DOI] [PubMed] [Google Scholar]
- 26.Ribeiro IMA et al. Visual Projection Neurons Mediating Directed Courtship in Drosophila. Cell 174, 607–621 e618, doi: 10.1016/j.cell.2018.06.020 (2018). [DOI] [PubMed] [Google Scholar]
- 27.Backhaus B, Sulkowski E & Schlote FW A semi-synthetic, general-purpose medium for Drosophila melanogaster. Dros. Inf. Serv. 60, 210–212 (1984). [Google Scholar]
- 28.Jenett A et al. A GAL4-Driver Line Resource for Drosophila Neurobiology. Cell Rep 2, 991–1001, doi: 10.1016/j.celrep.2012.09.011 (2012). [DOI] [PMC free article] [PubMed] [Google Scholar]
- 29.Shirangi TR, Wong AM, Truman JW & Stern DL Doublesex Regulates the Connectivity of a Neural Circuit Controlling Drosophila Male Courtship Song. Dev Cell 37, 533–544, doi: 10.1016/j.devcel.2016.05.012 (2016). [DOI] [PubMed] [Google Scholar]
- 30.Otsuna H, Ito M & Kawase T Color depth MIP mask search: a new tool to expedite Split-GAL4 creation. bioRxiv DOI: 10.1101/318006 (2018). [DOI] [Google Scholar]
- 31.Schneider-Mizell CM et al. Quantitative neuroanatomy for connectomics in Drosophila. Elife 5, doi: 10.7554/eLife.12059 (2016). [DOI] [PMC free article] [PubMed] [Google Scholar]
- 32.Wilson RI & Laurent G Role of GABAergic inhibition in shaping odor-evoked spatiotemporal patterns in the Drosophila antennal lobe. JNeurosci 25, 9069–9079, doi: 10.1523/JNEUROSCI.2070-05.2005 (2005). [DOI] [PMC free article] [PubMed] [Google Scholar]
- 33.Chen TW et al. Ultrasensitive fluorescent proteins for imaging neuronal activity. Nature 499, 295–300, doi: 10.1038/nature12354 (2013). [DOI] [PMC free article] [PubMed] [Google Scholar]
- 34.Schindelin J et al. Fiji: an open-source platform for biological-image analysis. Nat Methods 9, 676–682, doi: 10.1038/nmeth.2019 (2012). [DOI] [PMC free article] [PubMed] [Google Scholar]
- 35.Thevenaz P, Ruttimann UE & Unser M A pyramid approach to subpixel registration based on intensity. IEEE Trans Image Process 7, 27–41, doi: 10.1109/83.650848 (1998). [DOI] [PubMed] [Google Scholar]
- 36.Wu M et al. Visual projection neurons in the Drosophila lobula link feature detection to distinct behavioral programs. Elife 5, doi: 10.7554/eLife.21022 (2016). [DOI] [PMC free article] [PubMed] [Google Scholar]
- 37.Meissner GW et al. Mapping Neurotransmitter Identity in the Whole-Mount Drosophila Brain Using Multiplex High-Throughput Fluorescence in Situ Hybridization. Genetics 211, 473–482, doi: 10.1534/genetics.118.301749 (2019). [DOI] [PMC free article] [PubMed] [Google Scholar]
- 38.von Reyn CR et al. A spike-timing mechanism for action selection. Nat Neurosci 17, 962–970, doi: 10.1038/nn.3741 (2014). [DOI] [PubMed] [Google Scholar]
- 39.Sutcliffe B et al. Second-Generation Drosophila Chemical Tags: Sensitivity, Versatility, and Speed. Genetics 205, 1399–1408, doi: 10.1534/genetics.116.199281 (2017). [DOI] [PMC free article] [PubMed] [Google Scholar]
- 40.Mellert DJ, Knapp JM, Manoli DS, Meissner GW & Baker BS Midline crossing by gustatory receptor neuron axons is regulated by fruitless, doublesex and the Roundabout receptors. Development 137, 323–332, doi: 10.1242/dev.045047 (2010). [DOI] [PMC free article] [PubMed] [Google Scholar]
- 41.Sweeney ST, Broadie K, Keane J, Niemann H & Okane CJ Targeted Expression of Tetanus Toxin Light-Chain in Drosophila Specifically Eliminates Synaptic Transmission and Causes Behavioral Defects. Neuron 14, 341–351, doi:Doi 10.1016/0896-6273(95)90290-2 (1995). [DOI] [PubMed] [Google Scholar]
- 42.Mohamed GA et al. Optical inhibition of larval zebrafish behaviour with anion channelrhodopsins. Bmc Biol 15, doi:ARTN 103 10.1186/s12915–017-0430–2 (2017). [DOI] [PMC free article] [PubMed] [Google Scholar]
- 43.Robinett CC, Vaughan AG, Knapp J-M & Baker BS Sex and the single cell. II. There is a time and place for sex. PLoSBiol 8: e1000365, doi: 10.1371/journal.pbio.1000365 (2010). [DOI] [PMC free article] [PubMed] [Google Scholar]
Associated Data
This section collects any data citations, data availability statements, or supplementary materials included in this article.


