
Extended Data Fig. 7 |. Anatomical and functional characterization of pC1 neurons.
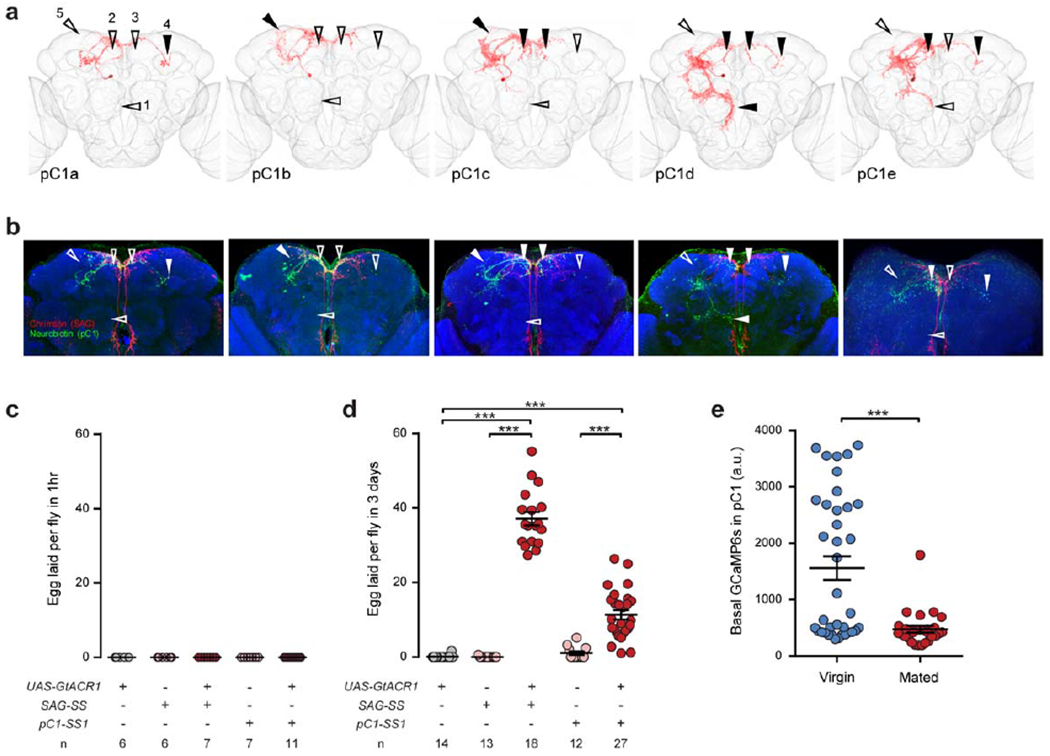
a. Confocal images of single pC1 neurons in the female brain, as in Fig. 3d, marked with arrowheads to indicate the presence (solid) or absence (open) of subtype-specific branches. b, Confocal images of neurobiotin-filled pC1 neurons from which whole-cell patch recordings were obtained, indicating the branches used for subtype identification as in a. c, d, Number of eggs laid by virgin females during a 1-hr (c) or 3-d (d) period in which either SAG or pC1 neurons were optogenetically silenced, shown as scatter plots with mean ± s.e.m. ***, P < 0.001, Wilcoxon test. e, Basal GCaMP6s signals in pC1 cell bodies in virgin and mated females, shown as scatter plots with mean ± s.e.m. ***, P < 0.001, Wilcoxon test.