

Abstract
Multiple sclerosis (MS) is a chronic demyelinating disease of the CNS. Cuprizone (CZ), a copper chelator, is widely used to study demyelination and remyelination in the CNS, in the context of MS. However, the mechanisms underlying oligodendrocyte (OL) cell loss and demyelination are not known. As copper-containing enzymes play important roles in iron homeostasis and controlling oxidative stress, we examined whether chelating copper leads to disruption of molecules involved in iron homeostasis that can trigger iron-mediated OL loss. We show that giving mice (male) CZ in the diet induces rapid loss of OL in the corpus callosum by 2 d, accompanied by expression of several markers for ferroptosis, a relatively newly described form of iron-mediated cell death. In ferroptosis, iron-mediated free radicals trigger lipid peroxidation under conditions of glutathione insufficiency, and a reduced capacity to repair lipid damage. This was further confirmed using a small-molecule inhibitor of ferroptosis that prevents CZ-induced loss of OL and demyelination, providing clear evidence of a copper-iron connection in CZ-induced neurotoxicity. This work has wider implications for disorders, such as multiple sclerosis and CNS injury.
SIGNIFICANCE STATEMENT Cuprizone (CZ) is a copper chelator that induces demyelination. Although it is a widely used model to study demyelination and remyelination in the context of multiple sclerosis, the mechanisms mediating demyelination is not fully understood. This study shows, for the first time, that CZ induces demyelination via ferroptosis-mediated rapid loss of oligodendrocytes. This work shows that chelating copper with CZ leads to the expression of molecules that rapidly mobilize iron from ferritin (an iron storage protein), that triggers iron-mediated lipid peroxidation and oligodendrocyte loss (via ferroptosis). Such rapid mobilization of iron from cellular stores may also play a role in cell death in other neurologic conditions.
Keywords: cell death, cuprizone, demyelination, ferroptosis, ferrostatin-1, oxidative damage
Introduction
Cuprizone (CZ) is a copper chelator that causes demyelination in the CNS, noted particularly in the corpus callosum (CC) but also seen in other CNS regions (Gudi et al., 2009; Kipp et al., 2009; Koutsoudaki et al., 2009; Steelman et al., 2012; McMurran et al., 2019). It is widely used as a model to study experimental strategies to prevent myelin loss or promote remyelination (Mason et al., 2000; Bai et al., 2016; Karamita et al., 2017; Mullin et al., 2017; Laflamme et al., 2018) and neuronal plasticity (Zhang et al., 2020) in the context of multiple sclerosis (MS). How chelating copper induces oligodendrocyte (OL) death is not understood (McMurran et al., 2019), despite extensive work on its use as a model to study remyelination. Several copper-containing enzymes (ferroxidases) are involved in iron homeostasis and mitigating oxidative stress (superoxide dismutase). The ferroxidases oxidize ferrous iron (Fe2+) to its ferric state (Fe3+) (Calabrese et al., 1989; Vulpe et al., 1999; Zaitsev et al., 1999). Ferrous iron can react with hydrogen peroxide produced in mitochondria through normal cellular metabolism, and via the Fenton reaction produce highly toxic hydroxyl radicals (Connor et al., 2001). Ferroxidases also partner with the iron exporter, ferroportin, to export iron out of cells (Jeong and David, 2003; Han and Kim, 2007). Copper chelation can therefore be expected to disrupt cellular iron homeostasis (Jeong and David, 2006; Schulz et al., 2011). Ferritin is an excellent iron storage protein, and its level in cells is crucial for cell function and viability.
Intracellular iron is stored in ferritin, which consists of 24 subunits of heavy and light chains. Each molecule of ferritin can hold up to 4500 atoms of iron and is therefore highly effective at storing this metal (Arosio and Levi, 2010). On the other hand, reduction in ferritin under conditions resulting in even small increases in intracellular bioactive iron can lead to cytotoxicity as it would exceed the storage capacity of available ferritin, as occurs in a newly described form of iron-mediated cell death called ferroptosis (Dixon et al., 2012; Xie et al., 2016). Although excess unshielded iron is cytotoxic, iron in the form of iron-sulfur clusters and heme is essential for many enzymatic activities because of its redox-active nature (Rouault and Tong, 2005). For example, iron-sulfur clusters and iron-containing heme are required for the actions of mitochondrial respiratory chain enzymes (Rouault and Tong, 2005). Iron is also required for myelination (Todorich et al., 2009) and can be recycled from macrophages and astrocytes for remyelination (Schonberg et al., 2012; Schulz et al., 2012). On the other hand, iron released from dying cells can also contribute to cytotoxicity of neighboring cells. Therefore, cellular iron can have either cytotoxic or beneficial effects. Thus, the role of iron can vary at different times after start of the CZ diet.
In this study, we assessed when and how OL cell loss occurs after onset of CZ treatment. With some exceptions (Morell et al., 1998; Buschmann et al., 2012; Petkovic et al., 2016), most previous reports showed that OL loss occurs between 1 and 3 weeks after onset of CZ diet (Gudi et al., 2014). We therefore reexamined this starting from day 1. We also assessed how the pattern of OL loss from 1 d to 5 weeks correlates with changes in ferritin expression. As these experiments revealed dysregulation of molecules involved in iron homeostasis, in particular, rapid loss of ferritin, which would release iron stored in ferritin, we assessed whether expression of markers of ferroptosis correlates with these changes, and whether OL loss and demyelination could be prevented by blocking ferroptosis. Ferroptosis is an iron-dependent, nonapoptotic form of cell death that is induced by lipid peroxidation under conditions of glutathione insufficiency (Dixon et al., 2012). In addition, our studies also show that, from 3–5 weeks, iron localization shifts from OL to macrophages, which could serve as a source of iron for remyelination that occurs at this time if mice are put on a normal diet (Gudi et al., 2014).
Materials and Methods
Animals
Male C57Bl/6 mice (Charles River Laboratories), 8–10 weeks of age, were used for all the experiments. All animal procedures were approved by the Animal Care Committee of the Research Institute of the McGill University Health Center and followed the guidelines of the Canadian Council on Animal Care and the ARRIVE guidelines for reporting animal research (Kilkenny et al., 2010).
CZ treatment
Mice were fed with 0.2% (w/w) CZ (bis-cyclohexanone oxaldihydrazone; Sigma Millipore, #C9012) mixed in standard powdered rodent chow for 1 d up to 5 weeks (Gudi et al., 2009). Food was monitored and changed daily. Control mice were fed with normal standard powdered mouse chow for up to 5 weeks. Mice were killed after 1, 2, and 4 d and at weekly intervals between 1 and 5 weeks after CZ treatment, and brain tissues were collected for molecular and various histologic analyses. The caudal portion of the CC was used for all analysis (Steelman et al., 2012).
Brain tissue collection
Under deep anesthesia, animals were perfused via the heart with PBS, and the brains were rapidly exposed, removed, and placed on chilled rodent brain slicer matrix (ZIVIC Instruments, #72-5032) to obtain 1 mm brain slices. CC (bilateral) were dissected out from those brain slices, using 1-mm-diameter sterile disposable biopsy punch with plunger (Integra Miltex) and rapidly frozen in liquid nitrogen and stored at −80°C until mRNA and protein were extracted. From coronal brain slices through the region containing the hippocampus, 7 or 8 punches were taken starting from the middle to the lateral portions of the CC bilaterally. Tissue punches from 2 animals were pooled together to obtain enough tissue for each sample.
Drug treatment
Ferrostatin-1 (Fer-1, Sigma Millipore, catalog #SML0583) an inhibitor of ferroptosis, was dissolved in DMSO and further diluted with 0.01 m PBS (Dixon et al., 2012; Tuo et al., 2017). Fer-1 was administered intraperitoneally at a dose of 10 mg/kg body weight. For studies of the effects of Fer-1 on OL survival, mice on the CZ diet were treated with Fer-1 daily for 2 d and 2 weeks. Control mice were treated with vehicle (DMSO and PBS). At the end of 48 h and 2 weeks, mice were perfused via the heart with buffer and 4% PFA and the tissue collected for immunostaining. For studies of the effects of Fer-1 on myelin loss, mice on the CZ diet were treated daily for 2 weeks with Fer-1. At the end of 2 weeks, treatment was stopped, and the mice placed back on normal mouse chow for another 2 weeks. The mice were then perfused as above, and tissue collected for Luxol Fast Blue (LFB) staining.
RNA isolation and qRT-PCR
Total RNA was extracted using RNeasy Mini Kit (QIAGEN) following the manufacturer's instructions. cDNA was reverse-transcribed using the Quantinova Kit (QIAGEN, catalog #205411). qRT-PCR was performed using SYBR Green PCR Master Mix (Applied Biosystem) and ABI OneStep cycler (Applied Biosystems) using specific primer pairs as indicated in Table 1. Peptidylprolylisomerase A (ppia) was used as an internal control gene. Results were quantified using the ΔΔCT method following standardization relative to ppia (Livak and Schmittgen, 2001).
Table 1.
Primer sequences used for qPCR
| Gene | Forward sequence | Reverse sequence |
|---|---|---|
| ncoa4 | AACACTGCCGACTGGGTTTT | AGCTGCATACAGGCAAAGAGA |
| fth | TAAAGAACTGGGTGACCACGTGAC | AAGTCAGCTTAGCTCTCATCACCG |
| tfr1 | AAACTGGCTGAAACGGAGGAGACA | GCTGCTTGATGGTGTCAGCAAACT |
| heph | GCTGAGGGTCCTAAGGAATGGATA | GCCCACAGTACTTTGAGAAACAGG |
| hspb1 | ATCACTGGCAAGCACGAAGA | TCGAAAGTAACCGGAATGGTGA |
| cox-2 | AAAGGCCTCCATTGACCAGA | ACGAGGTTTTTCCACCAGCA |
| sod-1 | ACTCTAAGAAACATGGTGGCCC | TTCCACCTTTGCCCAAGTCA |
| ho-1 | TAGCCCACTCCCTGTGTTTCCTTT | TGCTGGTTTCAAAGTTCAGGCCAC |
| ppia | ATGTGCCAGGGTGGTGACTTTA | TGTGTTTGGTCCAGCATTTGCC |
Western blotting
Total protein was extracted from brain tissue punches using 1% Nonidet P-40 (Sigma Millipore), 2% SDS, 2 mm EDTA, 1% sodium deoxycholate (BDH Chemicals), and 0.15 m sodium phosphate, pH 7.2, including 1× protease inhibitor cocktail (Roche Diagnostics) as described previously (Jeong and David, 2003). Total protein concentration was measured using Bio-Rad DC protein assay according to the manufacturer's instructions (catalog #500-0121); 25 µg of protein per sample was separated on 4%-12% SDS-PAGE gels (Novex, Invitrogen) and transferred to PVDF membrane (Millipore). Membranes were blocked with 5% milk in 0.05% PBS Tween-20 and probed with primary antibody: mouse anti-GPX4 (1:500; Alpha Diagnostic; MAB5457), rabbit anti-xCT (1:1000; Abcam; ab175186) overnight at 4°C; blots were then washed and incubated with HRP-conjugated IgG (1:20,000-50,000; Jackson ImmunoResearch Laboratories) and the bands visualized by enhanced chemiluminescence (PerkinElmer) and quantified using ImageJ software (version 1.48r, National Institutes of Health). For equal loading of protein, membranes were reprobed with rabbit anti-β-actin antibody (1:1000; Sigma Millipore; A2066).
Immunofluorescence and confocal microscopy
At different time intervals after CZ treatment (i.e., 1, 2, 4 d, 1–5 weeks), mice were perfused via the heart with PBS, followed by 4% PFA in 0.1 m phosphate buffer. Brains were removed, postfixed in the same fixative for 24 h and cryoprotected in 30% sucrose and frozen for cryostat sectioning. Coronal cryostat sections of the brain at 14 µm thickness were used for immunofluorescence labeling. Tissue sections were incubated with blocking solution containing 0.3% Triton X-100 (Sigma Millipore), 2% ovalbumin (Sigma Millipore), and 5% normal goat/donkey serum (Jackson ImmunoResearch Laboratories) in 0.01 m PBS for 2–3 h at room temperature to block any nonspecific binding. Sections were incubated with the following cell type specific primary antibodies: mouse anti-CC1 (for mature OLs; 1:50; Calbiochem Millipore; OP80), rabbit anti-Olig2 (for immature/mature OLs; 1:200; Millipore; AB9610), rat anti-CD11b (for macrophages/microglia; 1:200; AbD Serotec; MCA711), rabbit anti-Iba-1 (for microglia; 1:200; Wako; 019-19741), guinea pig anti-glial acidic protein (GFAP, for astrocytes; 1:500; Synaptic Systems; 173004) overnight at 4°C. In some experiments, sections were double-labeled with rabbit anti-ferritin (1:200; Sigma Millipore; F5012), rat anti-Ki67 (1:200; eBioscience; 14-5698-82), mouse anti-Nuclear receptor coactivator (NCOA4, 1:200; Abcam; ab6463), rabbit anti-malondialdehyde (MDA, 1:200; Abcam; ab27642), rabbit anti-NCOA4 (1:200; Thermo Fisher Scientific; H00008031-M04), mouse anti-transferrin receptor (TfR1, 1:300; Novus Biological; NB100-922243), and rabbit anti-4 hydroxynonenal (4-HNE, 1:100; Abcam; ab46545). Sections were washed and incubated with appropriate fluorescent-conjugated secondary antibodies: anti-rabbit AlexaFluor-488, anti-mouse AlexaFluor-568, and anti-rat AlexaFlour-568 (1:500 for all; Invitrogen). Slides were coverslipped in ProLong gold antifade mounting media containing DAPI (Invitrogen). Tissue sections through the caudal portion of the CC were viewed using a confocal laser scanning microscope (FluoView FV1000, Olympus), and micrographs were taken in a z-stack series with FV10-ASW 3.0 software (Olympus).
Ferritin immunoreactivity quantification
Confocal images of the midline portion of the CC through the same region were taken from three different coronal sections per animal from a total of 4 or 5 mice per group. Images were taken with FV10-ASW 3.0 software (Olympus) using confocal laser scanning microscope (FluoView FV1000, Olympus). For comparing between groups, the same setting was applied in all images of each immunostaining. Images were processed and analyzed using ImageJ software (version 1.48r, National Institutes of Health) as follows: Background of the images was subtracted with a rolling ball of 150 pixels. Staining intensity was then quantified using ImageJ Threshold plug-in, and the mean integrated density was calculated for each experimental group.
LFB staining and quantification
To assess myelin loss in the midline portion of the CC, tissue sections were stained with LFB. For the staining, sections were first dehydrated in 50%-95% ethanol and then incubated in a 0.1% LFB solution overnight at 37°C. Next day, slides were allowed to cool at 4°C and further incubated in 0.05% lithium carbonate solution, followed by differentiation in ethanol and sections were then coverslipped with Permount. Images of the midline portion of the CC were taken using Axioskop2 plus microscope (Carl Zeiss) using Bioquant image analysis software (Bioquant life Sciences). Staining intensity was then quantified using the ImageJ Threshold plug-in, and the mean followed by percentage of integrated density was calculated for each group.
Immunohistochemistry analysis
Brain cryostat sections of 14 µm thickness from 4% PFA perfusion-fixed mice were used for DAB immunohistochemistry for 4-HNE as described previously with some minor modification (Chakravarty et al., 2015). Brain coronal sections through the same region of the CC were pretreated with 50% formamide for 2 h at 65°C followed by treatment with 2N HCl and neutralized with 0.1 m boric acid, pH 8.5. Endogenous peroxidase was blocked with 3% H2O2 in PBS for 15 min at room temperature. Sections were then blocked with 5% normal goat serum, 0.3% Triton X-100 in PBS for 2 h at room temperature followed by overnight incubation with primary rabbit anti-4-HNE antibody (1:200; Abcam, ab46545). Sections were washed in 0.05% PBS-Tween followed by incubation with secondary goat anti-rabbit biotinylated (1:200; Vector Laboratories, BA-1000). Sections were then washed in 0.05% PBS-Tween-20 and incubated in Vectastain avidin-biotin based ABC Kit (VECTPK6100) for 1 h at room temperature. Labeling was visualized with diaminobenzidine-tetrahydrochloride (DAB) using the ImmPACT DAB peroxidase substrate kit (Vector Laboratories, SK-4105) according to the manufacturer's instructions. The midline portion of the CC was viewed under a Axioskop2 plus bright field microscope (Carl Zeiss) at 10× magnification, and images were captured using the Bioquant Life Sciences software. The quantification of the 4-HNE staining intensity was assessed using ImageJ software to estimate the reciprocal intensity. Briefly, we measured the “reciprocal intensity” of the 4-HNE staining. For this, we subtracted the intensity of the 4-HNE stained ROI from 250, which is the maximum intensity value of standard red-green-blue color images indicated by the intensity function in ImageJ software. This gives a value that is directly proportional to the amount of chromogen presented in the selected area of interest (i.e., midline regions of the CC) (Nguyen et al., 2013).
Nile Red micro-spectroscopy
Nile Red staining solution (10 μm final in PBS) was prepared from a 6 mm stock solution in DMSO. PFA-fixed frozen tissue sections were stained with Nile Red for 10 min, followed by a single 5 min rinse in PBS. Spectral fluorescence images were acquired using an upright Nikon A1RMP spectral confocal microscope with a water immersion objective (25×, NA 1.1). Spectrometer resolution was 10 nm with 26 channels ranging between 490 and 740 nm. Laser excitation wavelength was 488 nm. Spectral data were processed and analyzed using ImageTrak image analysis software (written by P.K.S.: https://www.ucalgary.ca/styslab/imagetrak). For spectral decomposition, two bracketing reference spectra, obtained by measuring fluorescence of Nile Red dissolved in nonpolar hexane and more polar methanol, were used to define the 0-1 polarity index range. A quantitative polarity of each pixel was determined by a nonlinear transformation algorithm and Levenberg-Marquardt curve fitting against the two reference spectra. Pseudocolor images were generated in a similar manner with a color assigned to increasing polarity indexes. Images were automatically masked by adaptive thresholding to remove irrelevant background regions.
Statistical analysis
All experimental data were analyzed using GraphPad Prism 8.0 software and represented as mean ± SEM. Statistical comparison between groups were determined by one-way ANOVA, followed by Tukey or Bonferroni post hoc test. Mann–Whitney nonparametric test was used to compare two groups. Wilcoxon rank test was used to analyze the data from the spectral imaging. A value of p < 0.05 was considered significant. All analyses were conducted blinded to the experimental or control groups.
Results
OL loss and restoration after start of CZ treatment
We first assessed the time course of loss of mature OLs in mice from as early as 1 d up to 5 weeks on the CZ diet. The number of CC1+ mature OLs were counted in the midline region of the caudal portion of the CC (Steelman et al., 2012). At 1 d after the start of the CZ-containing diet, there appeared to be a small reduction in the number of CC1+ OLs, but this was not statistically significant. However, by day 2, there was a significant loss of 60.0 ± 4.0% of CC1+ OLs, followed by a further reduction to 80 ± 2.8% compared with normal, control levels by 1 week (Fig. 1A,B). The number of mature CC1+ OLs began to recover partially at 3 weeks, followed by a small but significant reduction at 4 weeks, when the numbers dropped down to the 1 week values (Fig. 1A,B). This may be because of continuing CZ toxicity, as the animals are still on the CZ diet or to the delayed inflammatory response (Steelman et al., 2012; McMurran et al., 2019). The number of mature CC1+ OLs was then rapidly restored to control levels 1 week later at 5 weeks despite continued CZ feeding (Fig. 1B; Control vs 2 d, 1, 2, 3, and 4 weeks: p < 0.001; 1 d vs 2 d: p < 0.001; 1 week vs 3 weeks: p = 0.007; 1 week vs 5 weeks: p < 0.001; 3 weeks vs 4 weeks: p = 0.03; n = 4 or 5 per group, F(7,28) = 38.47, p < 0.001, one-way ANOVA with Tukey's multiple comparison test). This profile of rapid cell loss and restoration at 5 weeks was consistently observed in two separate series of experiments (total of 9 mice per time point; n = 4 or 5 mice per time point per series). For both experiments, the cell counts were assessed in a blinded manner twice independently by 2 individuals. Further evidence of unique myelin changes that parallel this early loss of OL by 2 d is provided in the next section. This fluctuation in mature CC1+ OL cell numbers suggests that cell loss and recovery are happening simultaneously. Finally, there is complete recovery at 5 weeks despite animals being on the CZ diet (Fig. 1A,B). This recovery of OL numbers suggests some compensatory mobilization of copper from peripheral stores into the CNS, such as from the liver, which has one of the highest amounts of copper stores in the body, or some other compensatory mechanism. It is noteworthy that the concentration of 0.2% CZ that is widely used was arrived at by titrating the dose to below the lethal dose that induces liver toxicity (Skripuletz et al., 2011). Overall, these findings indicate that: (1) the greatest loss of OLs occurs as early as 2 d after starting CZ treatment; (2) mature OL numbers begin to recover partially by 2-3 weeks, followed by another small loss at 4 weeks; (3) and full recovery of mature CC1+ OL numbers is seen by 5 weeks despite continued CZ exposure (Fig. 1A,B).
Figure 1.
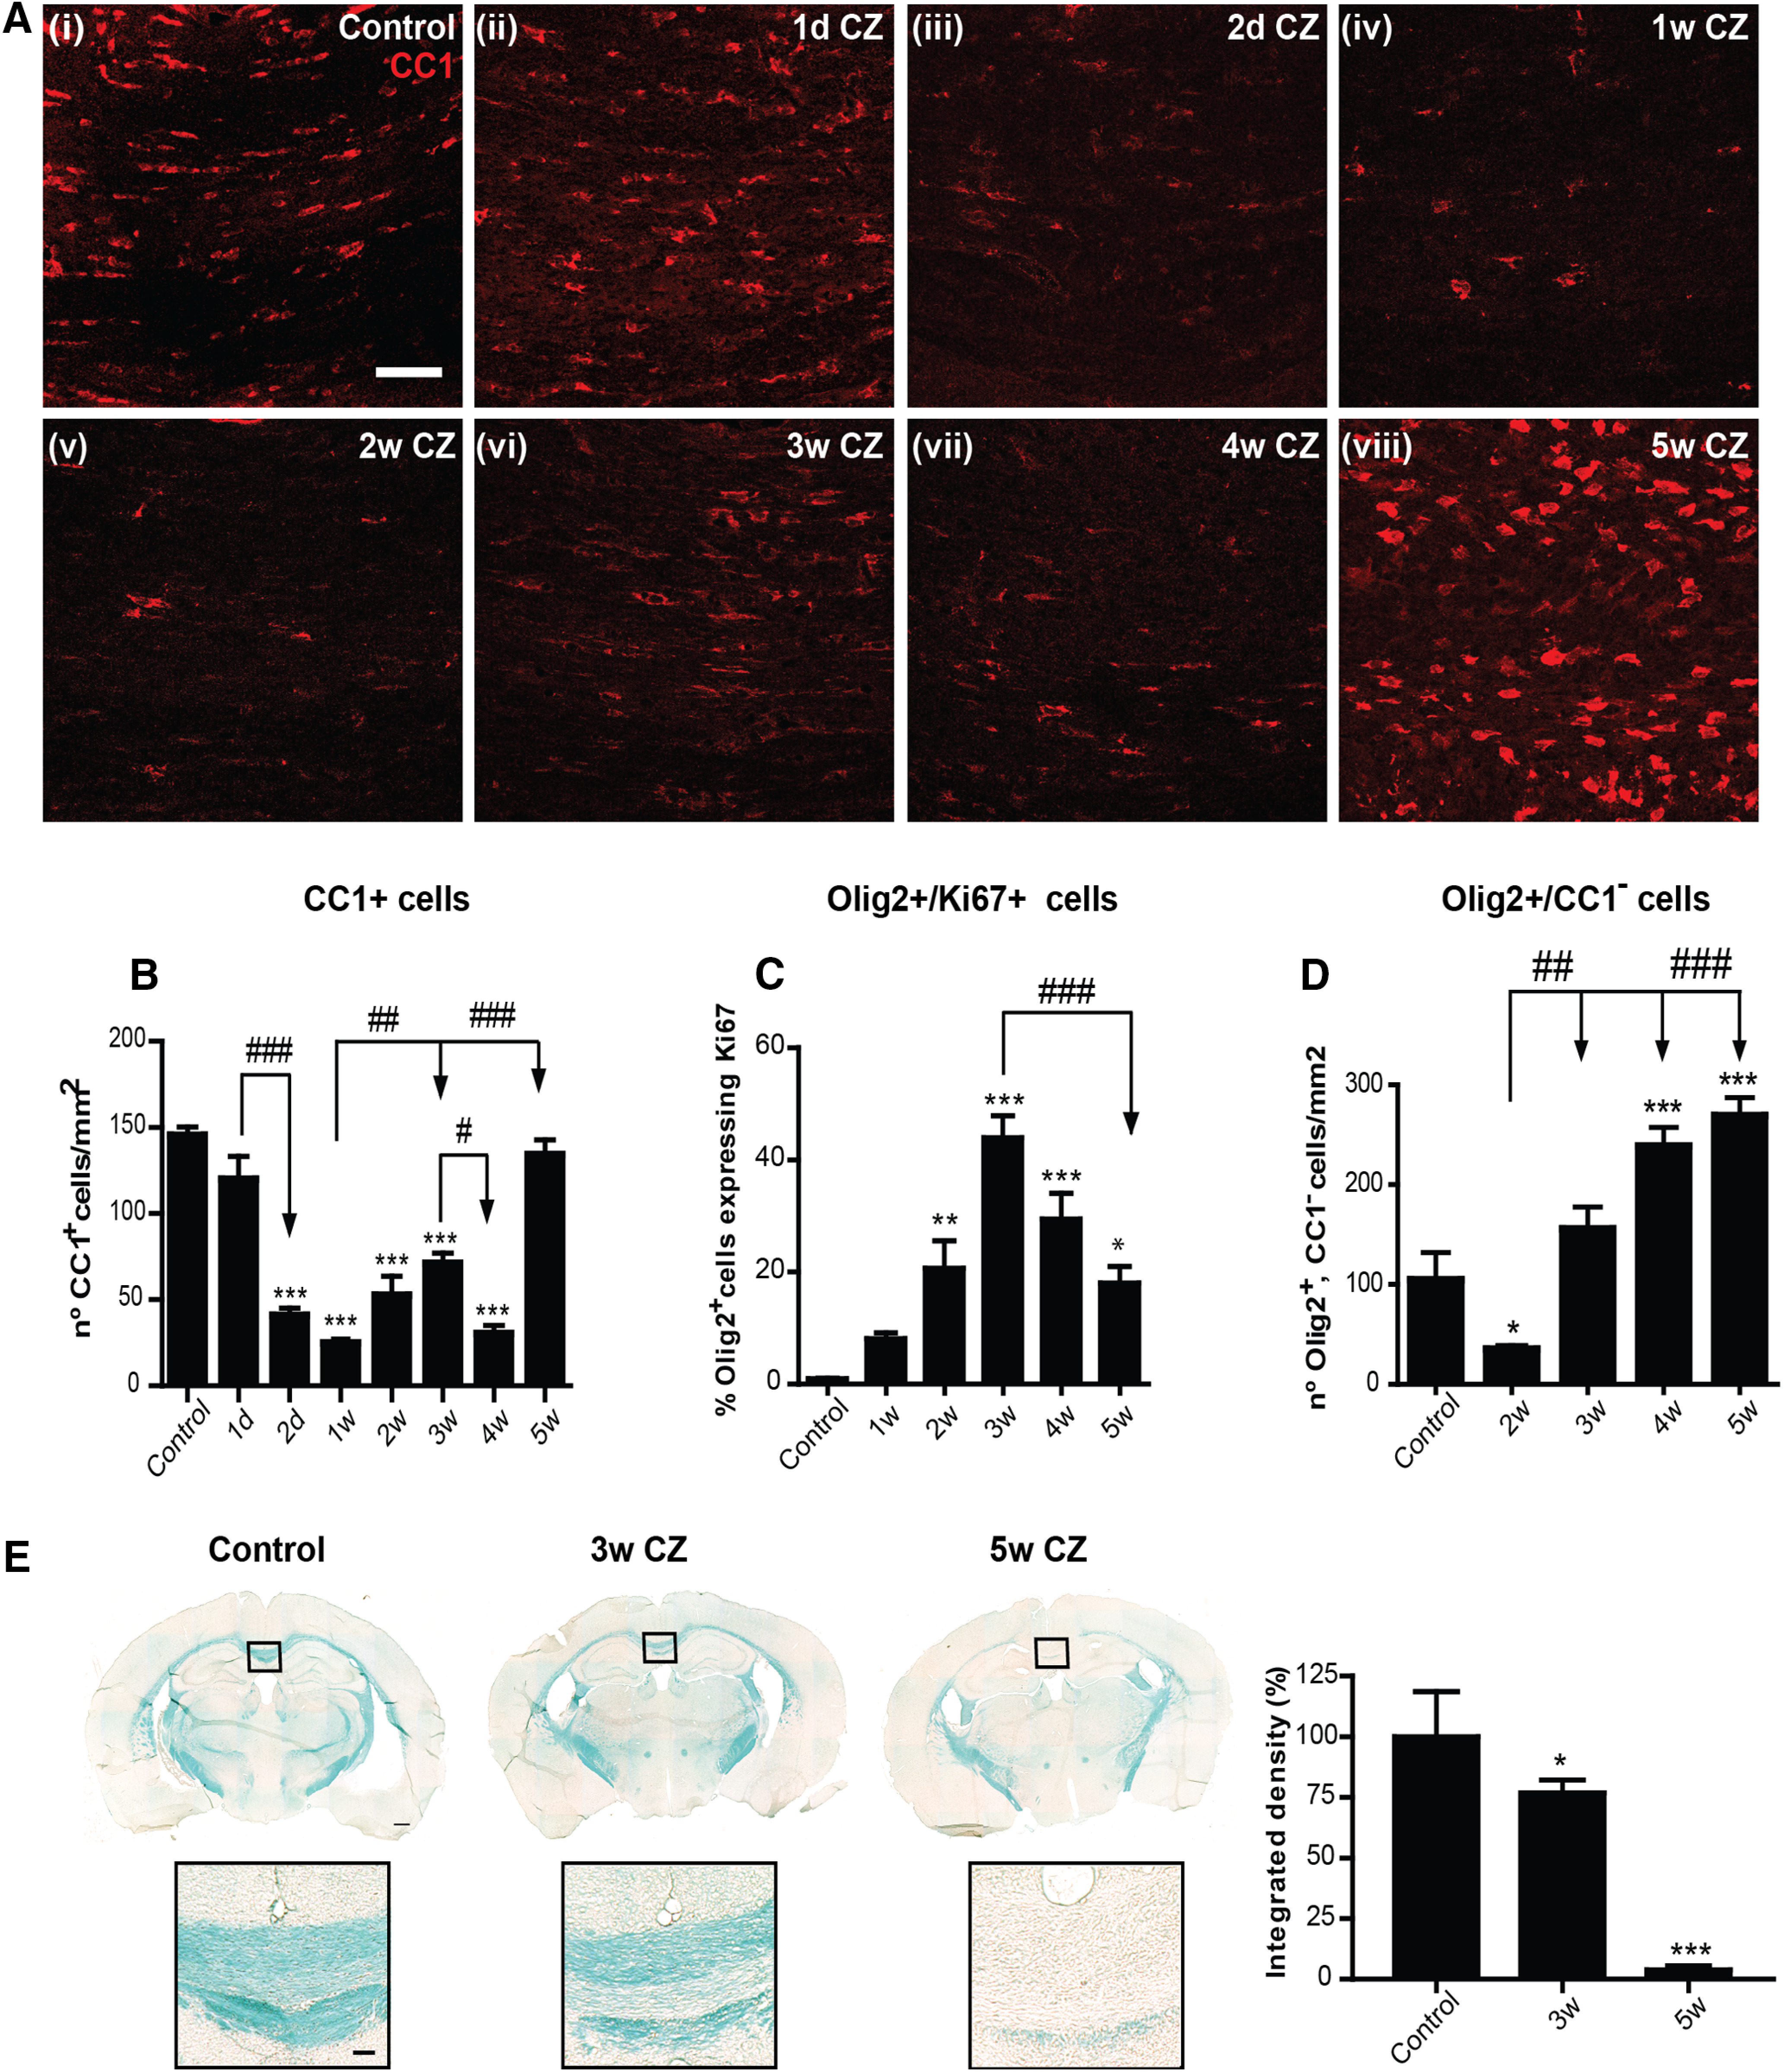
CZ diet induces loss of OL. A, Immunofluorescence images represent staining for mature OL marker CC1 (red) taken from the midline region of the CC from control (Ai), and CZ-treated mice 1 and 2 d (Aii, Aiii) and 1–5 weeks on the CZ diet (Aiv–Aviii). There is no colocalization of CC1 staining with GFAP or Iba1 (data not shown), indicating that CC1 does not label other glial cell types. Scale bars, 50 µm. B, Graph represents quantification of the number of CC1+ OLs stained with nuclear stain DAPI. Note the sharp rapid loss of CC1+ cells at 2 d followed by a further loss at 1 week after onset of CZ diet. The number of OLs begins to recover at 3 weeks followed by a small but significant loss at 4 weeks. The number of CC1+ are fully restored by 5 weeks. C, Graph represents quantification of proliferating cells of the OL lineage (Olig2+, Ki67+). Note the peak of proliferation at 3 weeks. D, Graph represents the number of Olig2+, CC1– OPCs. There is a rapid loss of OPCs at 2 weeks followed by recovery to normal values at 3 weeks, and a 2- to 2.5-fold increase at 4 and 5 weeks on the CZ diet. B–D, Data are mean ± SEM. Asterisks indicate significant difference from mice on the control diet. Arrows indicate differences between groups. n = 4 or 5 animals per group. *, #p < 0.05. **, ##p < 0.01. ***, ###p < 0.001. E, LFB staining of coronal sections of the brain from mice on a control diet, 3 and 5 weeks after start of the CZ diet. Graph represents that LFB staining for myelin in the midline portion of the CC is reduced by ∼23% at 3 weeks but is lost by 5 weeks. n = 4 per group. *p < 0.05. ***p < 0.001. Areas outlined in the black squares are shown at higher magnification below. Scale bars: 350 µm, Inset, 60 µm.
The rapid restoration of mature CC1+ OL numbers to normal values between 4 and 5 weeks suggests the availability of Olig2+, CC1– OL precursor cells (OPCs). The number of proliferating Olig2+ cells of the OL lineage determined by Ki67 labeling was significantly increased throughout the 5 weeks on the CZ diet and showed a peak at 3 weeks (∼40%) and remained at ∼20% of control values at 5 weeks (Fig. 1C; Control vs 2, 3, 4, and 5 weeks: p = 0.008, p < 0.001, p < 0.001, and p = 0.02, respectively; 3 weeks vs 5 weeks: p < 0.001; n = 4 per group, F(5,18) = 20.26, p < 0.001, one-way ANOVA with Tukey's multiple comparison test). On the other hand, there was ∼70% loss of Olig2+, CC1– OPCs during the first 2 weeks on the CZ diet (Fig. 1D). Significant early loss of OPC with CZ diet has also been reported (Liu et al., 2010). The total number of Olig2+, CC1– OPCs increased steadily from 3 to 5 weeks, reaching control levels by 3 weeks and 2- to 2.5-fold increase by 4 and 5 weeks (Fig. 1D; Control vs 4 and 5 weeks: p < 0.001; 2 weeks vs 3 weeks: p = 0.001; 2 weeks vs 4 and 5 weeks: p < 0.001; n = 4 per group, F(4,15) = 30.97, p < 0.001, one-way ANOVA with Tukey's multiple comparison test; Control vs 2 weeks: p = 0.03; Mann–Whitney test). Our findings of increased OPC numbers at 4–5 weeks are consistent with earlier reports (Mason et al., 2000). The availability of these OPCs at 4 and 5 weeks may explain the rapid restoration of mature CC1+ OL numbers at 5 weeks (Fig. 1B). These data also indicate that, like mature OLs, OPCs are also susceptible to CZ-induced toxicity at the early time points. However, from 3 weeks onward, newly generated OPCs are resistant to CZ toxicity. An important finding from these experiments is that there is a significant loss in the number of OLs as early as 2 d after start of CZ. Myelin loss is more gradual, however, with a reduction of 23.2 ± 2.6% at 3 weeks but becoming severe after 4-5 weeks of continued CZ exposure (Fig. 1E; Control vs 3 weeks: p = 0.04, p < 0.001; n = 4 per group, F(2,10) = 72.73, p < 0.001, one-way ANOVA with Tukey's multiple comparison test). Such a gradual loss of myelin has also been reported previously (Morell et al., 1998; Gudi et al., 2009).
Early evidence of myelin damage after CZ treatment detected by spectral microscopy
As ∼60% of the mature CC1+ OLs are lost by 2 d, and a single OL can myelinate up to 50 internodal segments, a very large number of myelin internodes could be severed from their OL cell bodies and metabolically disconnected and therefore destined for degeneration and clearance. However, as noted previously by others (Morell et al., 1998; Gudi et al., 2009; Liu et al., 2010; Lampron et al., 2015) and shown in Figure 1E, myelin staining in the CC is still detected at 3 weeks. One reason for the slow myelin clearance could be the slow phagocytic response in the adult CNS, which is also seen in the slow rate of axonal and myelin clearance in Wallerian degeneration in the CNS after injury (Griffin et al., 1992; George and Griffin, 1994; Perrin et al., 2005; Vargas and Barres, 2007). We now show using a novel spectral imaging technique that changes in myelin lipids can, however, be detected as early as 2 d after start of CZ diet, paralleling the early loss of OLs. Figure 2 shows spectral micrographs of control medial CC and the same region after 2 d of CZ feeding. While no demyelination could be detected at 2 d by conventional methods, such as Luxol Fast Blue, Nile Red solvatochromism showed changes in the molecular properties of myelin with a significant shift toward a more polar character (Fig. 2B; Control vs 2 d: p = 0.01, n = 7 per group, Wilcoxon rank test). This indicates that the physicochemical properties of the still histologically intact myelin undergo significant changes in parallel with the early and substantial loss of parent OLs.
Figure 2.

Effects of CZ diet on CC studied using Nile Red spectroscopy. A, Example spectral micrographs of midline region of the CC from control (Ai, Aiii) and following 2 d of CZ feeding (Aii, Aiv). Ai, Aii, “True color” images simulating what the eye would see; no discernible differences are apparent. In contrast, postprocessed pseudocolor images based on spectral information reveal notable differences in hue (Aiii, Aiv), indicative of more polar character in the red-shifted CZ-fed mouse. Scale bars, 100 µm. Insets, High-magnification images showing spectral shifts in individual myelin sheaths. Scale bars, 5 µm. B, Bar graph summarizing difference in polarity index in medial CC between control and 2 d CZ-fed mice (n = 7 in each group). *p = 0.01 (Wilcoxon rank test).
Changes in expression of ferritin in the CC after CZ treatment
Ferritin is a good indicator of the capacity of cells to store iron and a sensitive marker of disruption of cellular iron homeostasis. Interestingly, immunofluorescence labeling for ferritin in the CC was significantly reduced at 1 and 2 d after the start of CZ diet (Fig. 3). The mRNA expression of ferritin heavy chain was also reduced ∼50% during the first 4 d after start of CZ (see Fig. 5Aiv). Immunofluorescence labeling of ferritin increased subsequently at 2, 3, and 5 weeks (Fig. 3) but showed another reduction at 4 weeks (Fig. 3; Control vs 1 and 2 d, 2, 3, and 5 weeks: p = 0.03; 3 vs 4 weeks: p = 0.03; n = 4 per group, Mann–Whitney test). Interestingly, during the early phase of ferritin increase at 2 weeks (Fig. 3C), 49.5 ± 11% of CC1+ OL (which are reduced to ∼20% of control numbers) were ferritin+. Later, at 3 weeks (Fig. 3D), ferritin labeling was found to be localized predominantly in CD11b+ microglia/macrophages (72.7 ± 3.9%). The shift in localization of ferritin from OLs to microglia/macrophages may be because of loss of OLs and phagocytosis of dying cells by macrophages. This localization of iron in macrophages at later time points may have significance for remyelination, as will be discussed later. It is also important to note that there are very few CD11b+ macrophages before 3 weeks on the CZ diet (Fig. 4). This suggests that activated macrophages are unlikely to contribute to the loss of OLs during the first week on the CZ diet.
Figure 3.
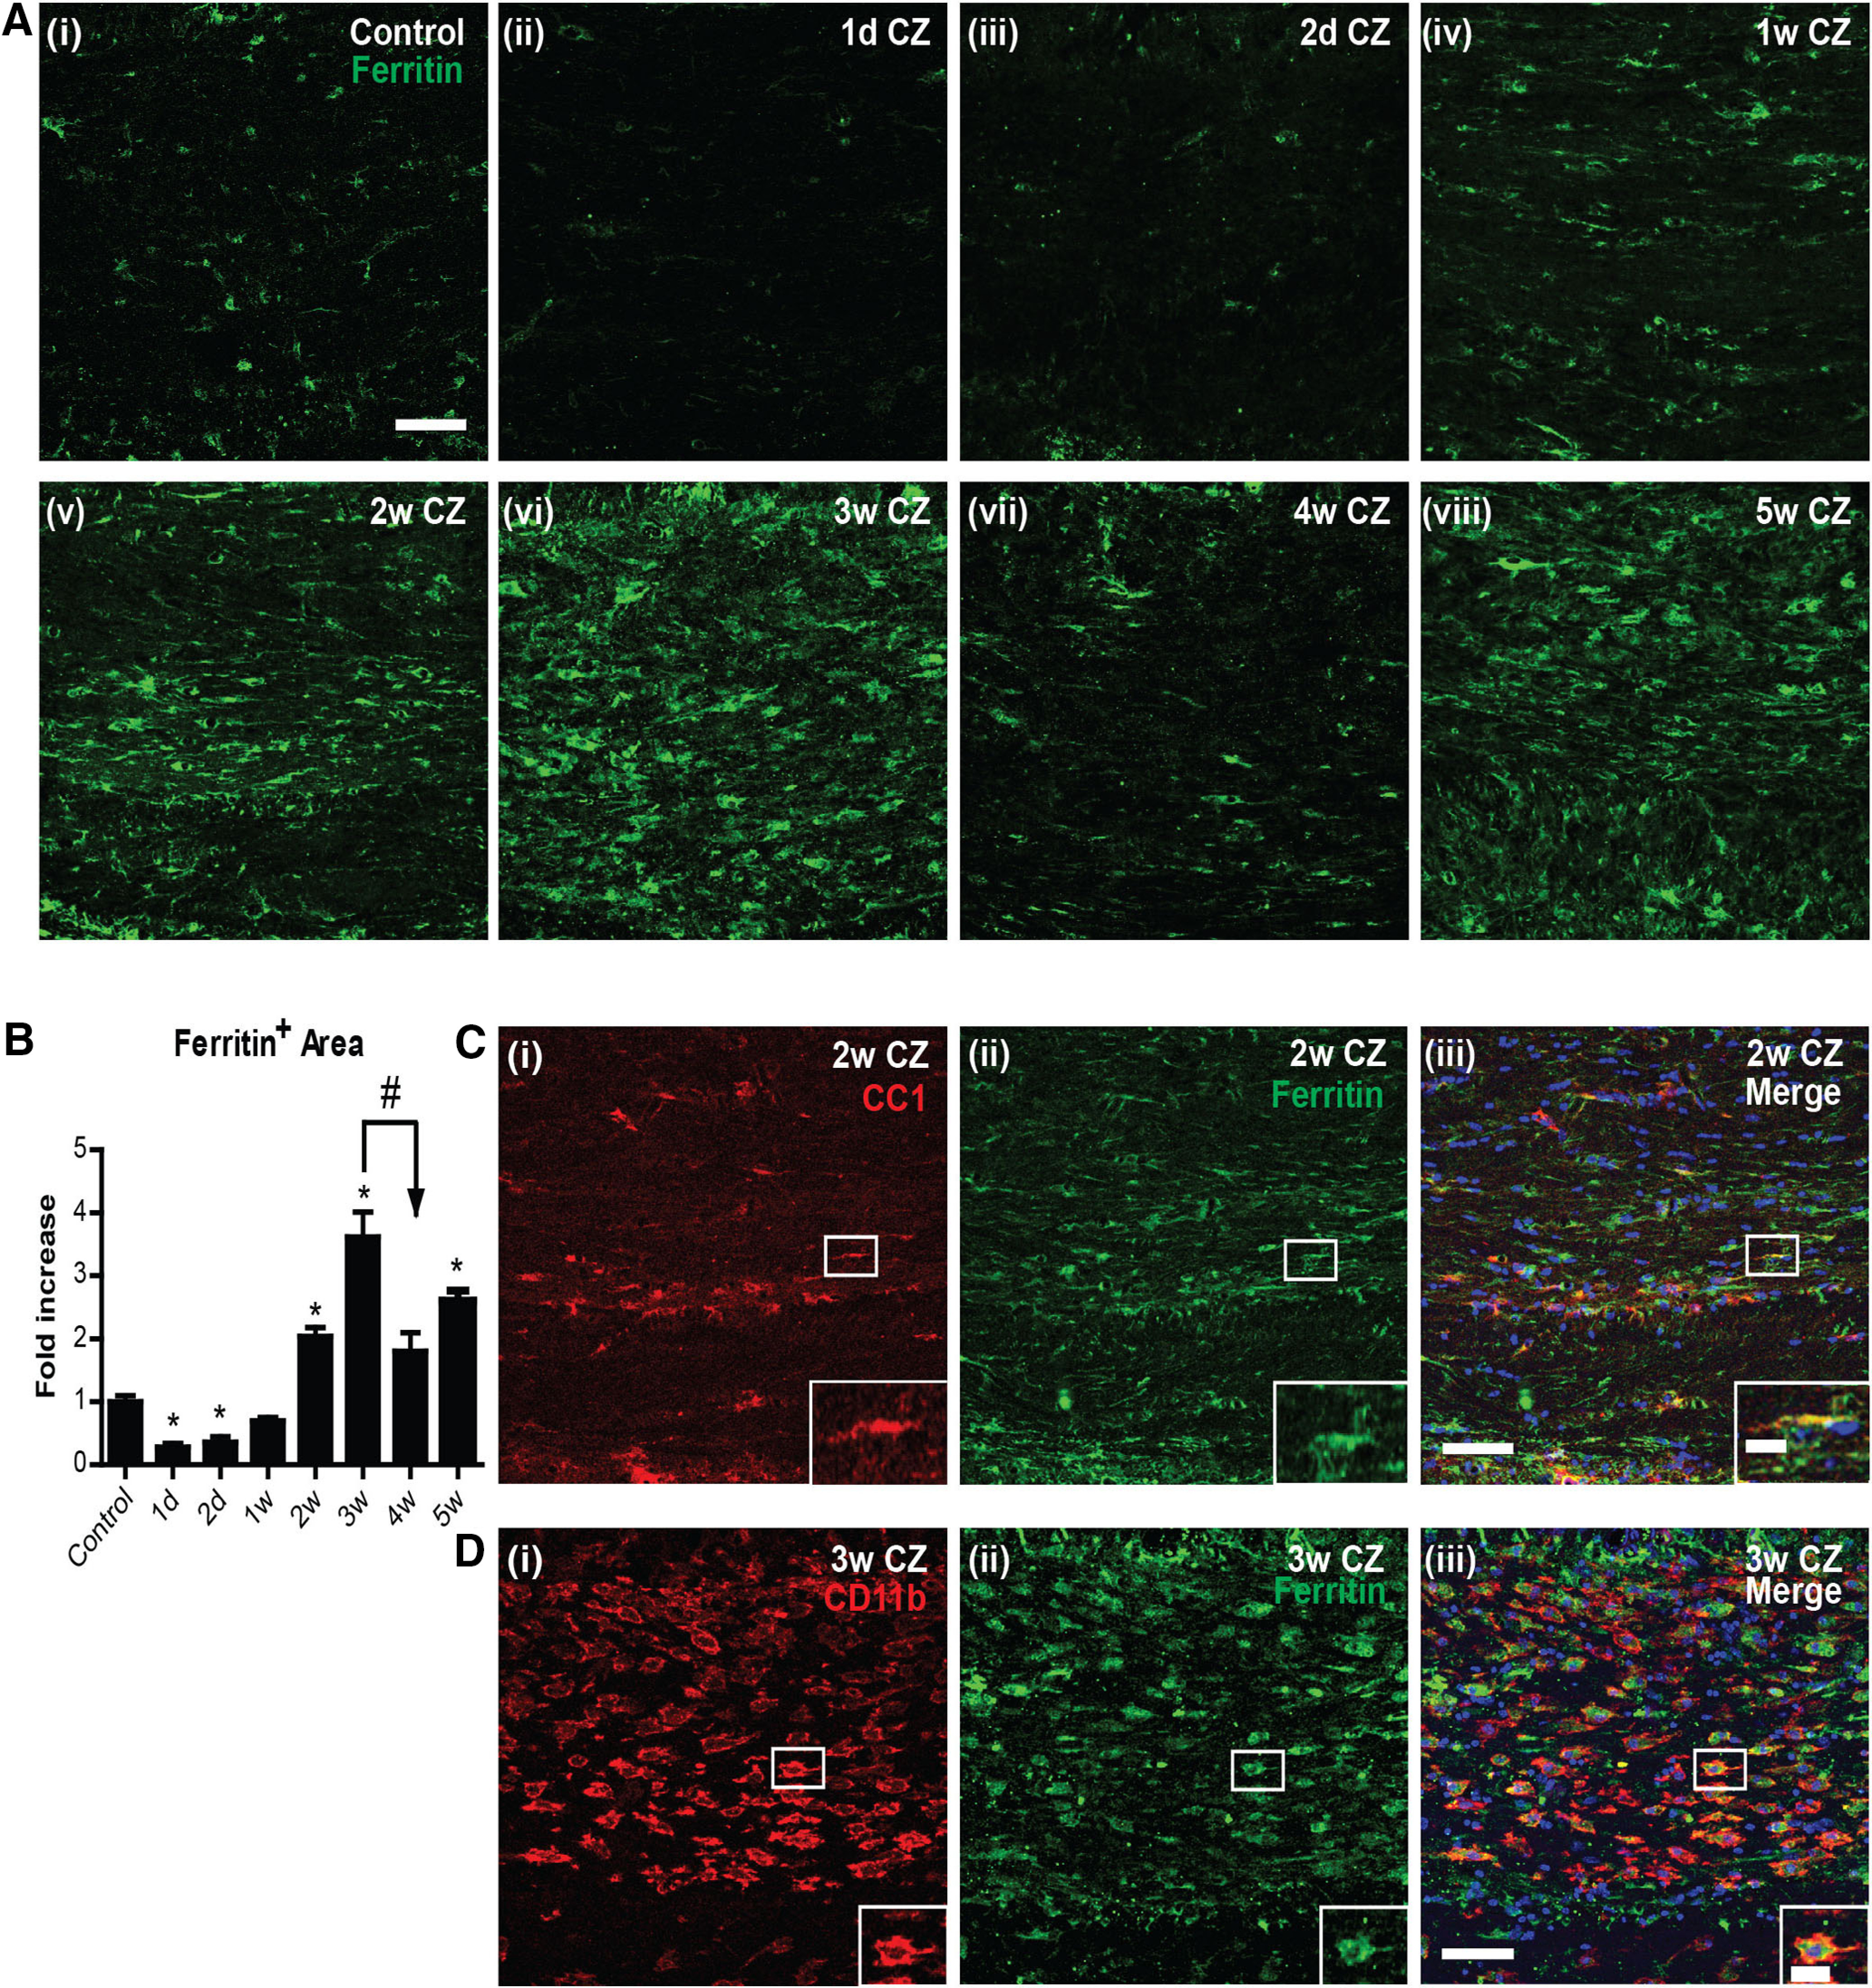
Changes in ferritin expression in the CC after CZ diet. A, Immunofluorescence images showing ferritin (green) expression in control mice (Ai) and mice 1 and 2 d (Aii, Aiii) and 1-5 weeks after start of the CZ diet (Aiv–Aviii). B, Graph represents quantification of ferritin immunoreactivity. Note the significant decrease in ferritin expression at 1 and 2 d on the CZ diet compared with the control diet group. Ferritin levels increase significantly at 2, 3, and 5 weeks. Asterisks indicate significant differences from the control group. Arrow indicates difference from 3 week group. n = 4 animals per group. Data are mean ± SEM. *, #p < 0.05. Scale bars, 50 μm. C, D, Colocalization of ferritin with OL (CC1+) and macrophages/microglia (CD11b+) in the CC after CZ diet. C, Double-immunofluorescence labeling of ferritin+ (green) and CC1+ (red) in the midline portion of the CC in a mouse 2 weeks on the CZ diet. The double-labeled cell outlined in the white rectangle is shown in higher magnification in the inset. D, Double-immunofluorescence labeling of ferritin+ (green) and CD11b+ (red) at 3 weeks on the CZ diet. Note the large number of CD11b+ macrophages that are ferritin+. Inset, Higher magnification of the cell outlined in the white rectangle. Scale bars: 50 µm; Inset, 15 μm.
Figure 5.
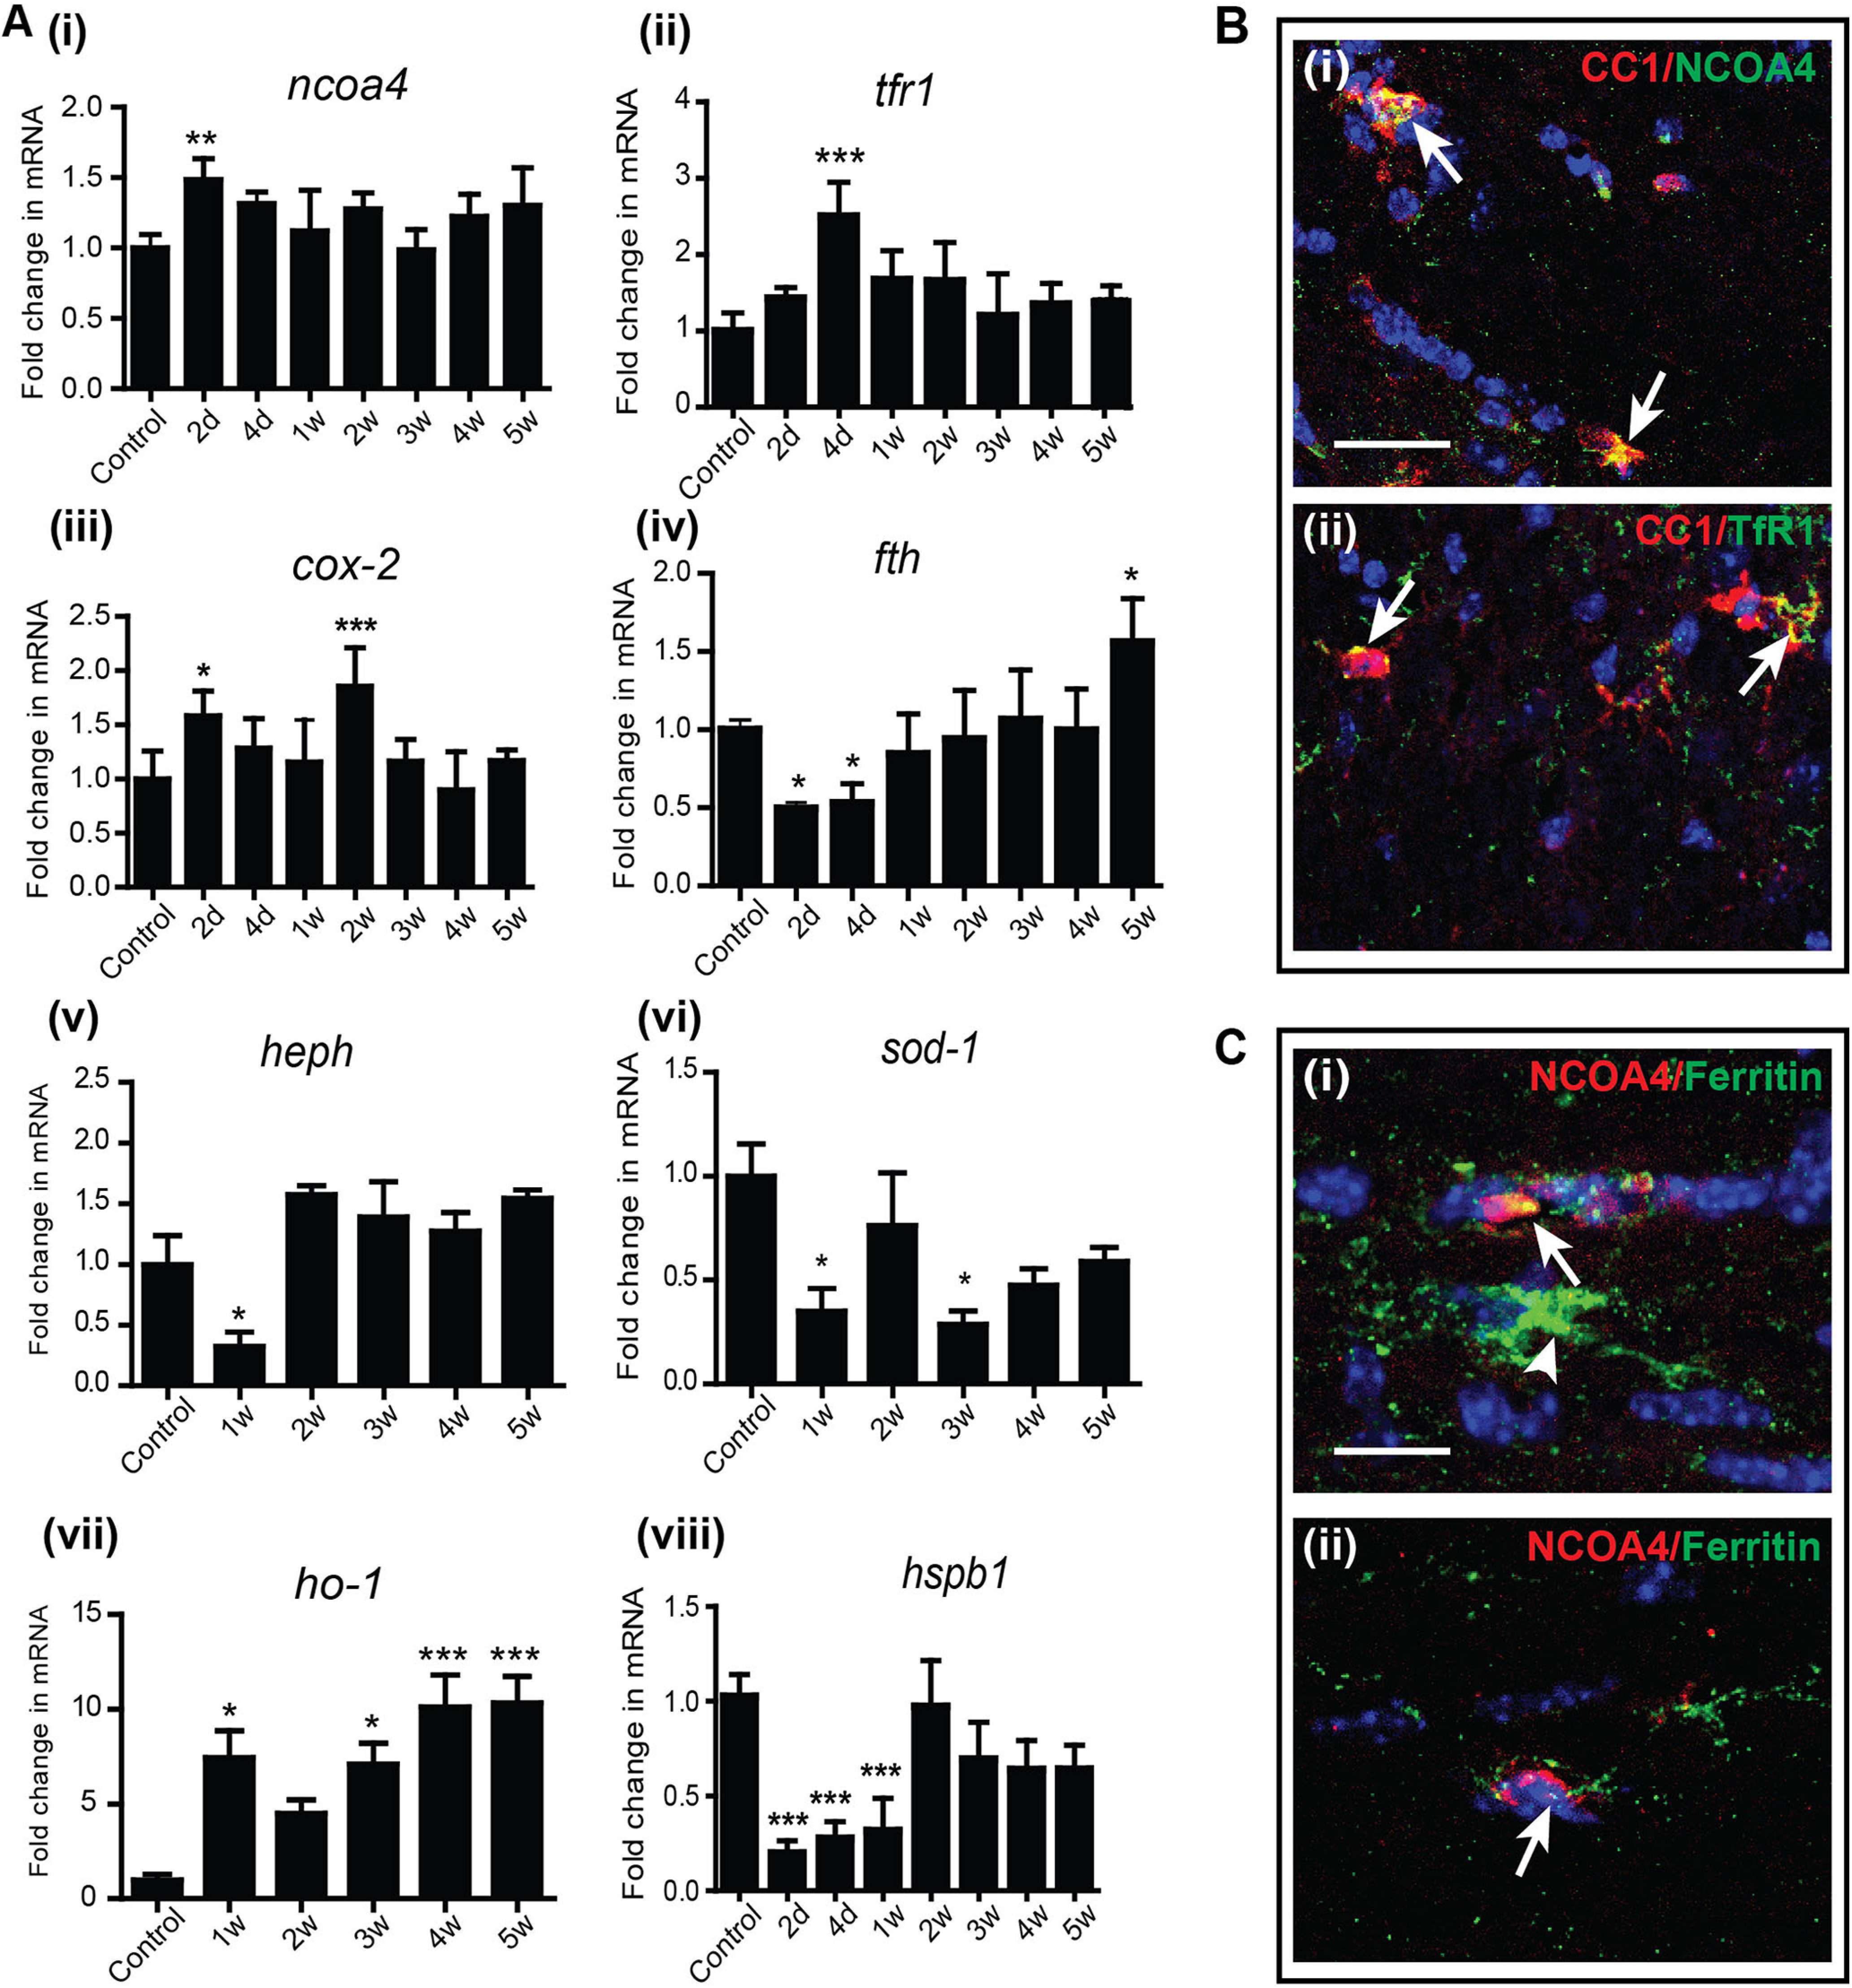
A, Changes in the mRNA expression of ferroptosis markers in the CC after CZ diet detected by qPCR. Early after start of the CZ diet between 2 d and 1 week, there are changes in expression of ferroptosis markers. These include increased expression of ncoa4, tfr1, cox-2, and ho-1, and reduced expression of fth (ferritin -heavy chain), hspb1, and two copper-containing enzymes, heph and sod-1. n = 4 or 5 per group (2 animals pooled for each sample; total 8-10 animals used for the experiment). Data are mean ± SEM. *p < 0.05. **p < 0.01. ***p < 0.001. B, Merged images of double-immunofluorescence labeling represent that the protein expression of NCOA4 (Bi) and TfR1 (Bii) is localized to mature CC1+ OL (arrows) at 1 and 4 d after start of CZ diet, respectively. Yellow represents double labeling in these merged images. Scale bars, 25 µm. C, The extent of NCOA4 protein expression appears to correlate with ferritin labeling; that is, cells that express high levels of NCOA4 (red) express less ferritin (green) (Ci, Cii, arrows), whereas cells that express no NCOA4 express high levels of ferritin (Ci, arrowhead). Sections also stained for DAPI nuclear stain. Scale bars, 10 µm.
Figure 4.

Changes in the number of CD11b+ microglia/macrophages in the CC in control mice and mice on the CZ diet. The strong CD11b+ labeling of microglia/macrophages is only evident from 3 weeks onward after start of the CZ diet. Scale bar, 50 µm.
An important very early feature of ferritin expression, however, is reduction in ferritin protein at 1 and 2 d after onset of the CZ diet. This reduction of ferritin at day 1 precedes the massive 60% loss of OLs by day 2 (Figs. 1, 3). As degradation and loss of ferritin (ferritinophagy) are a key feature that helps trigger ferroptosis, an iron-mediated cell death, we assessed whether ferroptosis contributes to the early OL cell loss. For this, we next assessed the expression of various markers of ferroptosis.
Expression of markers of ferroptosis and oxidative stress
Interestingly, mRNA expression of several markers of ferroptosis, namely, Nuclear receptor coactivator 4 (ncoa4), transferrin receptor 1 (tfr1), and cyclooxygenase-2 (cox-2), are increased at 2-4 d after start of CZ (Fig. 5A). The early increase in NCOA4 is particularly interesting as it is a cargo receptor that binds to ferritin heavy chain and shuttles it to autophagosomes for degradation (ferritinophagy) (Mancias et al., 2014). The degradation of ferritin will lead to reduction of ferritin protein and release of bioactive iron into the cytosol. The increased expression of ncoa4 mRNA at 2 d (Fig. 5A; Control vs 2 d: p = 0.003, n = 4 or 5, F(7,26) = 3.965, p = 0.005, one-way ANOVA with Bonferroni's multiple comparison test) may therefore underlie the reduction of ferritin protein seen at 1-2 d (Fig. 3). This is supported by immunofluorescence labeling, which shows that NCOA4 is detected in CC1+ OLs at the very early time points (Fig. 5Bi). Quantification of the number of NCOA4+/CC1+ cells at 1 d showed that a majority of NCOA4+ cells (73.5 ± 4.4%) are CC1+ OLs. We were unable to assess this in OPCs because of lack of availability of appropriate antibodies for triple labeling. Moreover, cells in the CC that stain strongly for NCOA4 show reduced ferritin expression (suggesting ferritin degradation), whereas cells that express low levels of NCOA4 express high levels of ferritin (Fig. 5C). As the increase in ncoa4 mRNA expression is seen at 2 d, it is unlikely to be in macrophages as these cells are only detected after 3 weeks (Fig. 4). Ferritin degradation will lead to release of bioavailable iron into the cytosol that will not be shielded, as ferritin protein (Fig. 3) and mRNA are reduced (Fig. 5Aiv; Control vs 2 d: p = 0.04; Control vs 4 d: p = 0.05; Control vs 5 weeks: p = 0.01, n = 4 or 5, F(7, 30) = 9.26, p < 0.001, one-way ANOVA with Bonferroni's multiple comparison test). Iron released from ferritin can thus contribute to ferroptosis. In addition, during this period (4 d), there is also an increase in the mRNA expression of tfr1 (Fig. 5Aii; Control vs 4 d: p < 0.001, n = 4 or 5, F(7,25) = 6.179, p < 0.001, one-way ANOVA with Bonferroni's multiple comparison test) in CZ fed mice. Immunofluorescence labeling shows that TfR1 expression is detected in CC1+ OLs in the CC at the very early time points after start of CZ (Fig. 5Bii). Increased expression of TfR1 in OLs would increase iron uptake that would add to the iron load in cells and make more unshielded iron available for ferroptosis-mediated cell death. Increased expression of TfR1 has been reported to increase sensitivity to ferroptosis (Yang and Stockwell, 2008). Transient low-level increase of unshielded iron is sufficient to trigger lipid peroxidation that leads to ferroptosis (discussed in the next section).
Interestingly, expression of the copper-rich ferroxidase, hephaestin (heph), which we have shown previously is expressed in OL (Schulz et al., 2011), is reduced at the early time point (1 week) after CZ diet (Fig. 5Av; Control vs 1 week: p = 0.04, n = 4 or 5, F(5,21) = 8.250, p < 0.001, one-way ANOVA with Bonferroni's multiple comparison test). Reduction in this ferroxidase could add to the buildup of bioavailable intracellular iron in OL (Schulz et al., 2011) and reduce conversion of ferrous to ferric iron that can give rise to toxic hydroxyl radicals. Similar reduction is also seen for sod-1, which neutralizes superoxide radicals (Fig. 5Avi; Control vs 1 week: p = 0.04; Control vs 3 weeks: p = 0.02, n = 4 or 5, F(5,20) = 3.045, p = 0.03, one-way ANOVA with Bonferroni's multiple comparison test). On the other hand, hemeoxygenase-1 (ho-1), which releases ferrous iron from heme, is increased early after start of the CZ diet (Fig. 5Avii; Control vs 1 week: p = 0.01; Control vs 3 weeks: p = 0.03; Control vs 4 and 5 weeks: p < 0.001; n = 4 or 5 per group, F(5,22) = 7.063, p < 0.001, one-way ANOVA with Bonferroni's multiple comparison test). This would all add to the iron load in cells, which along with the concomitant reduction in ferritin can induce ferroptosis. Heat shock protein β 1 (HSPB1; also known as Hsp-27) reduces iron-mediated generation of lipid peroxidation and thus confers protection against ferroptosis (Sun et al., 2015). Reduction in hspb1mRNA expression is therefore another hallmark of ferroptosis. We found that hspb1 expression is significantly reduced during the first week and is ∼25% of normal control levels at 2 and 4 d after start of CZ (Fig. 5Aviii; Control vs 2 and 4 d, 1 week: p < 0.001; n = 4 or 5, F(7,26) = 16.24, p < 0.001, one-way ANOVA with Bonferroni's multiple comparison test).
Increase in lipid peroxidation and reduction in GPX4 and system Xc
Lipid peroxidation is an essential hallmark of ferroptosis. Lipid peroxidation of membrane lipids in organelles, plasma membranes, and myelin generate 4-hydroxy-2-nonenal (4-HNE), which is highly toxic. We therefore assessed lipid peroxidation by immunohistochemistry for 4-HNE. This analysis of the midline region of the CC showed about a 2.5-fold increase in 4-HNE levels as early as 2 d after start on the CZ diet (Fig. 6A,B). This staining remained elevated at ∼2-fold for the next 2 weeks, followed by greater increases between 3 and 4 weeks (Fig. 6A,B). 4-HNE therefore is increased very rapidly after start of the CZ diet, at the time when the maximum number of OL loss is detected (first week), followed later by increase during the period of myelin breakdown and clearance (3-5 weeks) (Fig. 6B; Control vs 2 d, 1 and 3 weeks, 4 and 5 weeks: p < 0.001; Control vs 2 weeks: p = 0.001; 3 weeks vs 5 weeks: p < 0.001; n = 4 or 5 per group, F(6,22) = 67.41, p < 0.001, one-way ANOVA with Tukey's multiple comparison test). Double-immunofluorescence labeling for 4-HNE and CC1 showed that it is expressed in CC1+ OLs in the CC of CZ-treated mice (Fig. 6Ci,Cii). MDA, an end-product of polyunsaturated fatty acid peroxidation, is also detected in CC1+ OLs in CZ-treated mice (Fig. 6Ciii,Civ). Such staining was not detected in OLs in control mice on normal mouse chow. This combined with the finding that NCOA4 is expressed mainly in OLs suggests that in the CZ model ferroptosis may occur selectively in OLs.
Figure 6.
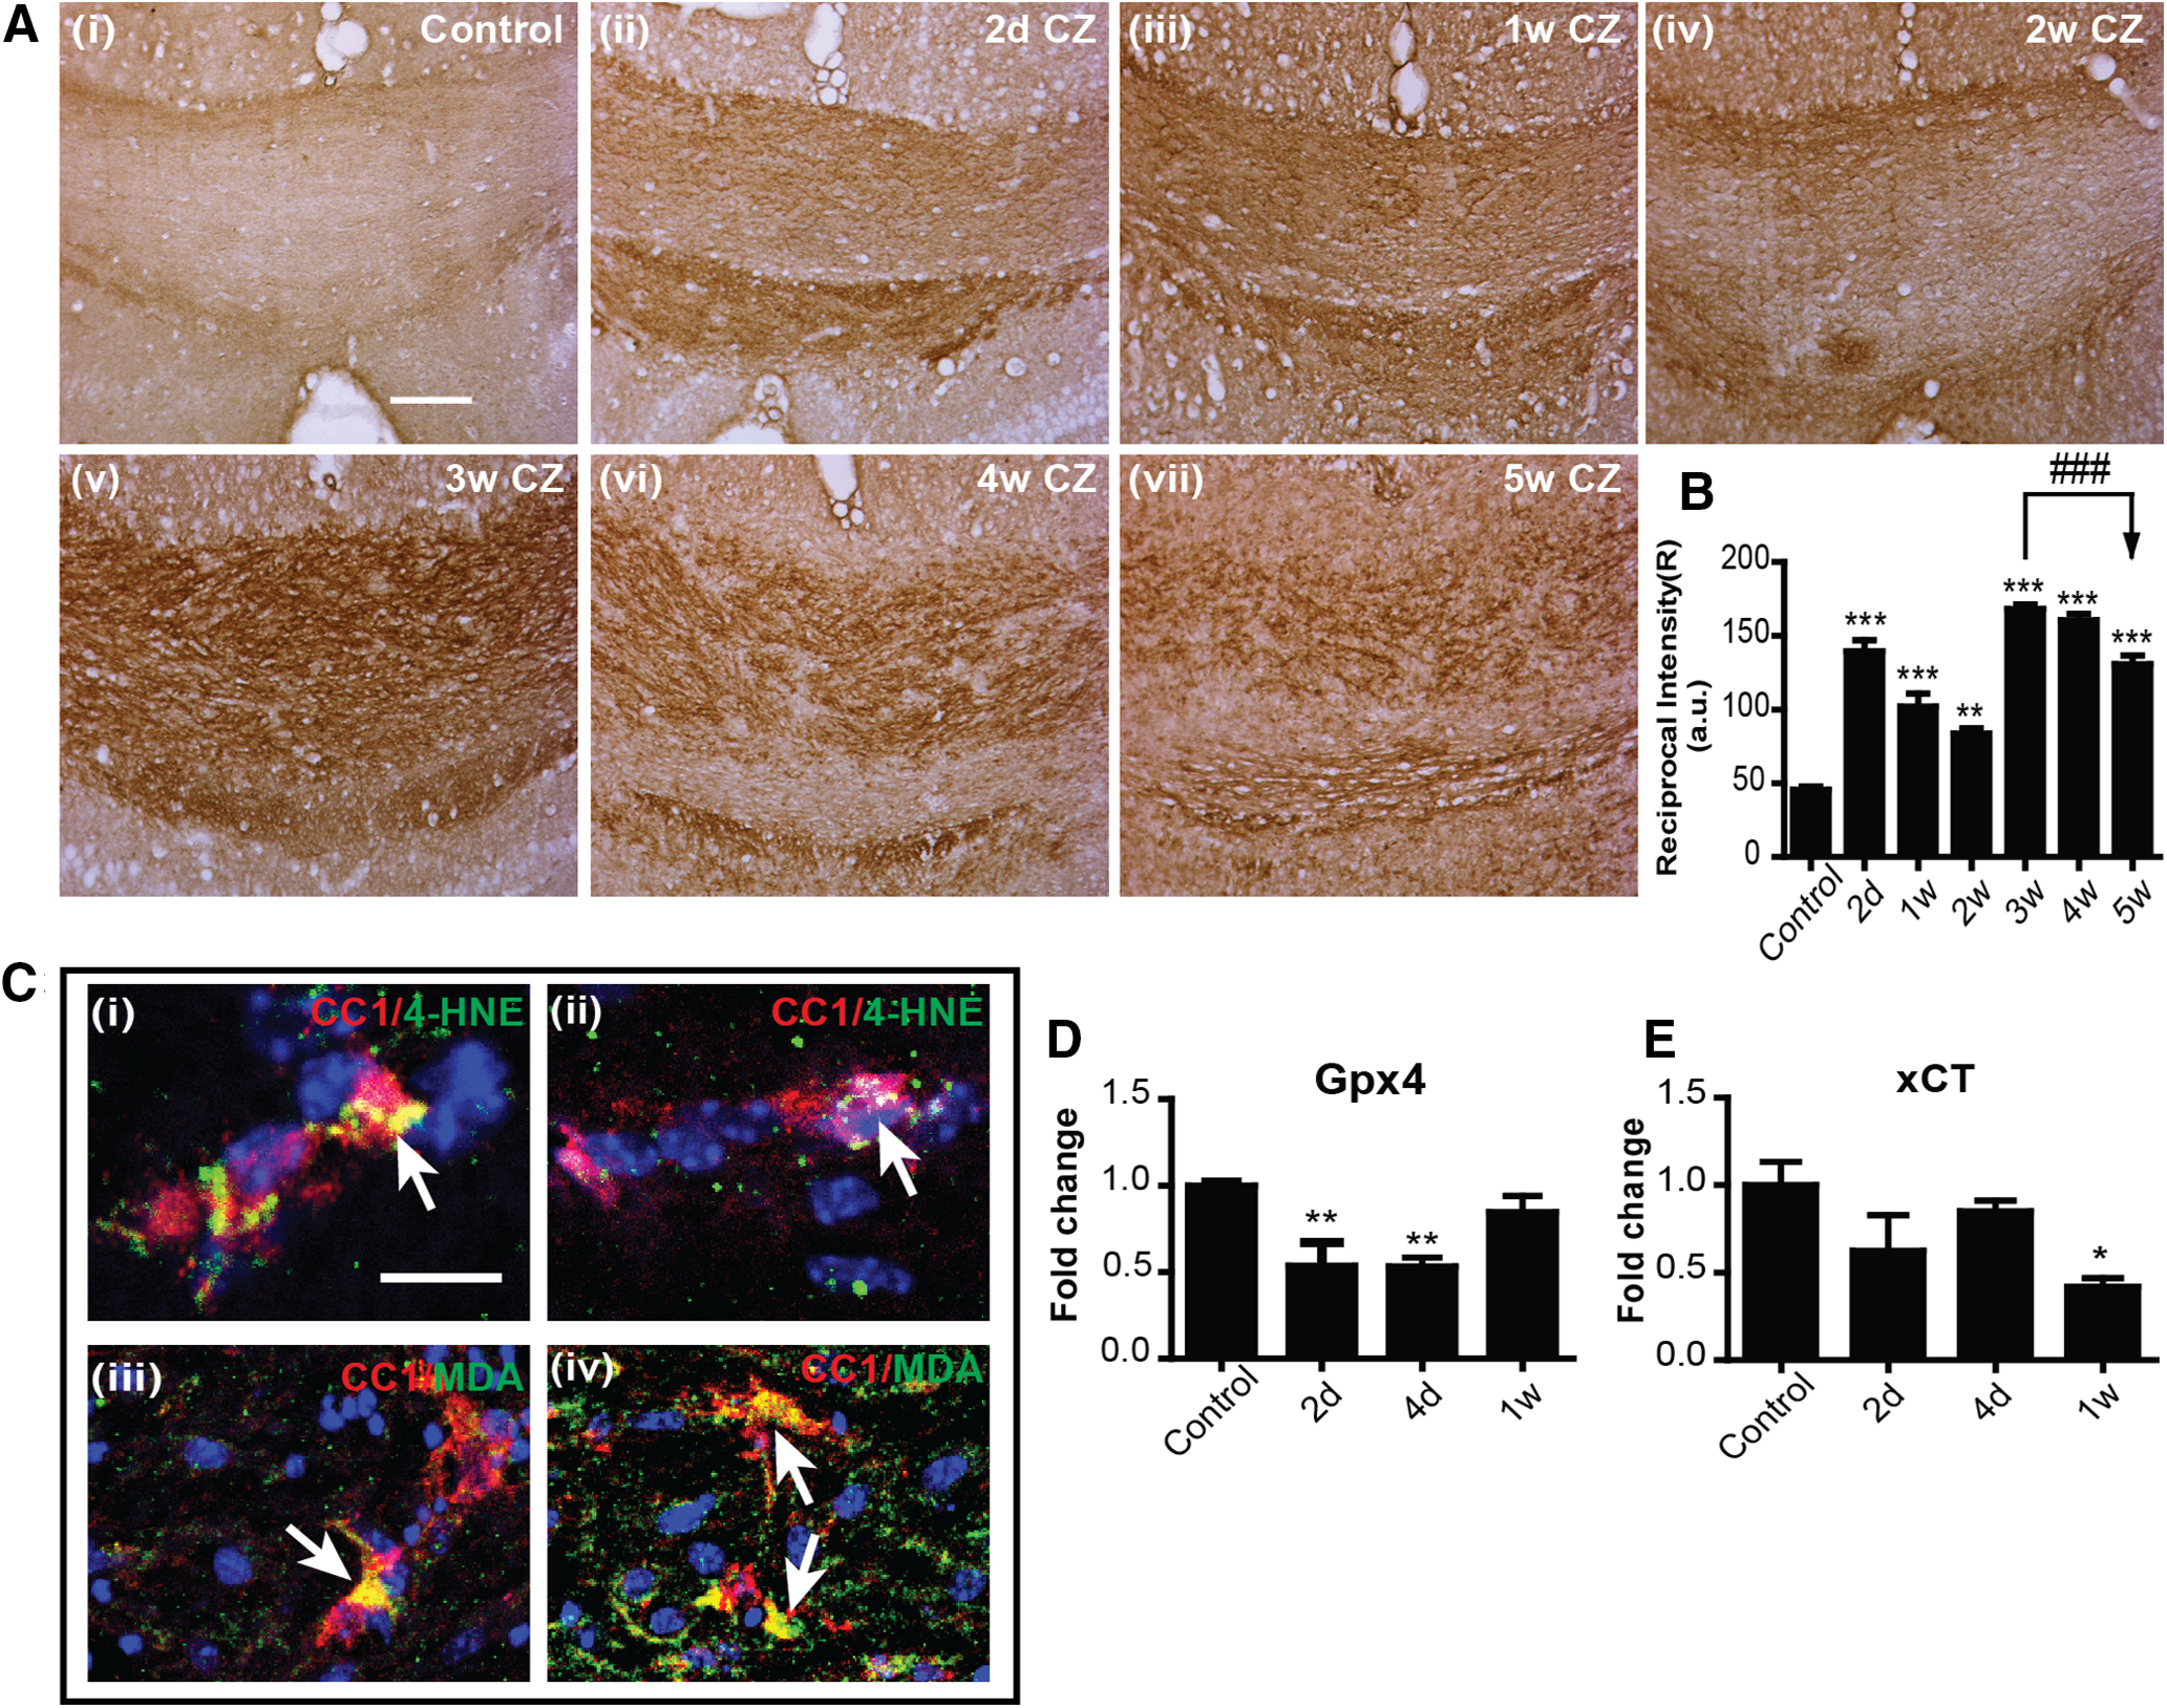
Lipid peroxidation in the CC of mice treated with CZ. A, Immunohistochemical staining for 4-HNE (brown reaction product) in the midline region of the caudal CC of control mice (Ai) and mice treated with CZ from 2 d to 5 weeks (Aii–Avii). Scale bars, 50 µm. B, Graph represents the quantification of 4-HNE staining estimated as the “reciprocal intensity” values analyzed with ImageJ. Note the rapid increase in 4-HNE staining as early as 2 d and continuing for the entire 5 week period. Asterisks indicate significant difference from control group. Arrows indicate difference from 3 weeks. n = 4 or 5 animals per group. Data are mean ± SEM. **p < 0.01. ***, ###p < 0.001. Scale bar: A, 100 μm. C, Merged images of double-immunofluorescence labeling for 4-HNE (green/yellow) and CC1+ (red) in OLs in the CC of mice on a CZ diet for 2 d (Ci,Cii), and MDA (green/yellow) and CC1+ (red) in OLs seen in the CC 3 weeks on a CZ diet (Ciii,Civ). Yellow represents double labeling in these merged images (arrows). Sections also stained for DAPI nuclear stain. Scale bar: A, 10 μm. D, E, Graphs represent the reduction in protein expression of GPX4 (D) and xCT (E) during the first week after start of CZ diet detected by Western blots. Asterisks indicate significant differences from the control group. n = 4 or 5 per group (2 animals pooled for each sample; total 8-10 animals used for the experiment). Data are mean ± SEM. *p < 0.05. **p < 0.01.
Another important feature of ferroptosis is insufficiency of effective levels of glutathione antioxidant mechanisms to scavenge lipid radicals. Two key molecules in this pathway include glutathione peroxidase 4 (GPX4) and system xC (xCT). GPX4 catalyzes the reaction between glutathione and lipid peroxides, thus protecting cells against lipid peroxidation. We found significant reduction in GPX4 protein expression by Western blot at 2 and 4 d after start of CZ, indicating reduced protection against lipid peroxidation (Fig. 6D; Control vs 2 d: p = 0.009; Control vs 4 d: p = 0.006; n = 4 or 5 per group [2 animals pooled for each sample; total 8-10 animals used for the experiment], F(3,13) = 7.898, p = 0.003, one-way ANOVA with Tukey's multiple comparison test). xCT is a cystine-glutamate antiporter that provides cystine for glutathione synthesis and is required to maintain high levels of glutathione (Bridges et al., 2012). We found reduction in xCT protein by Western blot during the first week, being significantly reduced 7 d after start of the CZ diet (Fig. 6E; Control vs 1 week: p = 0.04; n = 3-5 per group [2 animals pooled for each sample; total 8-10 animals used for the experiment], F(3,11) = 3.476, p = 0.05, one-way ANOVA with Tukey's multiple comparison test). Reduction in expression of GPX4 and xCT during the first week on the CZ diet suggests that ferroptosis may contribute to OL cell death seen during this early period on CZ. A recent study showed that xCT is diminished in experimental autoimmune encephalomyelitis (EAE) (Hu et al., 2019), and blocking xCT with glutamate induces OL cell death in primary cell cultures (Novgorodov et al., 2018).
Fer-1 prevents CZ-induced loss of OLs and myelin
To obtain direct evidence that ferroptosis plays a role in the CZ-induced loss of mature OLs, we treated mice on the CZ diet with Fer-1, a potent and selective small-molecule inhibitor of ferroptosis that prevents lipid peroxidation by acting as a radical scavenging agent (Dixon et al., 2012; Skouta et al., 2014; Zilka et al., 2017). As the greatest loss of OL occurred by day 2 on CZ, which also coincided with the timing of expression of ferroptosis markers, we fed mice with CZ and treated one group with Fer-1 (10 mg/kg, daily, i.p.) on days 0 and 1 (24 h) and the control group with vehicle. The brains were collected for analysis on day 2 after perfusion with fixative. The number of CC1+ OLs in the mid-region of the CC was counted. Daily treatment with Fer-1 blocked CZ-induced OL loss (Fig. 7A,B; Control vs Vehicle: p < 0.001; Vehicle vs Fer-1: p = 0.002; n = 4 or 5 per group, F(2,10) = 22.23, p < 0.001, one-way ANOVA with Tukey's multiple comparison test). Daily treatment with Fer-1 is required for the rescue effect as this is lost if animals are treated only once on day 1, that is, 24 h after start of CZ and kept on CZ for 2 additional days (data not shown). Also, the effect of Fer-1 is lost if mice on CZ are treated daily with the inhibitor for 4 d followed by the CZ diet for another 1 or 2 weeks (data not shown). Therefore, continuous treatment with Fer-1 is required.
Figure 7.
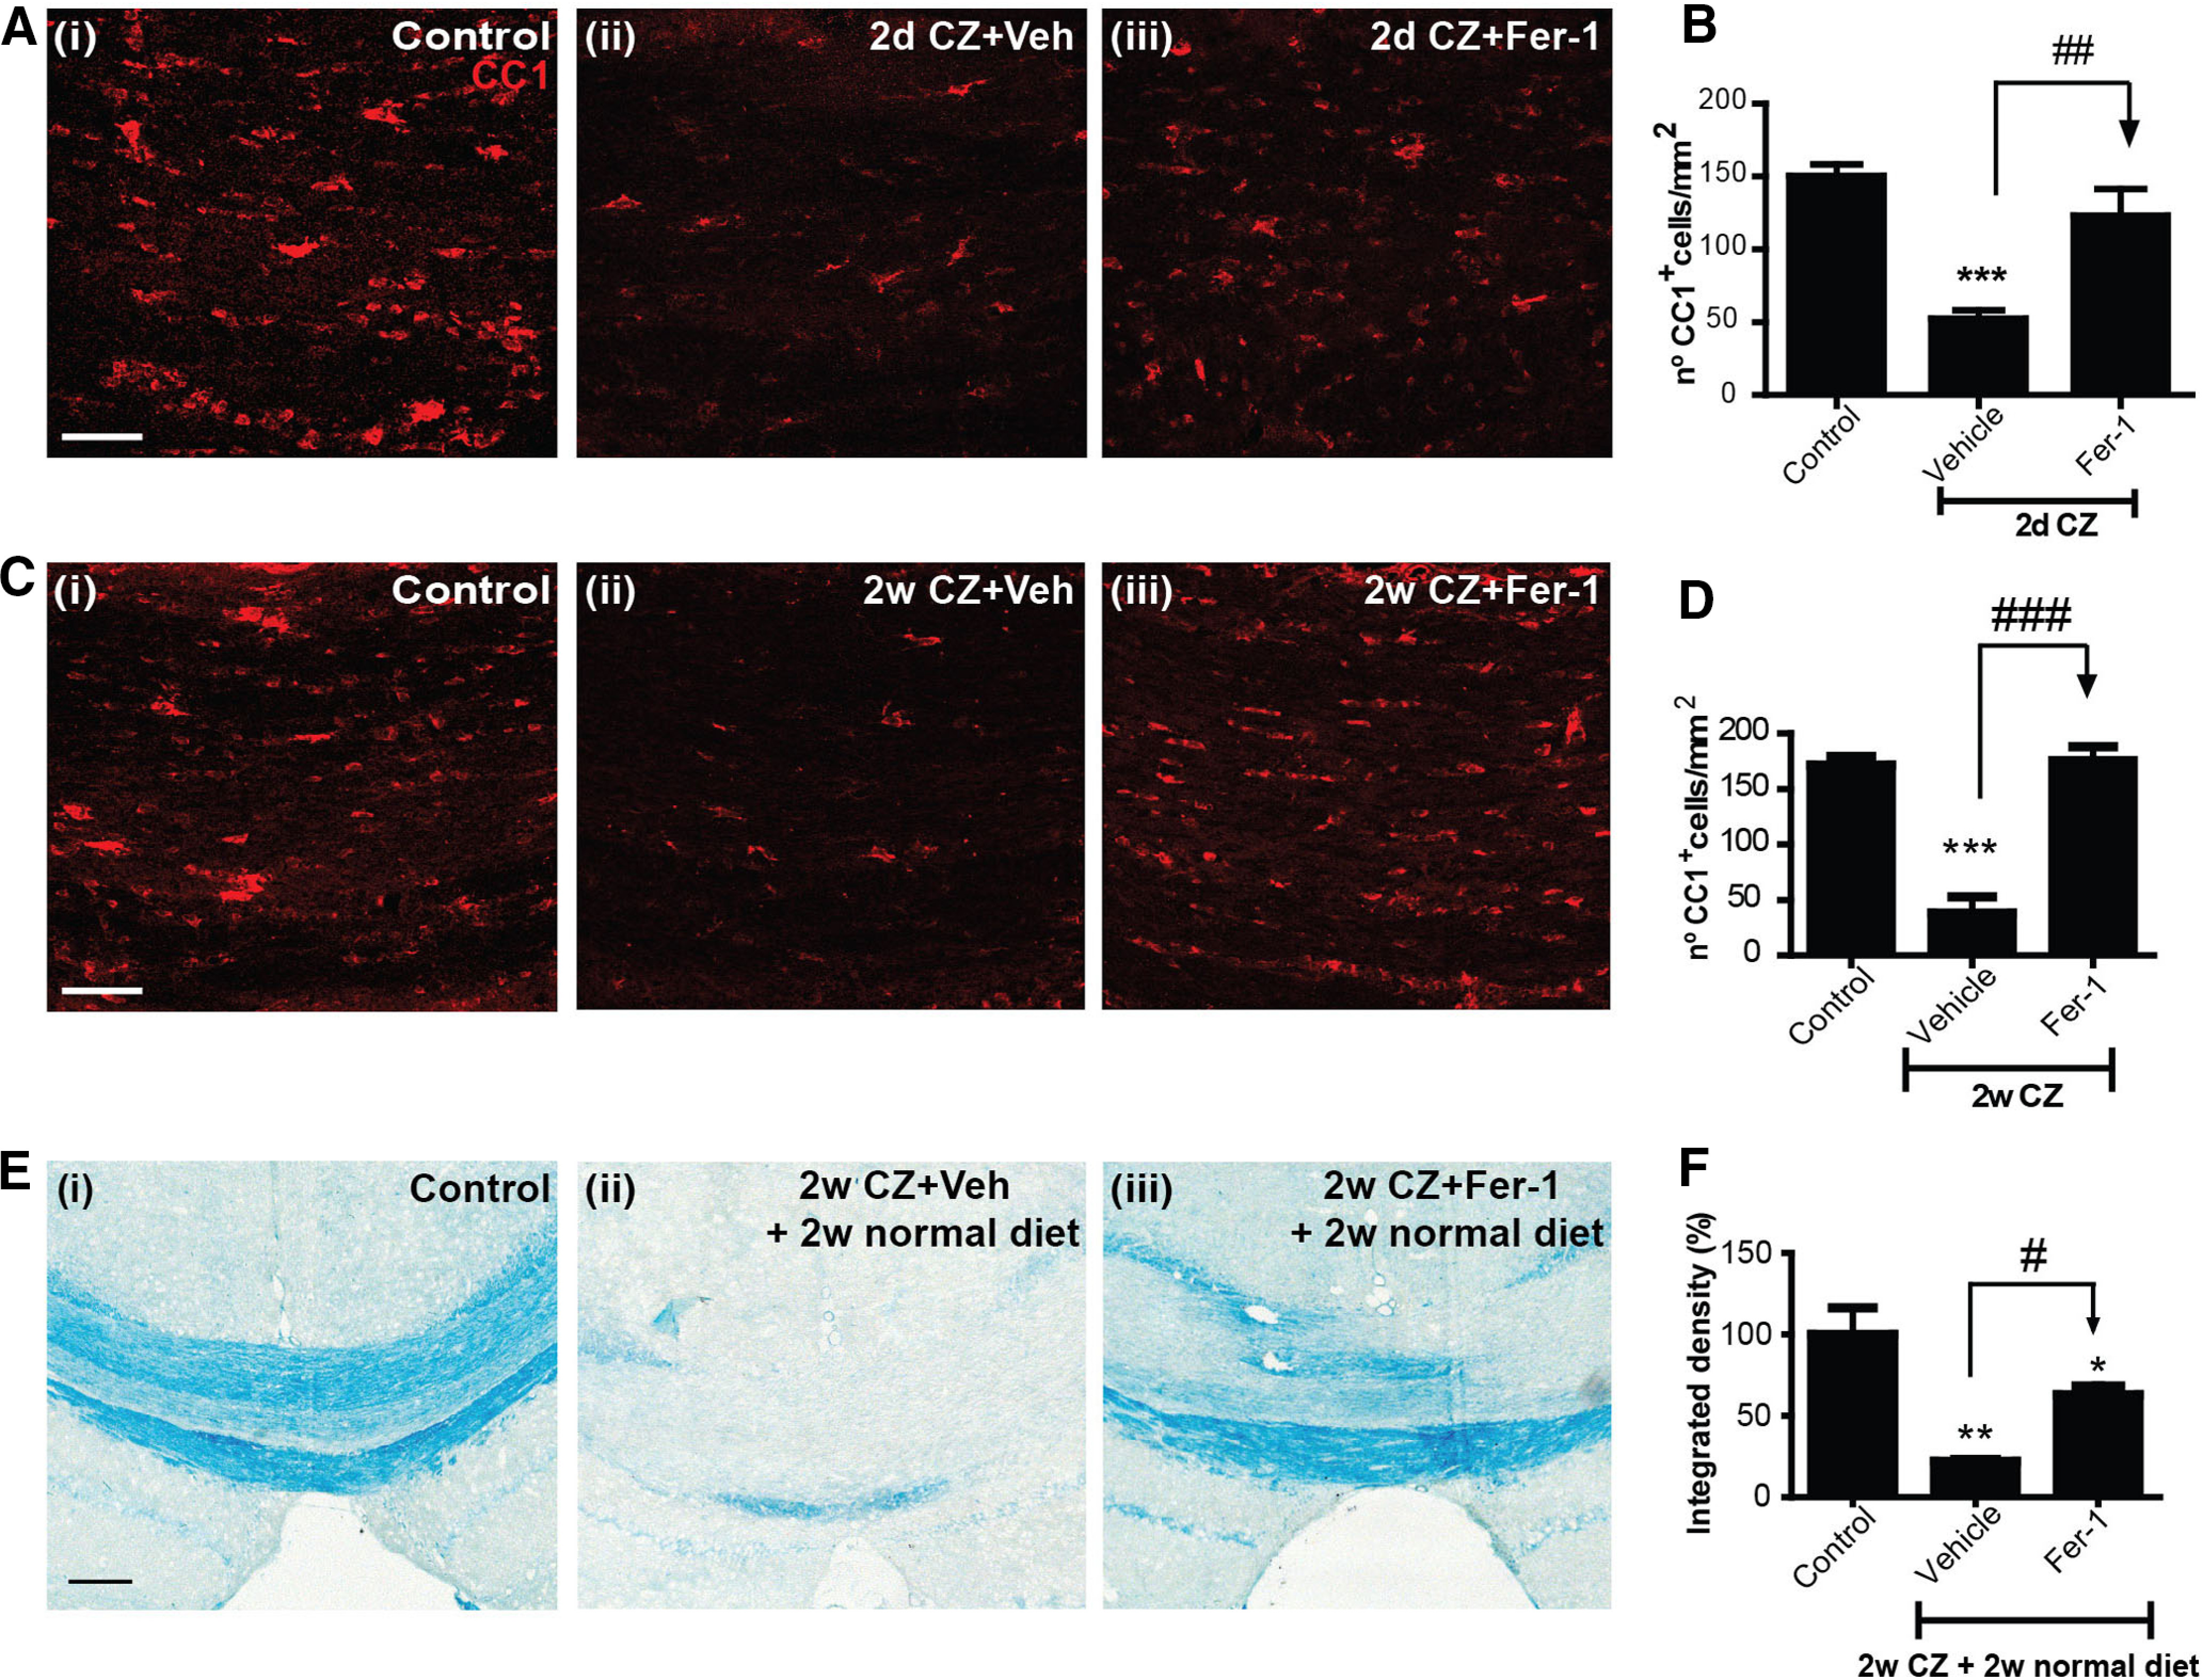
Ferroptosis induces CZ-mediated OL and myelin loss. A, Immunofluorescence labeling for CC1+ mature OLs in the midline region of the CC in (Ai) control mice on a normal diet; (Aii) mice on the CZ diet and treated with vehicle IP for 2 d; and (Aiii) mice on a CZ diet and treated with Fer-1 intraperitoneally for 2 d. B, Quantification of CC1+ cells (with DAPI-stained nuclei; DAPI staining not shown in A) shows that the ferroptosis inhibitor blocks OL loss during the critical 2 d period when maximum number of cells are lost (see Fig. 1). C, Immunofluorescence labeling for CC1+ OLs in the midline region of the CC in (Ci) control mice on a normal diet; (Cii) mice on the CZ diet and treated with vehicle intraperitoneally for 2 weeks; and (Ciii) mice on a CZ diet and treated with Fer-1 intraperitoneally for 2 weeks. D, Graph represents sparing of OL loss induced by CZ after daily 2 week treatment with ferroptosis inhibitor (Fer-1). E, As myelin clearance after CZ treatment takes 4–5 weeks (see Fig. 1E), we treated mice on the CZ diet daily for 2 weeks with Fer-1 and then put them back on the normal diet for another 2 weeks (total of 4 week survival) and assessed LFB staining for myelin. Mice on the control diet (Ei) show normal myelin staining of the midline portion of the CC, while mice on the CZ diet treated with vehicle (Eii) show marked loss of myelin. In contrast, mice on the CZ diet treated with Fer-1 for the first 2 weeks (Eiii) show remarkable sparing of myelin. F, Statistically significant sparing of myelin in CZ fed mice treated with the ferroptosis inhibitor (Fer-1) for 2 weeks and kept for a further 2 weeks on a normal diet. n = 4 or 5 animals per group. Data are mean ± SEM. Asterisks indicate significant differences from the control group. Arrows indicate difference from CZ+ vehicle group. *, #p < 0.05. **, ##p < 0.01. ***, ###p < 0.001. Scale bars, 50 μm.
We next assessed whether blocking ferroptosis also prevents myelin loss. As complete myelin clearance in the CC in mice fed CZ takes 4-5 weeks (Fig. 1E) (Gudi et al., 2009), we would need to wait for at least 4 weeks to assess myelin loss. To minimize the length of time, mice were treated with Fer-1, we first tested whether OL loss can be prevented if CZ-fed mice were treated with Fer-1 daily for 2 weeks. Such treatment prevented OL loss when assessed immediately after end of the 2 week treatment period (Fig. 7C,D; Control vs Vehicle: p < 0.001; Vehicle vs Fer-1: p < 0.001; n = 5 per group, F(2,12) = 43.07, p < 0.001, one-way ANOVA with Tukey's multiple comparison test). We next treated mice on the CZ diet with Fer-1 or vehicle daily for 2 weeks, followed by another 2 weeks on normal mouse chow for a total of 4 weeks to allow enough time for damaged myelin to be cleared by macrophages. Mice on the CZ diet treated with vehicle showed marked loss of myelin at 4 weeks (Fig. 7E,F; the myelin loss is similar in extent to that seen at 5 weeks on the CZ diet, Fig. 1E). In contrast, mice on the CZ diet treated with Fer-1 showed significant sparing of myelin (Fig. 7E,F; Control vs Vehicle: p = 0.008; Vehicle vs Fer-1: p = 0.01; Control vs Fer-1: p = 0.03; n = 4 or 5 per group, Mann–Whitney test). Thus, blocking ferroptosis prevented both OL and myelin loss induced by CZ.
To further assess whether Fer-1 treatment prevents lipid peroxidation, we examined 4-HNE levels in tissue sections from both the 2 d and 2 week Fer-1-treated and control groups. As shown in Figure 8, Fer-1 treatment reduces CZ-induced lipid peroxidation to control levels (Control vs 2 d CZ + Veh, 2 weeks CZ + Veh: p < 0.001; 2 d CZ + Veh vs 2 d CZ + Fer-1: p < 0.001; 2 weeks CZ + Veh vs 2 weeks CZ + Fer-1: p = 0.002; n = 4 or 5 per group, F(4,17) = 21.73, p < 0.001, one-way ANOVA with Bonferroni's multiple comparison test).
Figure 8.

Blocking ferroptosis with Fer-1 treatment prevents CZ-induced lipid peroxidation. A, Immunohistochemical staining for 4-HNE in tissue sections in the midline region of the CC from control mice treated with the normal diet (Ai), and mice 2 d on CZ + vehicle (Aii), 2 d on CZ + Fer-1 (Aiii), 2 weeks on CZ + vehicle (Aiv), and 2 weeks on CZ + Fer-1 (Av). Note the reduction in 4-HNE staining in mice treated with Fer-1 (Aiii, Av). B, Quantification of 4-HNE staining estimated as the “reciprocal intensity” values analyzed with ImageJ. Graph represents that Fer-1 treatment of CZ fed mice for 2 d or 2 weeks significantly reduces lipid peroxidation. Asterisks indicate significant differences between control mice on a normal diet. Arrows indicate significant differences between groups indicated. ##p < 0.01. ***, ###p < 0.001. Scale bars, 50 μm.
Discussion
We provide evidence that copper chelation by CZ leads to dysregulation of iron homeostasis and ferroptosis-mediated OL loss and demyelination (Fig. 9). These studies were conducted on the CC in mice fed with a diet containing 0.2% CZ. This copper chelation induces rapid loss of ∼65% of mature OLs by 2 d and 80% loss by 1 week after onset of the CZ diet. Interestingly, we see an early reduction in protein levels of ferritin that precedes OL loss and correlates with the expression of ncoa4, a gene that codes for a protein that binds to cytosolic ferritin and shuttles it to autophagosomes for degradation and the release of bioactive iron. During this early period of the first 2-4 d on CZ, alterations are also seen in the expression of markers of ferroptosis: increase in NCOA4, TfR1, and cox-2 and reduction in ferritin and hspb1. These changes are accompanied by a rapid and sustained increase in lipid peroxidation in the CC (another key feature of ferroptosis), starting as early as 2 d after start of the CZ diet. This is associated with reduction in GPX4, the antioxidant enzyme required to scavenge lipid radicals and thus control lipid peroxidation. Reduction of GPX4 is another indicator of ferroptosis. Furthermore, there is also a reduction in expression of xCT, an antiporter that brings cystine into cells, which is needed for glutathione synthesis. Importantly, treatment with Fer-1, a selective inhibitor of ferroptosis, prevents the early loss of OLs at 2 d; and blocking ferroptosis in the first 2 weeks significantly reduces OL and myelin loss. This work provides clear evidence that copper chelation by CZ leads to very rapid iron-mediated loss of OLs and myelin via ferroptosis.
Figure 9.

Schematic diagram showing disruption of key elements of the ferroptosis pathway in mice fed a CZ diet that leads to OL and myelin loss. This includes increase in TfR1, which would increase iron load in cells, and increase in NCOA4 that shuttles ferritin to autophagosomes for degradation and release of Fe2+ iron, which via the Fenton reaction would trigger lipid peroxidation. This is accompanied by a reduction in System Xc and GPX4, which would lead to reduced glutathione (GSH) and its ability to scavenge lipid radicals, leading to ferroptosis-mediated loss of OL and myelin. The ferroptosis inhibitor experiments provide evidence for the involvement of ferroptosis in CZ-induced OL loss and demyelination.
Cellular iron levels are regulated by the balance between iron uptake, efflux, and storage. One of the cellular iron uptake mechanisms is via TfR1 which binds transferrin-bound diferric iron, which is internalized via endosomes, and the iron subsequently released into the cytosol (Ponka and Lok, 1999). TfR1 expression is increased in OLs in the first 4 d after start of the CZ diet, suggesting an early increase in iron uptake into these cells. Once inside the cell, iron is used within mitochondria for the formation of iron-sulfur clusters and heme, which are incorporated into enzymes and proteins in the cytosol and nucleus for numerous metabolic functions (Rouault et al., 1992; Rouault and Tong, 2005). Excess iron in the cytosol is stored in ferritin (Arosio and Levi, 2002). Therefore, degradation of ferritin can lead to a rapid increase in bioactive iron in the labile iron pool in the cytosol. Normally, when there is a need for iron in cells, ferritin is degraded in lysosomes (ferritinophagy) and the iron released and used. Ferritinophagy has also been shown to play a key role in ferroptosis (Mancias et al., 2014). Interestingly, we see rapid reduction in ferritin protein in the first 2 d after the start of the CZ diet, which coincides with the increased expression of NCOA4, a cargo receptor that binds to ferritin and shuttles it to autophagosomes where it binds to the ATG8 proteins on the surface of autophagosomes (Mancias et al., 2014). These double-membrane autophagosomes are then delivered to lysosomes for degradation (Mancias et al., 2014), resulting in loss of ferritin and the release of bioavailable iron. This rapid reduction in ferritin protein along with increased bioavailable iron released by ferritinophagy together with increased iron uptake via increases in TfR1 expression will lead to excess unshielded iron (i.e., iron not sequestered in ferritin) that can induce lipid peroxidation that triggers ferroptosis (Yang and Stockwell, 2016). This level of iron is hard to detect using iron histochemistry but appears to be sufficient to induce ferroptosis. Importantly, the reduction in ferritin at 1 d precedes the loss of OL (2 d). An earlier study also reported a rapid loss of OLs after 2 d of CZ (Buschmann et al., 2012; Petkovic et al., 2016), and another study reported early loss of several myelin mRNA by 1 week (Morell et al., 1998), which could also reflect loss of OLs. By 2 d, we see that 63% of mature OL are lost, indicating that the internodal myelin belonging to these OLs would be metabolically severed from their cell bodies. Although the myelin looks normal at 2 d when stained with myelin stains, we see a rapid increase in lipid peroxidation (4-HNE staining) of myelin-like structures in the CC. Furthermore, strong evidence lending further support to early pathologic changes in myelin was obtained using spectral imaging and the solvatochromic properties of the fluorescent probe Nile Red. This dye brightly labels lipid-rich structures and undergoes shifts in emission spectrum depending on the polarity of its microenvironment (Nigam and Rutan, 2001). Higher polarity leads to longer wavelength emission (as seen in the CC after only 2 d of CZ exposure; Fig. 2), indicating changes in lipid composition (e.g., loss of nonpolar lipids) and/or lipid order and therefore nanostructure of myelin membranes (Niko et al., 2016). As ferroptosis in the CZ experiments is expected to be induced in the cytosol where ferritin degradation occurs, we expect that the loss of OLs is rapidly followed by damage to myelin, rather than a reverse retrograde effect. This issue is difficult to resolve directly at present because of the very tight temporal sequence of these events. Importantly, the novel Nile Red spectral microscopy approach provides a valuable tool to detect very early changes in the physicochemical properties of myelin that could be of great value in identifying very early pathology in normal appearing white matter in conditions, such as MS. Nile Red spectral imaging may also be useful to detect myelin pathology in other neurologic conditions, such as CNS trauma, concussions, and stroke, in which myelin damage may be more widespread but not evident by traditional techniques.
Ferroptosis is a form of nonapoptotic cell death first described in the context of cancer (Dixon et al., 2012) but more recently in neurodegenerative diseases, such as stroke and Parkinson's disease (Guiney et al., 2017; Stockwell et al., 2017; Tuo et al., 2017). Ferroptosis is caused when iron-mediated free radicals trigger lipid peroxidation in the presence of a limited ability of cells to repair lipid damage because of glutathione insufficiency (Yang and Stockwell, 2016; Stockwell et al., 2017). Interestingly, a recent proteomics study of an OL cell line treated with CZ and of brains of mice treated with CZ showed reduction in glutathione and one of its precursors, cysteine (Taraboletti et al., 2017). Lipidomics analysis of the brain after CZ treatment also showed global changes in lipid homeostasis and reduction of ceramides and diacylglycerols (Taraboletti et al., 2017). In the present study, we see significant reduction in GPX4 and xCT in the first week on the CZ diet when lipid peroxidation has already begun, suggesting that ferroptosis may play a role in CZ toxicity. Direct evidence for ferroptosis in CZ toxicity was obtained from experiments showing that the ferroptosis inhibitor, Fer-1, blocks OL and myelin loss. Ferroptosis does not require excessive iron to be deposited in the tissue that can be detected by iron histochemistry. Small, rapid, and transient fluctuations in intracellular iron that is not stored or shielded by ferritin is sufficient to trigger iron-mediated lipid peroxidation, which, in the absence of sufficient GPX4 required to protect against lipid peroxidation, results in ferroptosis. These conditions are present within the first few days on the CZ diet when the major proportion of OL loss occurs. Together, we show here that copper chelation by CZ leads to rapid dysregulation of molecules involved in iron homeostasis that trigger iron-mediated lipid peroxidation and ferroptosis of OL and subsequent myelin loss.
Our current study also indicates that, in the CZ model, NCOA4, required for mobilizing iron from ferritin, which is essential to trigger ferroptosis, appears to be expressed mainly in OLs in the CC. Moreover, lipid peroxidation markers (MDA and 4-HNE) also appear to be localized in OLs, thus suggesting that, in the CZ model, ferroptosis occurs mainly in OL. In addition, our ferroptosis inhibitor experiments indicate that ferroptosis may be the major OL cell death pathway in CZ toxicity. In other work, a ferroptosis agonist has also been reported to induce cell death in an OL cell line in vitro (Hoshino et al., 2020). More interestingly, a recent study showed that ferroptosis is the major OL cell death pathway in proteolipid protein 1 (PLP1) mutants (Nobuta et al., 2019). One recent study found decline of GPX4 in MS gray matter and in the spinal cord of EAE mice, and reported heterogeneity in the expression of GPX-4 in neurons and glia in EAE (Hu et al., 2019). Ferroptosis has been reported to occur in stroke and Parkinson's disease (Do Van et al., 2016; Tuo et al., 2017; Masaldan et al., 2019), but which cell types show ferroptosis in these conditions is currently not known. Other recent work showed that ferritin heavy chain released by OLs protects neurons against ferroptosis-mediated damage in vitro, and conditional deletion of Fth1 in OL in mice results in subtle neurodegenerative changes in the CNS with age (Mukherjee et al., 2020). These lines of evidence suggest that ferroptosis occurs in a variety of neurologic conditions and can involve different cell types. Our results indicate that the early release of iron from ferritin in the first 2 d after onset of the CZ diet triggers ferroptosis-mediated loss of OLs.
At later time points on the CZ diet, ferritin-bound iron in cells in the CC detected by ferritin immunostaining increases and appears to shift between cell types: first being found in ∼50% of the remaining 20% of mature CC1+ OLs at 2 weeks, followed by a switch to 72% of microglia/macrophages starting at 3 weeks. These ferritin+ OLs at 2 weeks are likely to be susceptible to iron-mediated cell death as OLs have low levels of the antioxidant glutathione (Juurlink et al., 1998; Todorich et al., 2009). Staining for 4-HNE and MDA, products of lipid peroxidation, are also detected in OLs in CZ-treated mice. The strong expression of ferritin in microglia/macrophages at 3–5 weeks may be because of iron taken up by phagocytosis of dying cells, as all cells have iron in the form of iron-sulfur clusters and heme proteins (Rouault and Tong, 2005). We have reported such accumulation of iron and increases in ferritin in microglia/macrophages in other neurologic conditions, such as animal models of spinal cord injury (Rathore et al., 2008), MS (Zarruk et al., 2015), and stroke (Ryan et al., 2019). There is also evidence that ferritin containing iron can be released from macrophages and taken up by OPCs for remyelination (Schonberg et al., 2012). As demyelination in the CC is complete after 5 weeks on a CZ diet and is followed by remyelination if put back on a normal diet (Gudi et al., 2009), it is possible that the buildup of ferritin in microglia/macrophages could be a source of iron for remyelination.
Although the involvement of a copper-iron connection in CZ toxicity has been of some interest in the past (Varga et al., 2018), our studies provide the first clear evidence that copper chelation by CZ leads to dysregulation of molecules involved in cellular iron homeostasis that leads to iron-mediated ferroptosis. This includes induction of lipid peroxidation in the CC, together with deficiency of GPX4 and xCT (glutathione insufficiency) that triggers ferroptosis. This induces OL and myelin loss, as demonstrated with the blocking experiments. This work provides evidence of a copper-iron connection in CZ-induced toxicity in the CNS. We provide the first evidence that ferroptosis-mediated oxidative stress underlies the rapid loss of OLs by as early as 2 d after start on the CZ diet. As OLs contain high levels of iron, the mobilization of this iron from ferritin stores can trigger ferroptosis. Such mobilization of iron may also occur in other neurologic conditions, such as MS, CNS trauma, and amyotrophic lateral sclerosis, in which iron accumulation occurs (Rathore et al., 2008; Jeong et al., 2009; Zarruk et al., 2015; Ryan et al., 2019), and thus warrants further study. Changes in the expression of molecules in the ferroptosis pathways shown in Figure 9 (e.g., NCOA4, GPX4, xCT) will determine whether ferroptosis occurs in such neurologic conditions. We also show the initial susceptibility of OPCs, but the later resistance of newly generated OPCs to CZ-induced toxicity likely underlies the rapid remyelination seen after CZ withdrawal after 5 weeks. These insights into the mechanisms underlying OL death can have implications for future studies using the CZ model and work on demyelinating disorders, such as MS and EAE. Ferroptosis is reported in a growing number of neurologic conditions, increasing its significance as a fundamentally important mechanism of CNS degeneration.
Footnotes
This work was supported by Canadian Institutes of Health Research Grant MOP-142231 and Multiple Sclerosis Society of Canada to S.D. P.J. and E.S.-N. were supported by Multiple Sclerosis Society of Canada postdoctoral fellowships. P.K.S. was supported by a Tier I Canada Research Chair, Canadian Institutes of Health Research, and Multiple Sclerosis Society of Canada. We thank Laura Curran, Ourania Tsatas, and Megan Morgan for technical assistance.
The authors declare no competing financial interests.
References
- Arosio P, Levi S (2002) Ferritin, iron homeostasis, and oxidative damage. Free Radic Biol Med 33:457–463. 10.1016/S0891-5849(02)00842-0 [DOI] [PubMed] [Google Scholar]
- Arosio P, Levi S (2010) Cytosolic and mitochondrial ferritins in the regulation of cellular iron homeostasis and oxidative damage. Biochim Biophys Acta 1800:783–792. 10.1016/j.bbagen.2010.02.005 [DOI] [PubMed] [Google Scholar]
- Bai CB, Sun S, Roholt A, Benson E, Edberg D, Medicetty S, Dutta R, Kidd G, Macklin WB, Trapp B (2016) A mouse model for testing remyelinating therapies. Exp Neurol 283:330–340. 10.1016/j.expneurol.2016.06.033 [DOI] [PMC free article] [PubMed] [Google Scholar]
- Bridges RJ, Natale NR, Patel SA (2012) System xc(-) cystine/glutamate antiporter: an update on molecular pharmacology and roles within the CNS. Br J Pharmacol 165:20–34. 10.1111/j.1476-5381.2011.01480.x [DOI] [PMC free article] [PubMed] [Google Scholar]
- Buschmann JP, Berger K, Awad H, Clarner T, Beyer C, Kipp M (2012) Inflammatory response and chemokine expression in the white matter corpus callosum and gray matter cortex region during cuprizone-induced demyelination. J Mol Neurosci 48:66–76. 10.1007/s12031-012-9773-x [DOI] [PMC free article] [PubMed] [Google Scholar]
- Calabrese L, Carbonaro M, Musci G (1989) Presence of coupled trinuclear copper cluster in mammalian ceruloplasmin is essential for efficient electron transfer to oxygen. J Biol Chem 264:6183–6187. [PubMed] [Google Scholar]
- Chakravarty S, Maitra S, Reddy RG, Das T, Jhelum P, Kootar S, Rajan WD, Samanta A, Samineni R, Pabbaraja S, Kernie SG, Mehta G, Kumar A (2015) A novel natural product inspired scaffold with robust neurotrophic, neurogenic and neuroprotective action. Sci Rep 5:14134. 10.1038/srep14134 [DOI] [PMC free article] [PubMed] [Google Scholar]
- Connor JR, Menzies SL, Burdo JR, Boyer PJ (2001) Iron and iron management proteins in neurobiology. Pediatr Neurol 25:118–129. 10.1016/S0887-8994(01)00303-4 [DOI] [PubMed] [Google Scholar]
- Dixon SJ, Lemberg KM, Lamprecht MR, Skouta R, Zaitsev EM, Gleason CE, Patel DN, Bauer AJ, Cantley AM, Yang WS, Morrison B, Stockwell BR (2012) Ferroptosis: an iron-dependent form of nonapoptotic cell death. Cell 149:1060–1072. 10.1016/j.cell.2012.03.042 [DOI] [PMC free article] [PubMed] [Google Scholar]
- Do Van B, Gouel F, Jonneaux A, Timmerman K, Gelé P, Pétrault M, Bastide M, Laloux C, Moreau C, Bordet R, Devos D, Devedjian JC (2016) Ferroptosis, a newly characterized form of cell death in Parkinson's disease that is regulated by PKC. Neurobiol Dis 94:169–178. 10.1016/j.nbd.2016.05.011 [DOI] [PubMed] [Google Scholar]
- George R, Griffin JW (1994) Delayed macrophage responses and myelin clearance during Wallerian degeneration in the central nervous system: the dorsal radiculotomy model. Exp Neurol 129:225–236. 10.1006/exnr.1994.1164 [DOI] [PubMed] [Google Scholar]
- Griffin JW, George R, Lobato C, Tyor WR, Yan LC, Glass JD (1992) Macrophage responses and myelin clearance during Wallerian degeneration: relevance to immune-mediated demyelination. J Neuroimmunol 40:153–165. 10.1016/0165-5728(92)90129-9 [DOI] [PubMed] [Google Scholar]
- Gudi V, Moharregh-Khiabani D, Skripuletz T, Koutsoudaki PN, Kotsiari A, Skuljec J, Trebst C, Stangel M (2009) Regional differences between grey and white matter in cuprizone induced demyelination. Brain Res 1283:127–138. 10.1016/j.brainres.2009.06.005 [DOI] [PubMed] [Google Scholar]
- Gudi V, Gingele S, Skripuletz T, Stangel M (2014) Glial response during cuprizone-induced de- and remyelination in the CNS: lessons learned. Front Cell Neurosci 8:73. [DOI] [PMC free article] [PubMed] [Google Scholar]
- Guiney SJ, Adlard PA, Bush AI, Finkelstein DI, Ayton S (2017) Ferroptosis and cell death mechanisms in Parkinson's disease. Neurochem Int 104:34–48. 10.1016/j.neuint.2017.01.004 [DOI] [PubMed] [Google Scholar]
- Han O, Kim EY (2007) Colocalization of ferroportin-1 with hephaestin on the basolateral membrane of human intestinal absorptive cells. J Cell Biochem 101:1000–1010. 10.1002/jcb.21392 [DOI] [PubMed] [Google Scholar]
- Hoshino T, Yamakado H, Takahashi R, Matsuzawa SI (2020) Susceptibility to erastin-induced ferroptosis decreases during maturation in a human oligodendrocyte cell line. FEBS Open Bio 10:1758–1764. 10.1002/2211-5463.12923 [DOI] [PMC free article] [PubMed] [Google Scholar]
- Hu CL, Nydes M, Shanley KL, Morales Pantoja IE, Howard TA, Bizzozero OA (2019) Reduced expression of the ferroptosis inhibitor glutathione peroxidase-4 in multiple sclerosis and experimental autoimmune encephalomyelitis. J Neurochem 148:426–439. 10.1111/jnc.14604 [DOI] [PMC free article] [PubMed] [Google Scholar]
- Jeong SY, David S (2003) Glycosylphosphatidylinositol-anchored ceruloplasmin is required for iron efflux from cells in the central nervous system. J Biol Chem 278:27144–27148. 10.1074/jbc.M301988200 [DOI] [PubMed] [Google Scholar]
- Jeong SY, David S (2006) Age-related changes in iron homeostasis and cell death in the cerebellum of ceruloplasmin-deficient mice. J Neurosci 26:9810–9819. 10.1523/JNEUROSCI.2922-06.2006 [DOI] [PMC free article] [PubMed] [Google Scholar]
- Jeong SY, Rathore KI, Schulz K, Ponka P, Arosio P, David S (2009) Dysregulation of iron homeostasis in the CNS contributes to disease progression in a mouse model of amyotrophic lateral sclerosis. J Neurosci 29:610–619. 10.1523/JNEUROSCI.5443-08.2009 [DOI] [PMC free article] [PubMed] [Google Scholar]
- Juurlink BH, Thorburne SK, Hertz L (1998) Peroxide-scavenging deficit underlies oligodendrocyte susceptibility to oxidative stress. Glia 22:371–378. [DOI] [PubMed] [Google Scholar]
- Karamita M, Barnum C, Mobius W, Tansey MG, Szymkowski DE, Lassmann H, Probert L (2017) Therapeutic inhibition of soluble brain TNF promotes remyelination by increasing myelin phagocytosis by microglia. JCI Insight 2:e87455 10.1172/jci.insight.87455 [DOI] [PMC free article] [PubMed] [Google Scholar]
- Kilkenny C, Browne WJ, Cuthill IC, Emerson M, Altman DG (2010) Improving bioscience research reporting: the ARRIVE guidelines for reporting animal research. PLoS Biol 8:e1000412. 10.1371/journal.pbio.1000412 [DOI] [PMC free article] [PubMed] [Google Scholar]
- Kipp M, Clarner T, Dang J, Copray S, Beyer C (2009) The cuprizone animal model: new insights into an old story. Acta Neuropathol 118:723–736. 10.1007/s00401-009-0591-3 [DOI] [PubMed] [Google Scholar]
- Koutsoudaki PN, Skripuletz T, Gudi V, Moharregh-Khiabani D, Hildebrandt H, Trebst C, Stangel M (2009) Demyelination of the hippocampus is prominent in the cuprizone model. Neurosci Lett 451:83–88. 10.1016/j.neulet.2008.11.058 [DOI] [PubMed] [Google Scholar]
- Laflamme N, Cisbani G, Prefontaine P, Srour Y, Bernier J, St-Pierre MK, Tremblay ME, Rivest S (2018) mCSF-induced microglial activation prevents myelin loss and promotes its repair in a mouse model of multiple sclerosis. Front Cell Neurosci 12:178. [DOI] [PMC free article] [PubMed] [Google Scholar]
- Lampron A, Larochelle A, Laflamme N, Prefontaine P, Plante MM, Sanchez MG, Yong VW, Stys PK, Tremblay ME, Rivest S (2015) Inefficient clearance of myelin debris by microglia impairs remyelinating processes. J Exp Med 212:481–495. 10.1084/jem.20141656 [DOI] [PMC free article] [PubMed] [Google Scholar]
- Liu L, Belkadi A, Darnall L, Hu T, Drescher C, Cotleur AC, Padovani-Claudio D, He T, Choi K, Lane TE, Miller RH, Ransohoff RM (2010) CXCR2-positive neutrophils are essential for cuprizone-induced demyelination: relevance to multiple sclerosis. Nat Neurosci 13:319–326. 10.1038/nn.2491 [DOI] [PMC free article] [PubMed] [Google Scholar]
- Livak KJ, Schmittgen TD (2001) Analysis of relative gene expression data using real-time quantitative PCR and the 2(-delta delta C(T)) method. Methods 25:402–408. 10.1006/meth.2001.1262 [DOI] [PubMed] [Google Scholar]
- Mancias JD, Wang X, Gygi SP, Harper JW, Kimmelman AC (2014) Quantitative proteomics identifies NCOA4 as the cargo receptor mediating ferritinophagy. Nature 509:105–109. 10.1038/nature13148 [DOI] [PMC free article] [PubMed] [Google Scholar]
- Masaldan S, Bush AI, Devos D, Rolland AS, Moreau C (2019) Striking while the iron is hot: iron metabolism and ferroptosis in neurodegeneration. Free Radic Biol Med 133:221–233. 10.1016/j.freeradbiomed.2018.09.033 [DOI] [PubMed] [Google Scholar]
- Mason JL, Jones JJ, Taniike M, Morell P, Suzuki K, Matsushima GK (2000) Mature oligodendrocyte apoptosis precedes IGF-1 production and oligodendrocyte progenitor accumulation and differentiation during demyelination/remyelination. J Neurosci Res 61:251–262. [DOI] [PubMed] [Google Scholar]
- McMurran CE, Zhao C, Franklin RJ (2019) Toxin-based models to investigate demyelination and remyelination. Methods Mol Biol 1936 377–396. [DOI] [PubMed] [Google Scholar]
- Morell P, Barrett CV, Mason JL, Toews AD, Hostettler JD, Knapp GW, Matsushima GK (1998) Gene expression in brain during cuprizone-induced demyelination and remyelination. Mol Cell Neurosci 12:220–227. 10.1006/mcne.1998.0715 [DOI] [PubMed] [Google Scholar]
- Mukherjee C, Kling T, Russo B, Miebach K, Kess E, Schifferer M, Pedro LD, Weikert U, Fard MK, Kannaiyan N, Rossner M, Aicher ML, Goebbels S, Nave KA, Krämer-Albers EM, Schneider A, Simons M (2020) Oligodendrocytes provide antioxidant defense function for neurons by secreting ferritin heavy chain. Cell Metab 32:259–272.e210. 10.1016/j.cmet.2020.05.019 [DOI] [PMC free article] [PubMed] [Google Scholar]
- Mullin AP, Cui C, Wang Y, Wang J, Troy E, Caggiano AO, Parry TJ, Colburn RW, Pavlopoulos E (2017) rHIgM22 enhances remyelination in the brain of the cuprizone mouse model of demyelination. Neurobiol Dis 105:142–155. 10.1016/j.nbd.2017.05.015 [DOI] [PubMed] [Google Scholar]
- Nguyen DH, Zhou T, Shu J, Mao JH (2013) Quantifying chromogen intensity in immunohistochemistry via reciprocal intensity. Cancer InCytes 2:e. [Google Scholar]
- Nigam S, Rutan S (2001) Principles and applications of solvatochromism. Appl Spectrosc 55:362a–370a. 10.1366/0003702011953702 [DOI] [Google Scholar]
- Niko Y, Didier P, Mely Y, Konishi G, Klymchenko AS (2016) Bright and photostable push-pull pyrene dye visualizes lipid order variation between plasma and intracellular membranes. Sci Rep 6:18870. 10.1038/srep18870 [DOI] [PMC free article] [PubMed] [Google Scholar]
- Nobuta H, Yang N, Ng YH, Marro SG, Sabeur K, Chavali M, Stockley JH, Killilea DW, Walter PB, Zhao C, Huie P, Goldman SA, Kriegstein AR, Franklin RJ, Rowitch DH, Wernig M (2019) Oligodendrocyte death in Pelizaeus-Merzbacher disease is rescued by iron chelation. Cell Stem Cell 25:531–541.e536. 10.1016/j.stem.2019.09.003 [DOI] [PMC free article] [PubMed] [Google Scholar]
- Novgorodov SA, Voltin JR, Gooz MA, Li L, Lemasters JJ, Gudz TI (2018) Acid sphingomyelinase promotes mitochondrial dysfunction due to glutamate-induced regulated necrosis. J Lipid Res 59:312–329. 10.1194/jlr.M080374 [DOI] [PMC free article] [PubMed] [Google Scholar]
- Perrin FE, Lacroix S, Aviles-Trigueros M, David S (2005) Involvement of monocyte chemoattractant protein-1, macrophage inflammatory protein-1alpha and interleukin-1beta in Wallerian degeneration. Brain 128:854–866. 10.1093/brain/awh407 [DOI] [PubMed] [Google Scholar]
- Petkovic F, Campbell IL, Gonzalez B, Castellano B (2016) Astrocyte-targeted production of interleukin-6 reduces astroglial and microglial activation in the cuprizone demyelination model: implications for myelin clearance and oligodendrocyte maturation. Glia 64:2104–2119. 10.1002/glia.23043 [DOI] [PubMed] [Google Scholar]
- Ponka P, Lok CN (1999) The transferrin receptor: role in health and disease. Int J Biochem Cell Biol 31:1111–1137. 10.1016/S1357-2725(99)00070-9 [DOI] [PubMed] [Google Scholar]
- Rathore KI, Kerr BJ, Redensek A, Lopez-Vales R, Jeong SY, Ponka P, David S (2008) Ceruloplasmin protects injured spinal cord from iron-mediated oxidative damage. J Neurosci 28:12736–12747. 10.1523/JNEUROSCI.3649-08.2008 [DOI] [PMC free article] [PubMed] [Google Scholar]
- Rouault TA, Haile DJ, Downey WE, Philpott CC, Tang C, Samaniego F, Chin J, Paul I, Orloff D, Harford JB (1992) An iron-sulfur cluster plays a novel regulatory role in the iron-responsive element binding protein. Biometals 5:131–140. 10.1007/BF01061319 [DOI] [PubMed] [Google Scholar]
- Rouault TA, Tong WH (2005) Iron-sulphur cluster biogenesis and mitochondrial iron homeostasis. Nat Rev Mol Cell Biol 6:345–351. 10.1038/nrm1620 [DOI] [PubMed] [Google Scholar]
- Ryan F, Zarruk JG, Lößlein L, David S (2019) Ceruloplasmin plays a neuroprotective role in cerebral ischemia. Front Neurosci 12:988 10.3389/fnins.2018.00988 [DOI] [PMC free article] [PubMed] [Google Scholar]
- Schonberg DL, Goldstein EZ, Sahinkaya FR, Wei P, Popovich PG, McTigue DM (2012) Ferritin stimulates oligodendrocyte genesis in the adult spinal cord and can be transferred from macrophages to NG2 cells in vivo. J Neurosci 32:5374–5384. 10.1523/JNEUROSCI.3517-11.2012 [DOI] [PMC free article] [PubMed] [Google Scholar]
- Schulz K, Vulpe CD, Harris LZ, David S (2011) Iron efflux from oligodendrocytes is differentially regulated in gray and white matter. J Neurosci 31:13301–13311. 10.1523/JNEUROSCI.2838-11.2011 [DOI] [PMC free article] [PubMed] [Google Scholar]
- Schulz K, Kroner A, David S (2012) Iron efflux from astrocytes plays a role in remyelination. J Neurosci 32:4841–4847. 10.1523/JNEUROSCI.5328-11.2012 [DOI] [PMC free article] [PubMed] [Google Scholar]
- Skouta R, Dixon SJ, Wang J, Dunn DE, Orman M, Shimada K, Rosenberg PA, Lo DC, Weinberg JM, Linkermann A, Stockwell BR (2014) Ferrostatins inhibit oxidative lipid damage and cell death in diverse disease models. J Am Chem Soc 136:4551–4556. 10.1021/ja411006a [DOI] [PMC free article] [PubMed] [Google Scholar]
- Skripuletz T, Gudi V, Hackstette D, Stangel M (2011) De- and remyelination in the CNS white and grey matter induced by cuprizone: the old, the new, and the unexpected. Histol Histopathol 26:1585–1597. [DOI] [PubMed] [Google Scholar]
- Steelman AJ, Thompson JP, Li J (2012) Demyelination and remyelination in anatomically distinct regions of the corpus callosum following cuprizone intoxication. Neurosci Res 72:32–42. 10.1016/j.neures.2011.10.002 [DOI] [PMC free article] [PubMed] [Google Scholar]
- Stockwell BR, Friedmann Angeli JP, Bayir H, Bush AI, Conrad M, Dixon SJ, Fulda S, Gascón S, Hatzios SK, Kagan VE, Noel K, Jiang X, Linkermann A, Murphy ME, Overholtzer M, Oyagi A, Pagnussat GC, Park J, Ran Q, et al. (2017) Ferroptosis: a regulated cell death nexus linking metabolism, redox biology, and disease. Cell 171:273–285. 10.1016/j.cell.2017.09.021 [DOI] [PMC free article] [PubMed] [Google Scholar]
- Sun X, Ou Z, Xie M, Kang R, Fan Y, Niu X, Wang H, Cao L, Tang D (2015) HSPB1 as a novel regulator of ferroptotic cancer cell death. Oncogene 34:5617–5625. 10.1038/onc.2015.32 [DOI] [PMC free article] [PubMed] [Google Scholar]
- Taraboletti A, Walker T, Avila R, Huang H, Caporoso J, Manandhar E, Leeper TC, Modarelli DA, Medicetty S, Shriver LP (2017) Cuprizone intoxication induces cell intrinsic alterations in oligodendrocyte metabolism independent of copper chelation. Biochemistry 56:1518–1528. 10.1021/acs.biochem.6b01072 [DOI] [PMC free article] [PubMed] [Google Scholar]
- Todorich B, Pasquini JM, Garcia CI, Paez PM, Connor JR (2009) Oligodendrocytes and myelination: the role of iron. Glia 57:467–478. 10.1002/glia.20784 [DOI] [PubMed] [Google Scholar]
- Tuo QZ, Lei P, Jackman KA, Li XL, Xiong H, Li XL, Liuyang ZY, Roisman L, Zhang ST, Ayton S, Wang Q, Crouch PJ, Ganio K, Wang XC, Pei L, Adlard PA, Lu YM, Cappai R, Wang JZ, Liu R, et al. (2017) Tau-mediated iron export prevents ferroptotic damage after ischemic stroke. Mol Psychiatry 22:1520–1530. 10.1038/mp.2017.171 [DOI] [PubMed] [Google Scholar]
- Varga E, Pandur E, Abraham H, Horvath A, Acs P, Komoly S, Miseta A, Sipos K (2018) Cuprizone administration alters the iron metabolism in the mouse model of multiple sclerosis. Cell Mol Neurobiol 38:1081–1097. 10.1007/s10571-018-0578-5 [DOI] [PMC free article] [PubMed] [Google Scholar]
- Vargas ME, Barres BA (2007) Why is Wallerian degeneration in the CNS so slow? Annu Rev Neurosci 30:153–179. 10.1146/annurev.neuro.30.051606.094354 [DOI] [PubMed] [Google Scholar]
- Vulpe CD, Kuo YM, Murphy TL, Cowley L, Askwith C, Libina N, Gitschier J, Anderson GJ (1999) Hephaestin, a ceruloplasmin homologue implicated in intestinal iron transport, is defective in the sla mouse. Nat Genet 21:195–199. 10.1038/5979 [DOI] [PubMed] [Google Scholar]
- Xie Y, Hou W, Song X, Yu Y, Huang J, Sun X, Kang R, Tang D (2016) Ferroptosis: process and function. Cell Death Differ 23:369–379. 10.1038/cdd.2015.158 [DOI] [PMC free article] [PubMed] [Google Scholar]
- Yang WS, Stockwell BR (2008) Synthetic lethal screening identifies compounds activating iron-dependent, nonapoptotic cell death in oncogenic-RAS-harboring cancer cells. Chem Biol 15:234–245. 10.1016/j.chembiol.2008.02.010 [DOI] [PMC free article] [PubMed] [Google Scholar]
- Yang WS, Stockwell BR (2016) Ferroptosis: death by lipid peroxidation. Trends Cell Biol 26:165–176. 10.1016/j.tcb.2015.10.014 [DOI] [PMC free article] [PubMed] [Google Scholar]
- Zaitsev VN, Zaitseva I, Papiz M, Lindley PF (1999) An X-ray crystallographic study of the binding sites of the azide inhibitor and organic substrates to ceruloplasmin, a multi-copper oxidase in the plasma. J Biol Inorg Chem 4:579–587. 10.1007/s007750050380 [DOI] [PubMed] [Google Scholar]
- Zarruk JG, Berard JL, Passos dos Santos R, Kroner A, Lee J, Arosio P, David S (2015) Expression of iron homeostasis proteins in the spinal cord in experimental autoimmune encephalomyelitis and their implications for iron accumulation. Neurobiol Dis 81:93–107. 10.1016/j.nbd.2015.02.001 [DOI] [PubMed] [Google Scholar]
- Zhang H, Kim Y, Ro EJ, Ho C, Lee D, Trapp BD, Suh H (2020) Hippocampal neurogenesis and neural circuit formation in a cuprizone-induced multiple sclerosis mouse model. J Neurosci 40:447–458. 10.1523/JNEUROSCI.0866-19.2019 [DOI] [PMC free article] [PubMed] [Google Scholar]
- Zilka O, Shah R, Li B, Friedmann Angeli JP, Griesser M, Conrad M, Pratt DA (2017) On the mechanism of cytoprotection by ferrostatin-1 and liproxstatin-1 and the role of lipid peroxidation in ferroptotic cell death. ACS Cent Sci 3:232–243. 10.1021/acscentsci.7b00028 [DOI] [PMC free article] [PubMed] [Google Scholar]