

Abstract
Understanding the similarity of cortico-subcortical networks topologies between humans and nonhuman primate species is critical to study the origin of network alternations underlying human neurologic and neuropsychiatric diseases. The New World common marmoset (Callithrix jacchus) has become popular as a nonhuman primate model for human brain function. Most marmoset connectomic research, however, has exclusively focused on cortical areas, with connectivity to subcortical networks less extensively explored. Here, we aimed to first isolate patterns of subcortical connectivity with cortical resting-state networks in awake marmosets using resting-state fMRI, then to compare these networks with those in humans using connectivity fingerprinting. In this study, we used 5 marmosets (4 males, 1 female). While we could match several marmoset and human resting-state networks based on their functional fingerprints, we also found a few striking differences, for example, strong functional connectivity of the default mode network with the superior colliculus in marmosets that was much weaker in humans. Together, these findings demonstrate that many of the core cortico-subcortical networks in humans are also present in marmosets, but that small, potentially functionally relevant differences exist.
SIGNIFICANCE STATEMENT The common marmoset is becoming increasingly popular as an additional preclinical nonhuman primate model for human brain function. Here we compared the functional organization of cortico-subcortical networks in marmosets and humans using ultra-high field fMRI. We isolated the patterns of subcortical connectivity with cortical resting-state networks (RSNs) in awake marmosets using resting-state fMRI and then compared these networks with those in humans using connectivity fingerprinting. While we could match several marmoset and human RSNs based on their functional fingerprints, we also found several striking differences. Together, these findings demonstrate that many of the core cortico-subcortical RSNs in humans are also present in marmosets, but that small, potentially functionally relevant differences exist.
Keywords: cortex, marmoset, resting-state fMRI, subcortex
Introduction
The New World common marmoset (Callithrix jacchus) has become popular as a model for human brain function (Okano et al., 2016). Owing to a developed frontal cortex (Okano and Mitra, 2015) and the feasibility of creating transgenic marmosets (Sasaki et al., 2009; Park et al., 2016; Tomioka et al., 2017a,b), the marmoset has become a promising candidate for assessing neuropsychiatric disorders, especially those involving frontal impairments that are more difficult to study in rodent models (Okano and Mitra, 2015). In the past few years, marmoset brain connectomics, including corticocortical anatomic connections (Majka et al., 2016, 2020), functional networks/connections (Hori et al., 2020a,b), and white matter pathways (Schaeffer et al., 2017; Liu et al., 2020), are becoming increasingly well studied. In addition, similarities of these connections have been found between marmosets and humans (Solomon and Rosa, 2014; Schaeffer et al., 2019a,b; Liu et al., 2020).
Demonstrating homologies across species is a challenging endeavor because of both limitations in measuring networks using the same method across species and in identifying analogous brain areas to compare across vastly different brain morphologies. Resting-state fMRI (RS-fMRI) allows for circumvention of some of these challenges by allowing for noninvasive identification of robust and reproducible resting-state networks (RSNs) across different species (Damoiseaux et al., 2006; Fox and Raichle, 2007). With recent advances in MRI hardware, we are now able to measure the functional networks/connectivities in awake marmosets (Belcher et al., 2013; Schaeffer et al., 2019c; Cléry et al., 2020; Hori et al., 2020b). Particularly, the marmoset's small size is ideal for ultra-high field small-bore fMRI, affording high spatial resolution and signal-to-noise ratio (SNR), even in subcortical areas. Despite the ability to acquire MRI-based connectivity data in both marmosets and humans, the problem still stands of how to compare topologies amid major morphologic differences. Connectivity fingerprinting has been offered as a method to circumvent this problem; this approach was originally proposed by Passingham et al. (2002) as a way to quantitatively evaluate the connections of a single cortical area with a selected set of other areas. More recently, Mars and colleagues have suggested the feasibility of this approach as a tool for comparing various aspects of brain organization across and within species (Mars et al., 2016, 2018; Balsters et al., 2020; Schaeffer et al., 2020). Here, we used this technique to compare cortico-subcortical fingerprints of RSNs in marmosets and humans, allowing for identification of interspecies similarities of cortico-subcortical connectivities.
We applied recent advances in hardware development for awake marmoset imaging, including a custom-made multiarray coil, a gradient coil (Handler et al., 2020), and an integrated head-fixation system (Schaeffer et al., 2019c) designed for small-bore ultra-high field MRI (9.4 T). This system allows for nearly motionless, high spatial resolution, and SNR images. For human analyses, we used openly available datasets from the Human Connectome Project (HCP) (Van Essen et al., 2013). We used a data-driven approach via independent component analysis to identify RSNs in both marmosets and humans, then specified the subcortical connections with each cortical RSN. The cortico-subcortical functional fingerprints were created based on subcortical volumes of interest (VOIs), and were used to identify putative homologous RSNs between marmosets and humans.
Materials and Methods
Animal preparation
All surgical and experimental procedures were in accordance with the Canadian Council of Animal Care policy and a protocol approved by the Animal Care Committee of the University of Western Ontario Council on Animal Care. All animal experiments complied with the Animal Research: Reporting In Vivo Experiments guidelines. Four male common marmosets weighting 390 g (3 years old), 245 g (1.5 years old), 330 g (1.5 years old), and 360 g (1.5 years old), and one female marmoset weighting 306 g (1.3 years old) were used in in vivo and ex vivo study, respectively.
Four marmosets for in vivo experiments underwent surgery to implant a head chamber to fix the head during MRI acquisition as described in previous reports (Johnston et al., 2018; Schaeffer et al., 2019c). Briefly, the marmoset was placed in a stereotactic frame (Narishige, model SR-6C-HT), and several coats of adhesive resin (All-bond Universal Bisco) were applied using a microbrush, air-dried, and cured with an ultraviolet dental curing light. Then, a dental cement (C & B Cement, Bisco) was applied to the skull and to the bottom of the chamber, which was then lowered onto the skull via a stereotactic manipulator to ensure correct location and orientation. The chamber was 3D printed at 0.25 mm resolution using stereolithography and a clear photopolymer resin (Clear-Resin V4; Form 2, Formlabs). The marmosets were first acclimatized to the animal holder, head fixation system, and a mock MRI environment before the first imaging session (Silva et al., 2011). Each marmoset was trained over the course of 3 weeks. During the first week, marmosets entered the tube and were constrained using only the neck and tail plates for increasingly long periods of time (up to 30 min). During the second week, the restraint tube was inserted into a mock MRI tube (a 12 cm inner diameter tube) to simulate the scanner environment; MRI sounds were played at increasingly loud volumes (up to 80 dB) for increasingly long durations, up to 60 min sessions. In week 3, marmosets were head-fixed via the fixation pins, inserted into the mock MRI tube, and exposed to the MRI sounds. Within each session, the animals are presented with reward items (pudding or marshmallow fluff) for remaining still (calmly facing forward, with minimal movement of limbs). Throughout the training sessions, the behavioral rating scale described by Silva et al. (2011) was used to assess the animals' tolerance to the acclimatization procedure by the end of week 3; all 3 marmosets scored 1 or 2 on this assessment scale (Silva et al., 2011), showing calm and quiet behavior, with little signs of agitation.
To create VOIs in subcortical area, we acquired ex vivo MRI as it allowed for longer scanning time at a much higher resolution (0.1 mm isotropic). To prepare for ex vivo MRI, 1 marmoset was killed through transcardial perfusion, and its brain was extracted at the end of the procedure. Anesthesia was initially induced with 30 mg/kg of ketamine and maintained with 4% isoflurane in 1.5%-2% oxygen. The animal was then transcardially perfused with 0.9% sodium chloride solution, followed by 10% formaldehyde buffered solution (formalin). The brain was then extracted and stored in 10% buffered formalin for over a week.
Image acquisition
For the in vivo experiment, each animal was fixed to the animal holder using a neck plate and a tail plate. The animal was then head-fixed using fixation pins in the MRI room to minimize the time in which the awake animal was head fixed (Schaeffer et al., 2019c). Once fixed, a lubricating gel (MUKO SM321N, Canadian Custom Packaging) was squeezed into the chamber and applied to the brow ridge to reduce magnetic susceptibility.
Data were acquired using a 9.4 T 31 cm horizontal bore magnet (Varian/Agilent) and Bruker BioSpec Avance III HD console with the software package Paravision-6 (Bruker BioSpin), a custom-built high-performance 15-cm-diameter gradient coil with 400-mT/m maximum gradient strength (Handler et al., 2020), and the 5-channel receive coil (Schaeffer et al., 2019c). Radio frequency transmission was accomplished with a quadrature birdcage coil (12 cm inner diameter) built in-house. All imaging was performed at the Center for Functional and Metabolic Mapping at the University of Western Ontario.
Functional images were acquired with 6-22 functional runs (at 400 or 600 volumes each) for each animal in the awake condition, using gradient-echo based single-shot echo-planar imaging sequence with the following parameters: TR = 1500 ms, TE = 15 ms, flip angle = 40°, FOV = 64 × 64 mm, matrix size 128 × 128, voxel size 0.5 mm isotropic, slices = 42, bandwidth = 500 kHz, generalized autocalibrating parallel acquisition acceleration factor (anterior-posterior) = 2. Total scan time for all functional imaging was ∼14 h. A T2-wighted image (T2w) was also acquired for each animal using rapid imaging with refocused echoes sequences with the following parameters: TR = 5500 ms, TE = 53 ms, FOV = 51.2 × 51.2 mm, matrix size = 384 × 384, voxel size = 0.133 × 0.133 × 0.5 mm, slice 42, bandwidth = 50 kHz, generalized autocalibrating parallel acquisition acceleration factor (anterior-posterior) = 2.
For ex vivo imaging, a formalin-fixed marmoset brain was submerged in lubricant (Christo-lube; Lubrication Technology) to avoid magnetic susceptibility-related distortion artifacts, and three-dimensional multi-echo spin-echo images were acquired as following parameters: TR = 200 ms, TE = 3.5, 8.5, 13.5, 18.5, 23.5 ms, FOV = 33 × 28.8 × 36 mm, matrix size = 330 × 288 × 360, voxel size = 0.1 mm isotropic resolution, average = 4. The average image across different TE images was calculated to increase the SNR, and it was used to create the subcortical VOIs.
Marmoset image preprocessing
Data were preprocessed using FSL software (Smith et al., 2004). Raw MRI images were first converted to Neuro Informatics Technology Initiative format (Li et al., 2016) and reoriented from sphinx position. Brain masks for in vivo images were created using FSL tools and the National Institutes of Health (NIH) T2w brain template (Liu et al., 2018) For each animal, the brain-skull boundary was first roughly identified from individual T2w using the brain extraction tool with the following options: radius of 25-40 and fractional intensity threshold of 0.3 (Smith, 2002). Then, the NIH T2w brain template was linearly and nonlinearly registered to the individual brain image using FMRIB's linear registration tool (FLIRT) and FMRIB's nonlinear registration tool (FNIRT) to more accurately create the brain mask. After that, the brain was extracted using the brain mask. RS-fMRI images were corrected for motion using FLIRT. Principal component analysis was applied to remove the unstructured noise from the RS-MRI time course, followed by independent component analysis (ICA) with the decomposition number of 200 using Multivariate Exploratory Linear Optimized Decomposition into the Independent Components module of the FSL software package. Obtained components were classified as signal or noise (e.g., eye movement, CSF pulsation, heart rate, and respiratory artifacts) based on the criteria as shown a previous report (Griffanti et al., 2017), and noise components were regressed out from the rfMRI time course using FSL tool (fsl_regfilt). All rfMRI images were finally normalized to the NIH template (Liu et al., 2018) using rfMRI-to-T2w and T2w-to-template transformation matrices obtained by FLIRT and FNIRT, followed by spatial smoothing by Gaussian kernel with the FWHM value of 1.0 mm. The ex vivo structure image was also normalized to the NIH template using FLIRT and FNIRT.
Cortico-subcortical functional networks in marmosets
To identify the subcortical areas related to each cortical RSN, we first calculated the cortical networks in each species (with a mask that limited the analysis to only the cortex); then we identified the subcortical areas that were functionally related to each cortical network (based on fingerprint matching) (Fig. 1). The group ICA was first implemented for only cortical area 10 times with different dimension numbers (from 16 to 25) to identify optimal dimensionality using the Multivariate Exploratory Linear Optimized Decomposition into the Independent Components module of the FSL software package. Explicitly, mean images across time were removed from each run, and variance was normalized at voxel level. Each run was then concatenated, and principal component analysis was applied to remove the unstructured noise from the RS-fMRI time course, followed by ICA. The 20 components solution was selected to be an appropriate representative of meaningful components with reference to previous reports of marmoset functional networks (Belcher et al., 2013; Ghahremani et al., 2017; Hori et al., 2020b). Second, a spatial regression approach was used to obtain the temporal dynamics for each cortical component within each scan's fMRI datasets (Filippini et al., 2009). In this process, the full set of group-ICA spatial templates were used in a linear model fit against the separate fMRI datasets. Finally, we calculated correlation coefficients between the time courses in each cortical network and the time courses in each subcortical voxel using FSL's FEAT. The functional connectivity maps (z score maps) in the subcortical areas were then averaged across scans. To assign each subcortical voxel to one of the networks, one network having the highest z value was assigned in each voxel.
Figure 1.

Flowchart of analysis to calculate the subcortical connectivity maps. Each RS-fMRI scan was preprocessed, and (1) cortical and (2) subcortical regions were extracted using masks. (3) Using all cortical RS-fMRI datasets, group ICA (gICA) was performed so that 14 and 10 cortical RSNs were identified for marmosets and humans, respectively. (4) The time courses of each network in each scan were calculated using spatial regression technique and obtained cortical RSNs. (5) Then correlation coefficients between the time courses in each cortical network and the time courses in each subcortical voxel were calculated. Obtained correlation coefficient maps in each network were averaged across scans.
Cortico-subcortical functional networks in humans
HCP datasets were used for human analysis (Van Essen et al., 2013). RS-fMRI data for 100 subjects (four scans for each subject, i.e., total 400 scans) preprocessed with the HCP functional pipeline, including motion correction, distortion correction, normalization to MNI template space, and FMRIB's ICA-based X-noiseifier denoising (Salimi-Khorshidi et al., 2014) were downloaded from the HCP website (https://www.humanconnectome.org/). Group ICA was performed for only cortical areas with 20 dimensions. After that, temporal dynamics for each cortical component within each scan's data were obtained by a spatial regression approach using group ICA templates, and correlation coefficients between the time courses in each cortical network and the time courses in each subcortical voxel were calculated in the same way as in the marmoset analysis. Finally, the functional connectivity maps (z score maps) in the subcortical areas were then averaged across scans.
Subcortical VOI
To identify the subcortical areas associated with each marmoset network, we applied the subcortical atlas supplied by the NIH Marmoset Brain template (Liu et al., 2018), where the thalamus is not parcellated into thalamic nuclei. Based on the ex vivo image normalized to the NIH template, we created the thalamic VOIs, anterior (AN), laterodorsal (LD), mediodorsal (MD), ventral anterior (VA), ventral lateral (VL), ventral posterior (VP), and pulvinar, with reference to the Paxinos atlas (Paxinos et al., 2012) (Fig. 2A). For human subcortical VOIs, standard mesh atlas for subcortical area supplied by HCP pipeline was used (Atlas_ROIs_2.nii.gz), which does not have VOIs of thalamic nuclei, lateral geniculate nucleus (LGN), superior colliculus (SC), and inferior colliculus (IC). For thalamic nuclei, the histologic-based atlas supplied by NeuroImaging and Surgical Technologies Lab was used (Xiao et al., 2012, 2015). Also, a radiologist made the VOIs for LGN, SC, and IC based on the MNI T1w template (Fig. 2B). For the LGN, we first detected the optic tracts in the coronal images of the MNI T1w template. Tracking the optic track (“white” in T1w); then we identified the gray area above the hippocampus. For the SC and IC, we first found the periaqueductal gray in the posterior part of the midbrain in the sagittal images. The periaqueductal gray is gray matter and clearer than the colliculus in T1w, so we made the VOIs of the SC and IC, not including the periaqueductal gray.
Figure 2.

Subcortical VOIs for marmosets (A) and humans (B). Subcortical volume of interests (VOIs) for marmosets (A) and humans (B). Only right-side VOIs are presented. SC: superior colliculus; IC: inferior colliculus; LGN: lateral geniculate nucleus; ANT: anterior part 735 of thalamic nucleus; LD: laterodorsal thalamic nucleus; MD: mediodorsal thalamic nucleus; VA: ventral anterior thalamic nucleus; VL: ventral lateral thalamic nucleus; VP: ventral posterior 737 thalamic nucleus; PUL: pulvinar nucleus.
Comparison of subcortical connectivity profiles
To quantitatively determine how well each subcortical connectivity profile in marmosets matched the connectivity profile of humans, we used a connectivity fingerprint technique (Mars et al., 2016, 2018). To quantify the fingerprint, we calculated the mean z values in seven target regions placed in caudate, putamen, hippocampus, amygdala, SC, IC, and LGN. We did not include the other thalamic VOIs in the fingerprint analysis as these regions are prone to residual global artifacts (Ji et al., 2019). We normalized these VOI values to a range between 0 (weakest connection with any of the target areas) and 1 (strongest connection with any of the target areas) to compare a pattern of connections with target areas, rather than absolute strength. Then, we calculated the Manhattan distance between connectivity fingerprints. A Manhattan distance close to zero indicates that two fingerprints match well. RSN labels in marmosets might not always be correct because there are few studies verifying that these labels directly represent the function. For this reason, we calculated Manhattan distance for all combinations between 14 marmoset RSNs and 10 human RSNs to elucidate which marmoset network corresponds to which human network based on the subcortical profiles.
Statistical analysis
The cortical RSNs (z score map) in both species were thresholded at 2.3, which is corresponding to p < 0.05 corrected for multiple comparisons with Gaussian random field theory. Permutation testing was used to test the significance of the match between each of the marmoset and human subcortical profiles by calculating 10,000 different permutations of the fingerprint target networks in marmosets. p < 0.05 is considered as significantly smaller Manhattan distance than expected by chance. This analysis was performed using custom tools written in MATLAB (The MathWorks).
Results
Cortico-subcortical RSNs in marmosets
To identify the subcortical areas related to each cortical RSN, we first calculated the cortical networks in each species (with a mask that limited the analysis to only the cortex); then we identified the subcortical areas that were functionally related to each cortical network (based on fingerprint matching) (Fig. 1). After implementation of group ICA (Beckmann and Smith, 2004) using awake RS-fMRI data in only cortical regions, 6 components were identified as unstructured and/or physiological noise. The remaining 14 components demonstrated meaningful RSNs (Fig. 3). Obtained RSNs were consistent with previously observed networks in marmosets (Belcher et al., 2013; Ghahremani et al., 2017; Hori et al., 2020b), such as default mode network (DMN) (Fig. 3A), attention network (ATN) (Fig. 3B), salience network (SAN) (Fig. 3C), left and right primary visual networks (Fig. 3D,E), orbitofrontal network (ORN) (Fig. 3F), high-order visual networks (hVIS1-4: Fig. 3G–J), somatomotor networks ventral part (Fig. 3K), dorsal part (Fig. 3L), medial part (Fig. 3M), and premotor network (Fig. 3N).
Figure 3.

Fourteen components identified as RSNs in the marmosets. These networks were labeled based on previous studies (Belcher et al., 2013; Hori et al., 2020b) as follows: A, DMN. B, ATN. C, SAN. D, Left primary visual network (pVIS-Lt). E, Right primary VIS (pVIS-Rt). F, ORN. G–J, hVIS1-4. K-M, Somatomotor networks ventral (SMNv), dorsal (SMNd), and medial (SMNm). N, Premotor network (PMN). Color bar represents the z score of these correlation patterns thresholding at 2.3. White lines indicate the cytoarchitectonic borders for reference (Liu et al., 2018).
To identify the subcortical area related to each cortical RSN calculated by group ICA, we calculated correlation coefficients between the time courses in each cortical RSN and the time courses in each subcortical voxel. The functional connectivity maps (z score maps) in the subcortical areas were then averaged across scans. Averaged z score values in each subcortical area corresponding to each RSN are shown in Figure 4, and representative activation maps (z score maps) are presented in Figure 5. These z score maps were normalized to be maximum z value equal to 1 and were thresholded at 0.2 for visual purposes. The main subcortical area in the DMN (corresponding to Fig. 3A) was the hippocampus (Fig. 5A), which is already known as a part of DMN in humans (Greicius et al., 2004), macaques (Vincent et al., 2007; Mantini et al., 2011), and rats (Lu et al., 2012). The ATN (corresponding to Fig. 3B) was strongly functionally connected with caudate and putamen (Fig. 5B). The primary subcortical area connected to the SAN (corresponding to Fig. 3C) was the IC (Fig. 5C). The primary VISs (corresponding to Fig. 3D,E) exhibited strong functional connectivities with the LGN, SC, VL, VP, and pulvinar thalamic nuclei (Fig. 5D). These activations were found in both left and right visual networks. The main subcortical areas in the ORN (corresponding to Fig. 3F) were the ventral striatum, caudate, putamen, and anterior, LD, MD, VA, and VL thalamic nuclei (Fig. 5E). The main subcortical areas in the higher-order VIS were the SC and LGN for hVIS3 and hVIS4 (Fig. 5F), while there was functional connectivity with the caudate and putamen in these subcortical regions for hVIS1 and hVIS2. In the somatomotor networks, the main subcortical components were the hippocampus and VP thalamic nucleus for the lateral and medial networks (Fig. 5G). In the premotor network, the main subcortical component was VL thalamic nucleus (Fig. 5H). To assign subcortical voxels to networks, the correlation coefficients between the time courses in each cortical network and the time courses in each subcortical voxel were calculated and Fisher's z-transformed. Then, the network with the highest z value among all networks was selected and assigned as the main network related to the voxel (Fig. 6).
Figure 4.

Mean z score values in each subcortical area in each marmoset RSN. Error bars indicate SEM. The RSNs described here are corresponding to those in Figure 1. CAU, Caudate; PUT, putamen; HIPPO, hippocampus; AMY, amygdala.
Figure 5.

Representative subcortical z score maps for each RSN in marmosets. The z score maps were normalized to be maximum z value equal to 1, and were shown in sagittal, coronal, and axial slices deemed most representative of the activation patterns. A, DMN (corresponding to Fig. 3A). B, ATN (corresponding to Fig. 3B). C, SAN (corresponding to Fig. 3C). D, Primary visual network (pVIS: corresponding to Fig. 3E). E, ORN (corresponding to Fig. 3F). F, High-order VIS (corresponding to Fig. 3I). G, Somatomotor network (SMN) medial sensory part (corresponding to Fig. 3M). H, Premotor network (PMN) (corresponding to Fig. 3N).
Figure 6.

A parcellation of the marmoset subcortical area. The network with the highest z value among all networks was assigned as the main network related to the voxel. Colors on the surfaces and volumes are corresponding to the name of networks in Figure 3.
Cortico-subcortical networks in humans
To identify the subcortical areas related to each cortical RSN in the humans, we first identified cortical functional networks in the same way as in the marmosets. Ten components were identified as unstructured and/or physiological noise. The remaining 10 components were identified as meaningful functional neural networks. These RSNs were named based on the main activation areas with reference to the recent paper, where each cortical partition is assigned to one of the networks (Ji et al., 2019). As such, we identified the DMN (Fig. 7A), frontoparietal network (FPN) (Fig. 7B), ATN (Fig. 7C), two SMNs (ventral: Fig. 7D, dorsomedial: Fig. 7E), auditory network (AUD) (Fig. 7F), two VISs (primary: Fig. 7G, high-order: Fig. 7H), language network (LAN) (Fig. 7I) and cingulo-opercular network (CON) (Fig. 7J). Subcortical areas corresponding to each RSN are shown in Figure 8. The main subcortical area in the DMN (corresponding to Fig. 7A) was the hippocampus (Fig. 9A). The FPN (corresponding to Fig. 7B) was connected with the caudate and putamen (Fig. 9B). The primary subcortical areas connected to the ATN (corresponding to Fig. 7C) were the amygdala, SC, and VP and pulvinar thalamic nuclei (Fig. 9C). In the SMNs (corresponding to Fig. 7D,E), the main subcortical components were the hippocampus and VP thalamic nucleus for both ventral and lateral networks (Fig. 9D). The AUD (corresponding to Fig. 7F) were functionally connected to all thalamic nuclei (Fig. 9E). The primary VIS (corresponding to Fig. 7G) exhibited strong functional connectivity with the LGN, SC, and VP and pulvinar thalamic nuclei (Fig. 9F), and these activations were also found in the high-order VIS. The main subcortical areas in the LAN (corresponding to Fig. 7I) were the caudate nucleus and amygdala (Fig. 9G). The main subcortical areas in the CON (corresponding to Fig. 7J) were the putamen and, anterior, MD, and LD thalamic nuclei (Fig. 9H). These subcortical connections in each network were consistent with a previous study (Ji et al., 2019), where they showed caudate, putamen, hippocampus, and amygdala were correlated with FPN, CON, DMN/SMN, and LAN, respectively. The SC and LGN were correlated with primary VIS, which was also consistent with our results. Generally, the subcortical connections, except for thalamic nuclei in each human network, were similar to the corresponding marmoset networks. For both species, for example, the DMN included hippocampus, and the VIS included LGN and SC. However, thalamic connections in the VIS did not match between marmosets and humans. The VIS in marmosets was strongly connected to the VL thalamic nucleus, whereas the VIS in humans was mainly connected to the VP and pulvinar thalamic nuclei.
Figure 7.

Ten components identified as RSNs in humans. These networks were labeled based on a previous study (Ji et al., 2019) as follows: A, DMN. B, FPN. C, ATN. D, Somatomotor network ventral part (SMN1). E, SMN dorsomedial part (SMN2). F, AUD. G, Primary visual network (pVIS). H, High-order VIS (hVIS). I, LAN. J, CON. Color bar represents the z score of these correlation patterns thresholding at 3.1. White lines indicate the parcellation borders created based on the multimodal magnetic resonance images from Human Connectome Project (Glasser et al., 2016).
Figure 8.

Mean z score values in each subcortical area in each human RSN. Error bars indicate SEM. RSNs (corresponding to those in Fig. 7). CAU, Caudate; PUT, putamen; HIPPO, hippocampus; AMY, amygdala.
Figure 9.

Representative subcortical z score maps for each RSN. The z score maps were normalized to be maximum z value equal to 1, and were shown in sagittal, coronal, and axial slices deemed most representative of the activation patterns. A, DMN (corresponding to Fig. 4A). B, FPN (corresponding to Fig. 4B). C, ATN (corresponding to Fig. 4C). D, Somatomotor network dorsal part (SMNd: corresponding to Fig. 4E). E, AUD (corresponding to Fig. 4F). F, Primary visual network (corresponding to Fig. 4G). G, LGN (corresponding to Fig. 4I). H, CON (corresponding to Fig. 4J).
Comparison of subcortical connectivity profiles
To quantitatively determine how well each subcortical connectivity profile in marmoset RSNs matched the connectivity profile of corresponding human RSNs, we used the connectivity fingerprint technique. Connectivity fingerprints were created for marmosets and humans by determining the mean z values in seven target regions placed in caudate, putamen, hippocampus, amygdala, SC, IC, and LGN. We did not include the other thalamic VOIs in the fingerprint analysis as these regions are prone to residual global artifacts (Ji et al., 2019). Then, we calculated the Manhattan distance between connectivity fingerprints. A Manhattan distance close to zero indicates that two fingerprints match well. Permutation tests were performed to evaluate statistically significant matches between human and marmoset fingerprints. For each of the 10 human RSNs, we tested the hypothesis that the difference between the fingerprints in humans and the target fingerprint in marmosets was smaller than expected by chance. As such, we calculated the Manhattan distance with 10,000 different permutations of the target VOIs in marmosets, following normalization of each fingerprint to a range of 0 (weakest functional connection with any of the target regions) and 1 (strongest functional connection with any of the target regions). A value <5 percentile of the histogram of Manhattan distance was considered to be significantly similar fingerprints across species.
The results revealed a number of significant matches between human and marmoset subcortical profiles based on their fingerprints (Fig. 10). The human DMN significantly matched with the marmoset DMN with the strong hippocampus connections (p < 0.05), while the marmoset DMN also exhibited strong FC with the SC (Fig. 11). The FPN in humans had similar subcortical patterns to the ATN, ORN, and VIS1 in marmosets with caudate and putamen connections (p < 0.05; Fig. 12), but the fingerprint of the human ATN did not match with the fingerprint of the marmoset FPN that we previously labeled ATN in marmosets (Hori et al., 2020b). Instead, in addition to a match with the human FPN, the fingerprint of the marmoset ATN network also matched with the fingerprint of the human LAN (p < 0.05; Fig. 13). The primary VIS in humans matched the marmoset primary VIS, high-order VIS3, and VIS4 with strong connections to the SC and LGN (p < 0.05; Fig. 14). The secondary VIS in humans also matched the marmoset high-order VIS (p < 0.05; Fig. 15). The CON in humans matched the marmoset ORN and VIS1 (p < 0.05; Fig. 16).
Figure 10.

The similarity of subcortical network patterns between marmosets and humans. Manhattan distance between these species were plotted in matrix form. Significant similarities were marked by an asterisk within the matrix.
Figure 11.

Matching human DMN to marmoset DMN in subcortical areas. A, z score maps were shown in sagittal slices focused on the hippocampus, which has the strongest connections in both species. A single-color palette applies to two species but is scaled according to percentile ranges within each species rather than to absolute values. B, A fingerprint shows the matching connectivity patterns between marmosets and humans. Red and green areas represent marmoset and human fingerprints, respectively. CAU, Caudate; PUT, putamen; HIPPO, hippocampus; AMY, amygdala.
Figure 12.
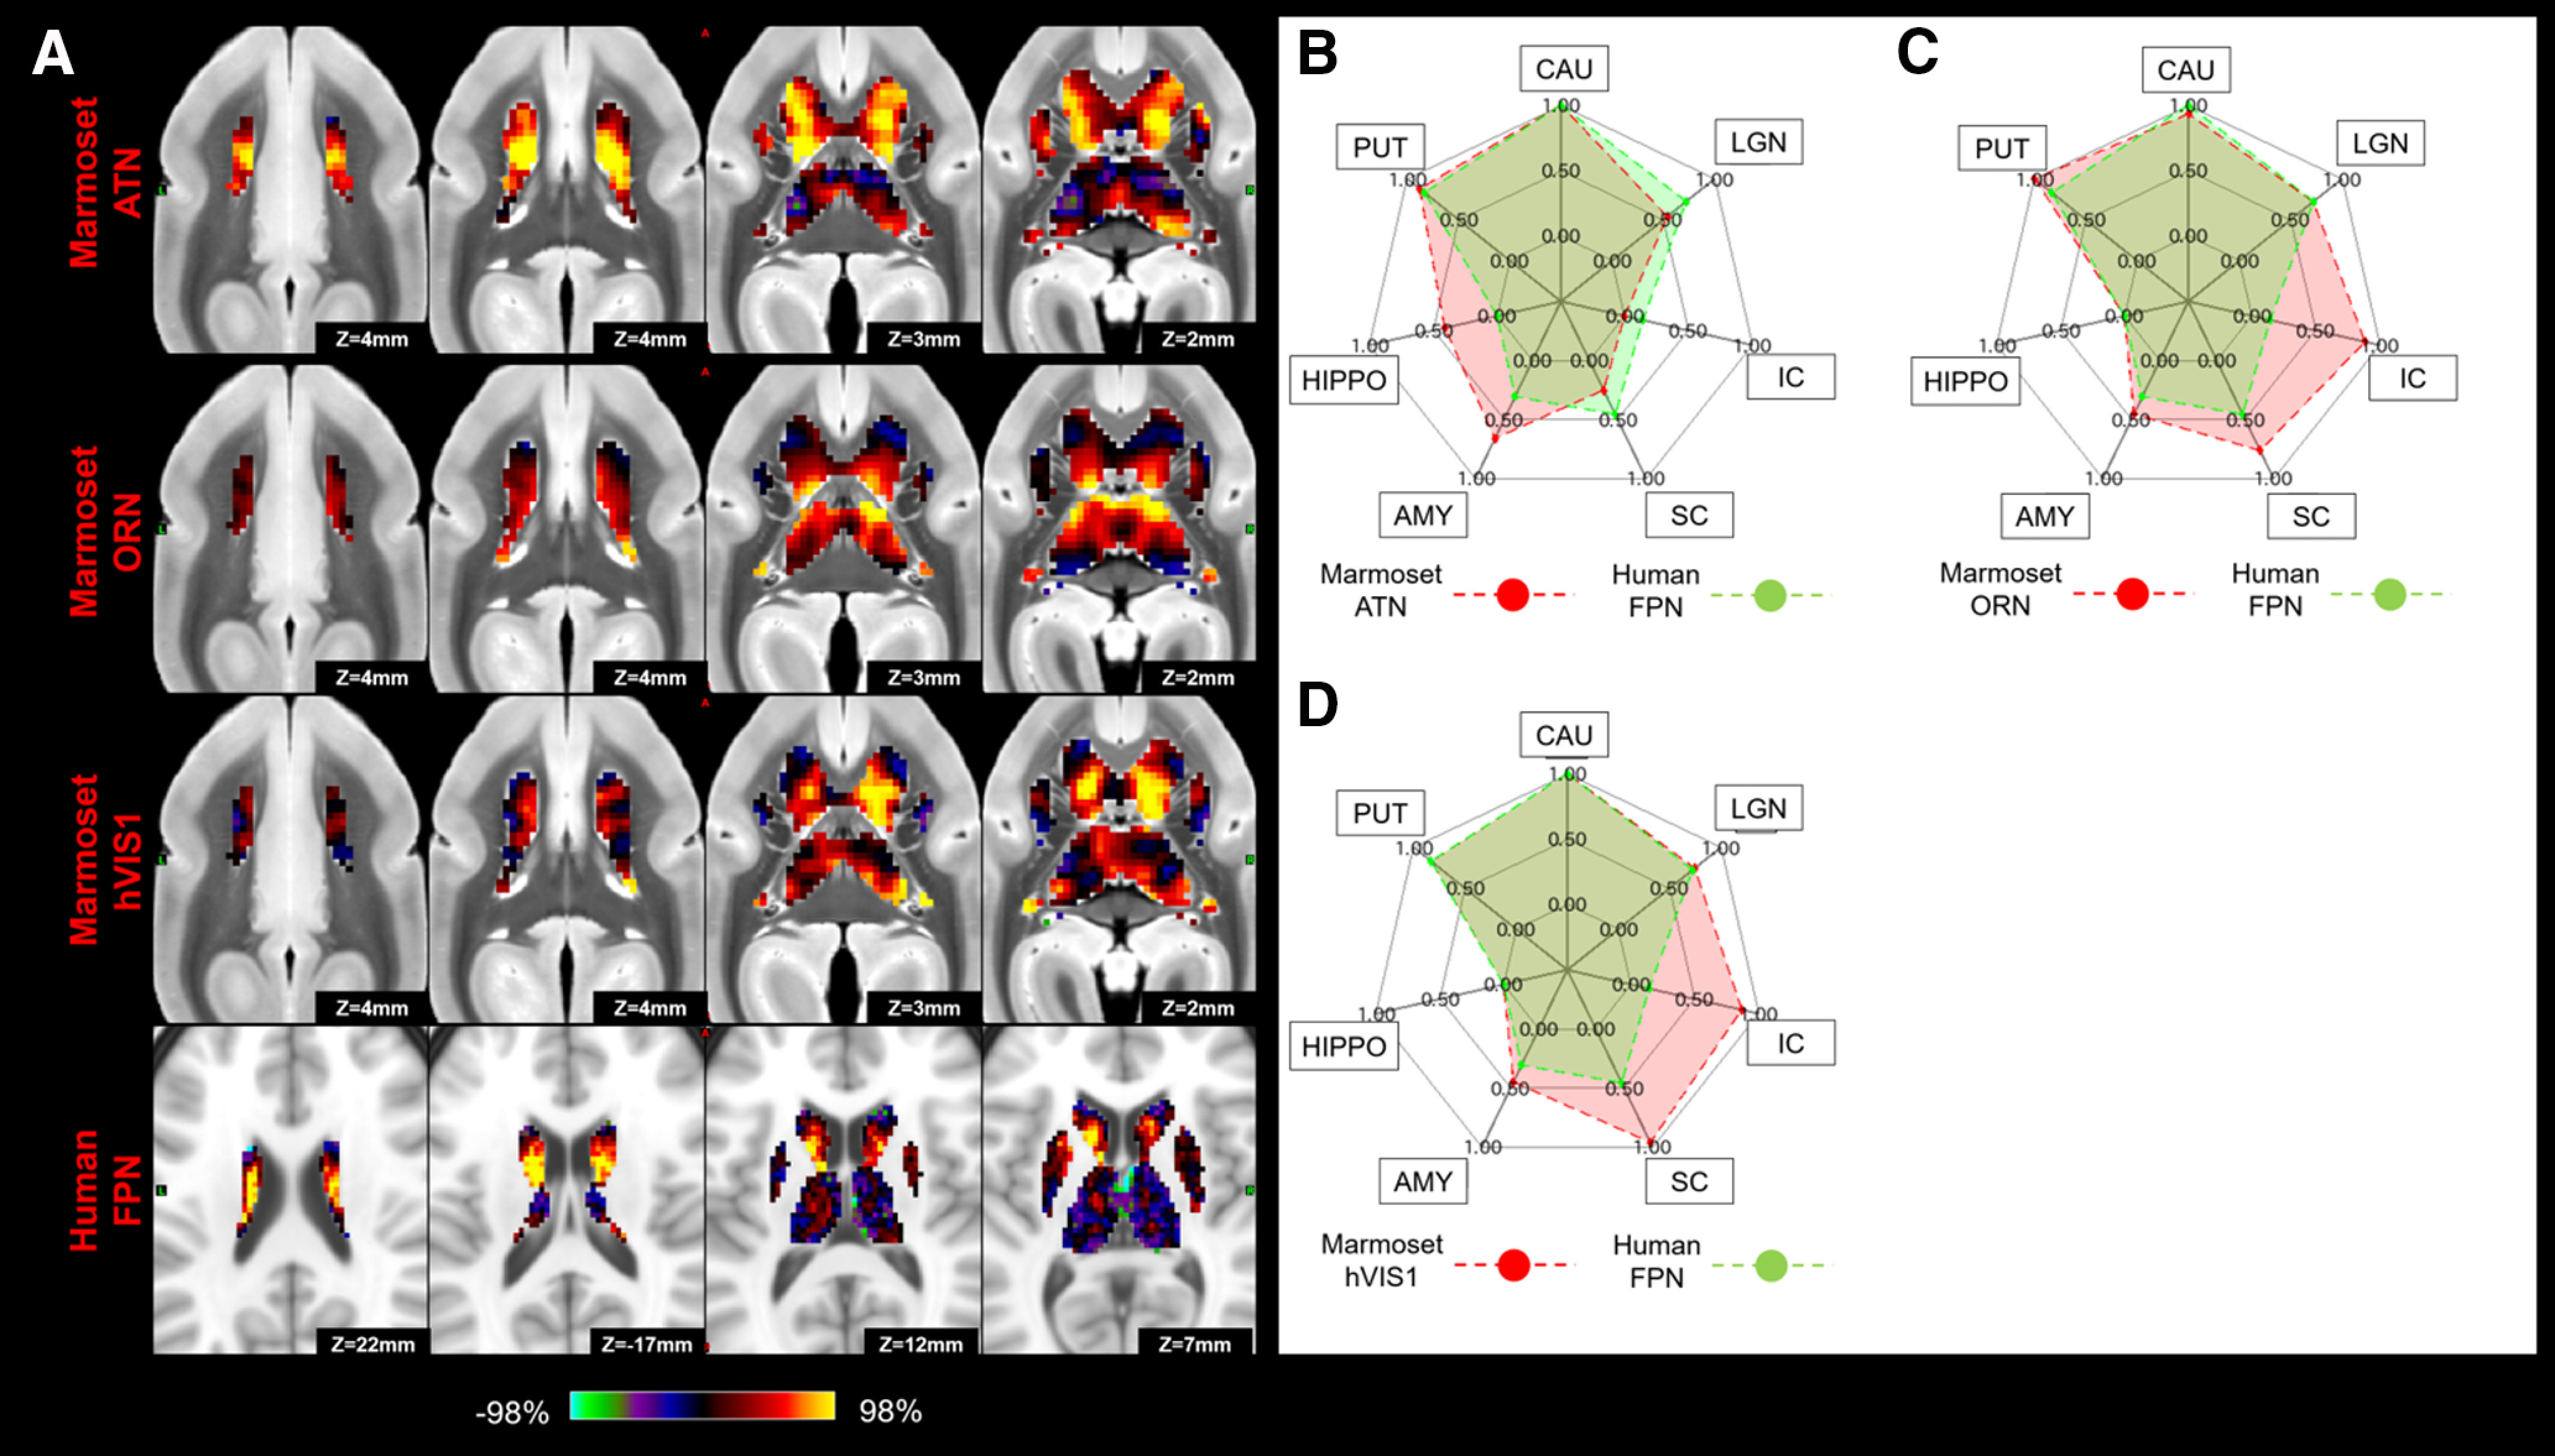
Matching human FPN to marmoset ATN, ORN, and hVIS1 in subcortical area. A, z score maps were shown in axial slices focused on the caudate, which has the strongest connections in both species. A single-color palette applies to two species but is scaled according to percentile ranges within each species rather than to absolute values. B–D, Fingerprints show the matching connectivity patterns between marmosets and humans. Red and green areas represent marmoset and human fingerprints, respectively. CAU, Caudate; PUT, putamen; HIPPO, hippocampus; AMY, amygdala.
Figure 13.
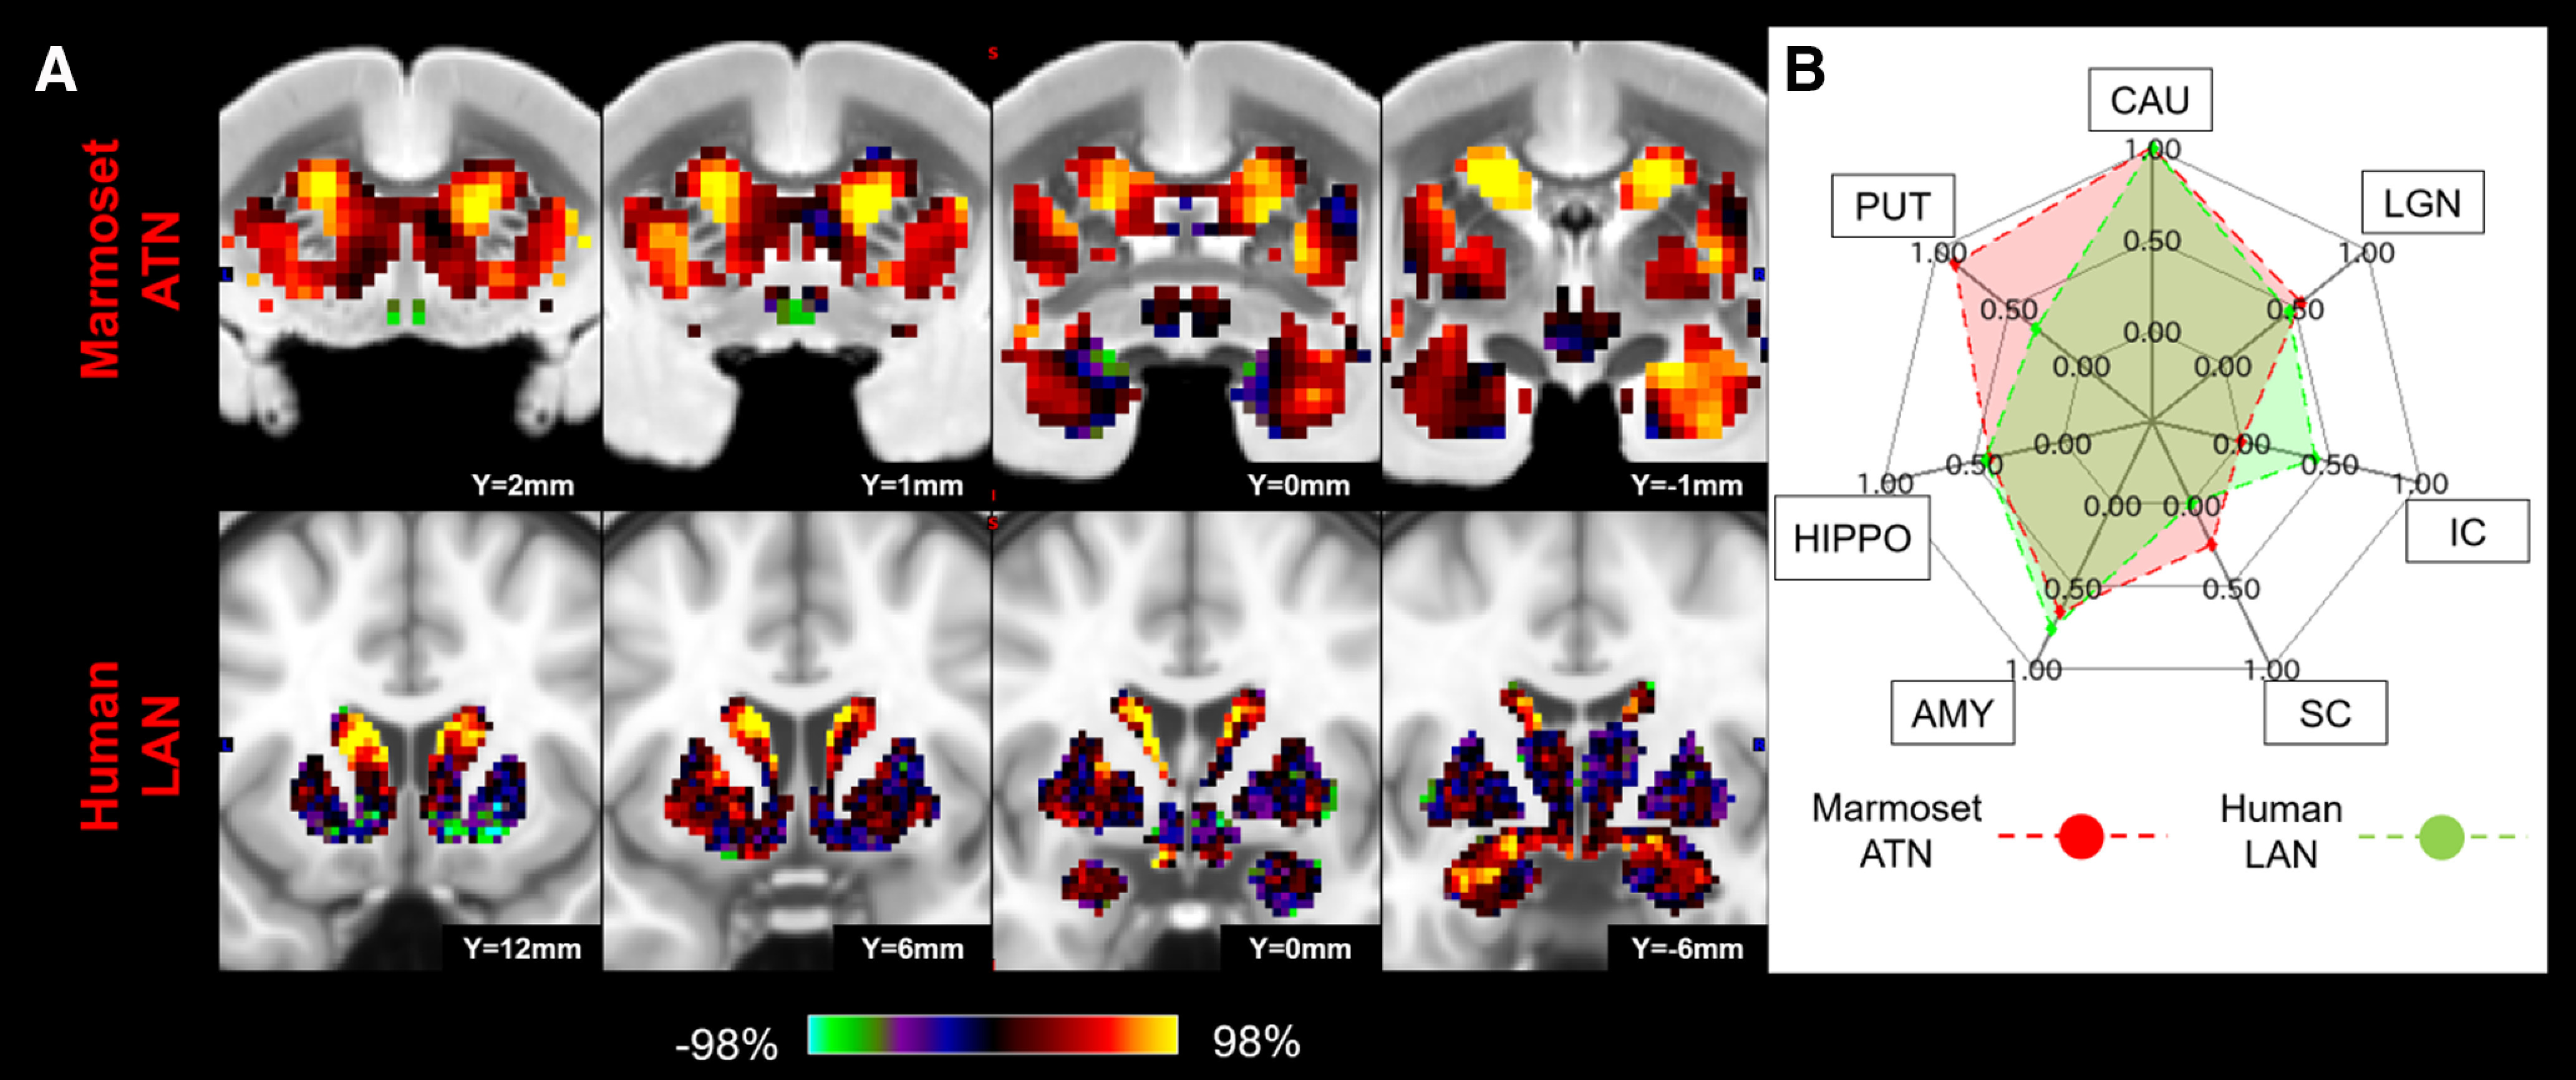
Matching human LAN to marmoset ATN in subcortical area. A, z score maps were shown in coronal slices focused on the caudate and amygdala, which have strong connections in both species. A single-color palette applies to two species but is scaled according to percentile ranges within each species rather than to absolute values. B, Fingerprint shows the matching connectivity pattern between marmosets and humans. Red and green areas represent marmoset and human fingerprints, respectively. CAU, Caudate; PUT, putamen; HIPPO, hippocampus; AMY, amygdala.
Figure 14.
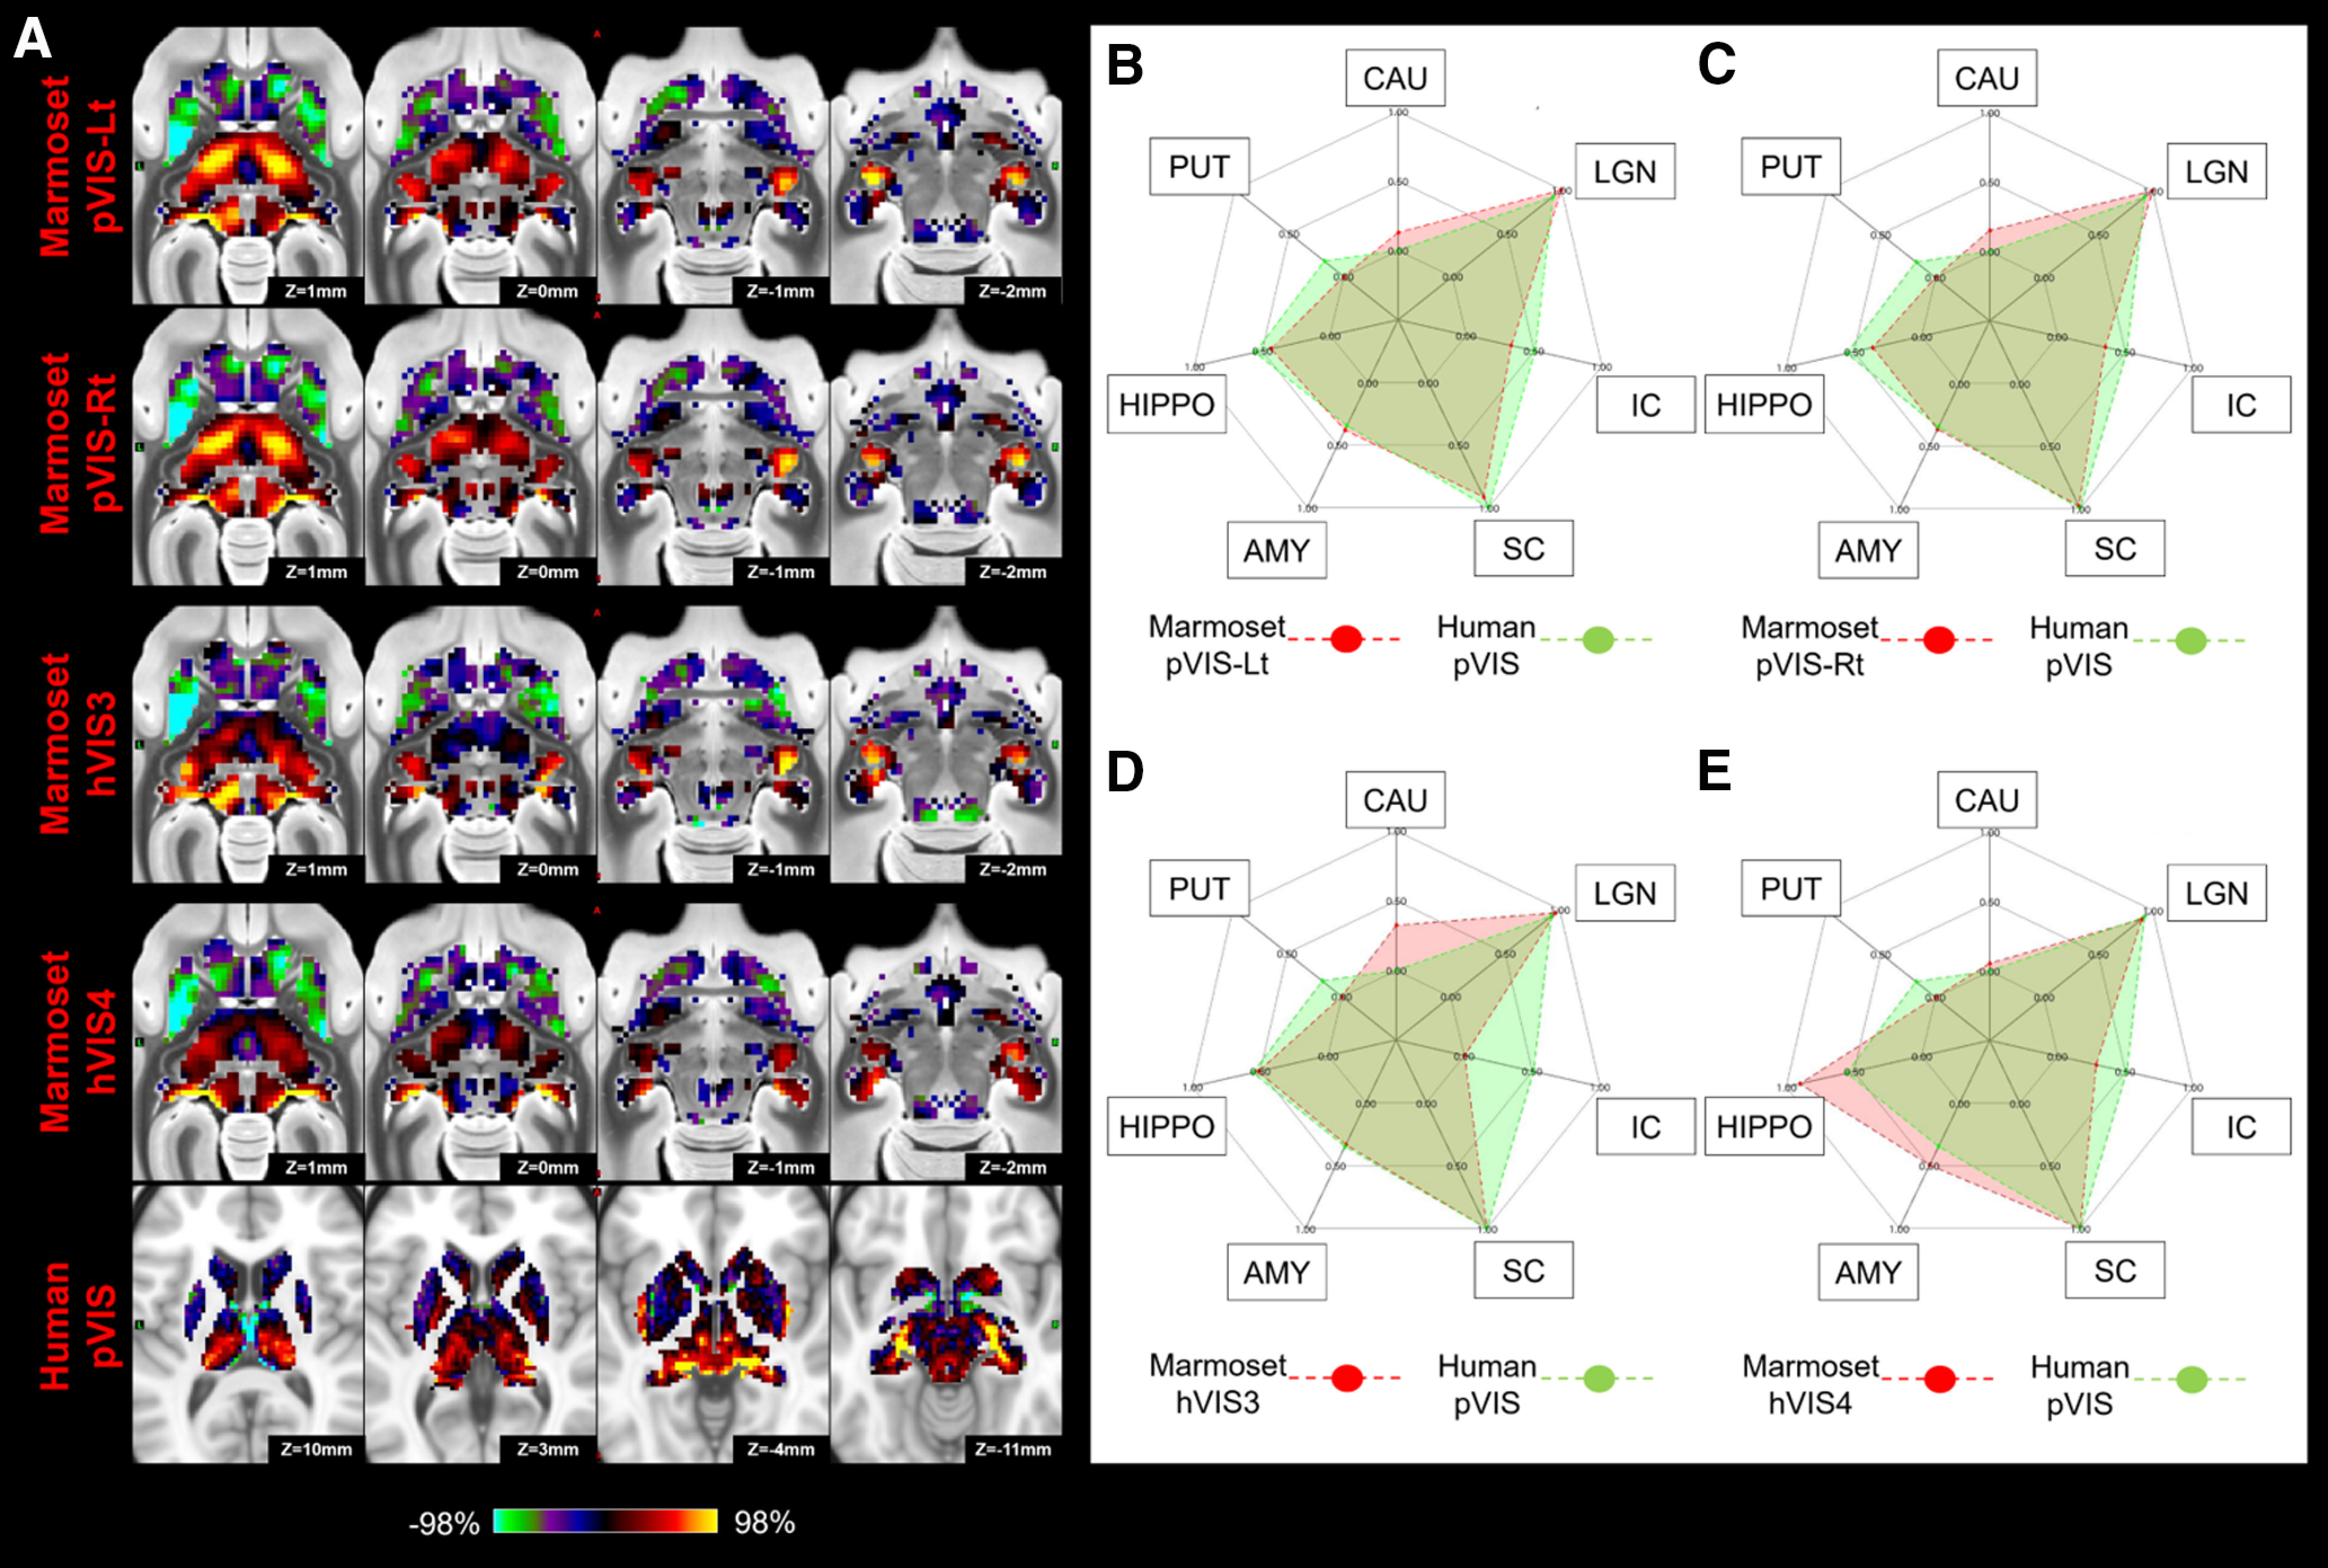
Matching human pVIS to marmoset VISs (pVIS-Lt, pVIS-Rt, hVIS3, and hVIS4) in subcortical area. A, z score maps for each were shown in axial slices focused on the superior colliculus and LGN, which have strong connections in both species. A single-color palette applies to two species but is scaled according to percentile ranges within each species rather than to absolute values. B–E, Fingerprints show the matching connectivity patterns between marmosets and humans. Red and green areas represent marmoset and human fingerprints, respectively. CAU, Caudate; PUT, putamen; HIPPO, hippocampus; AMY, amygdala.
Figure 15.
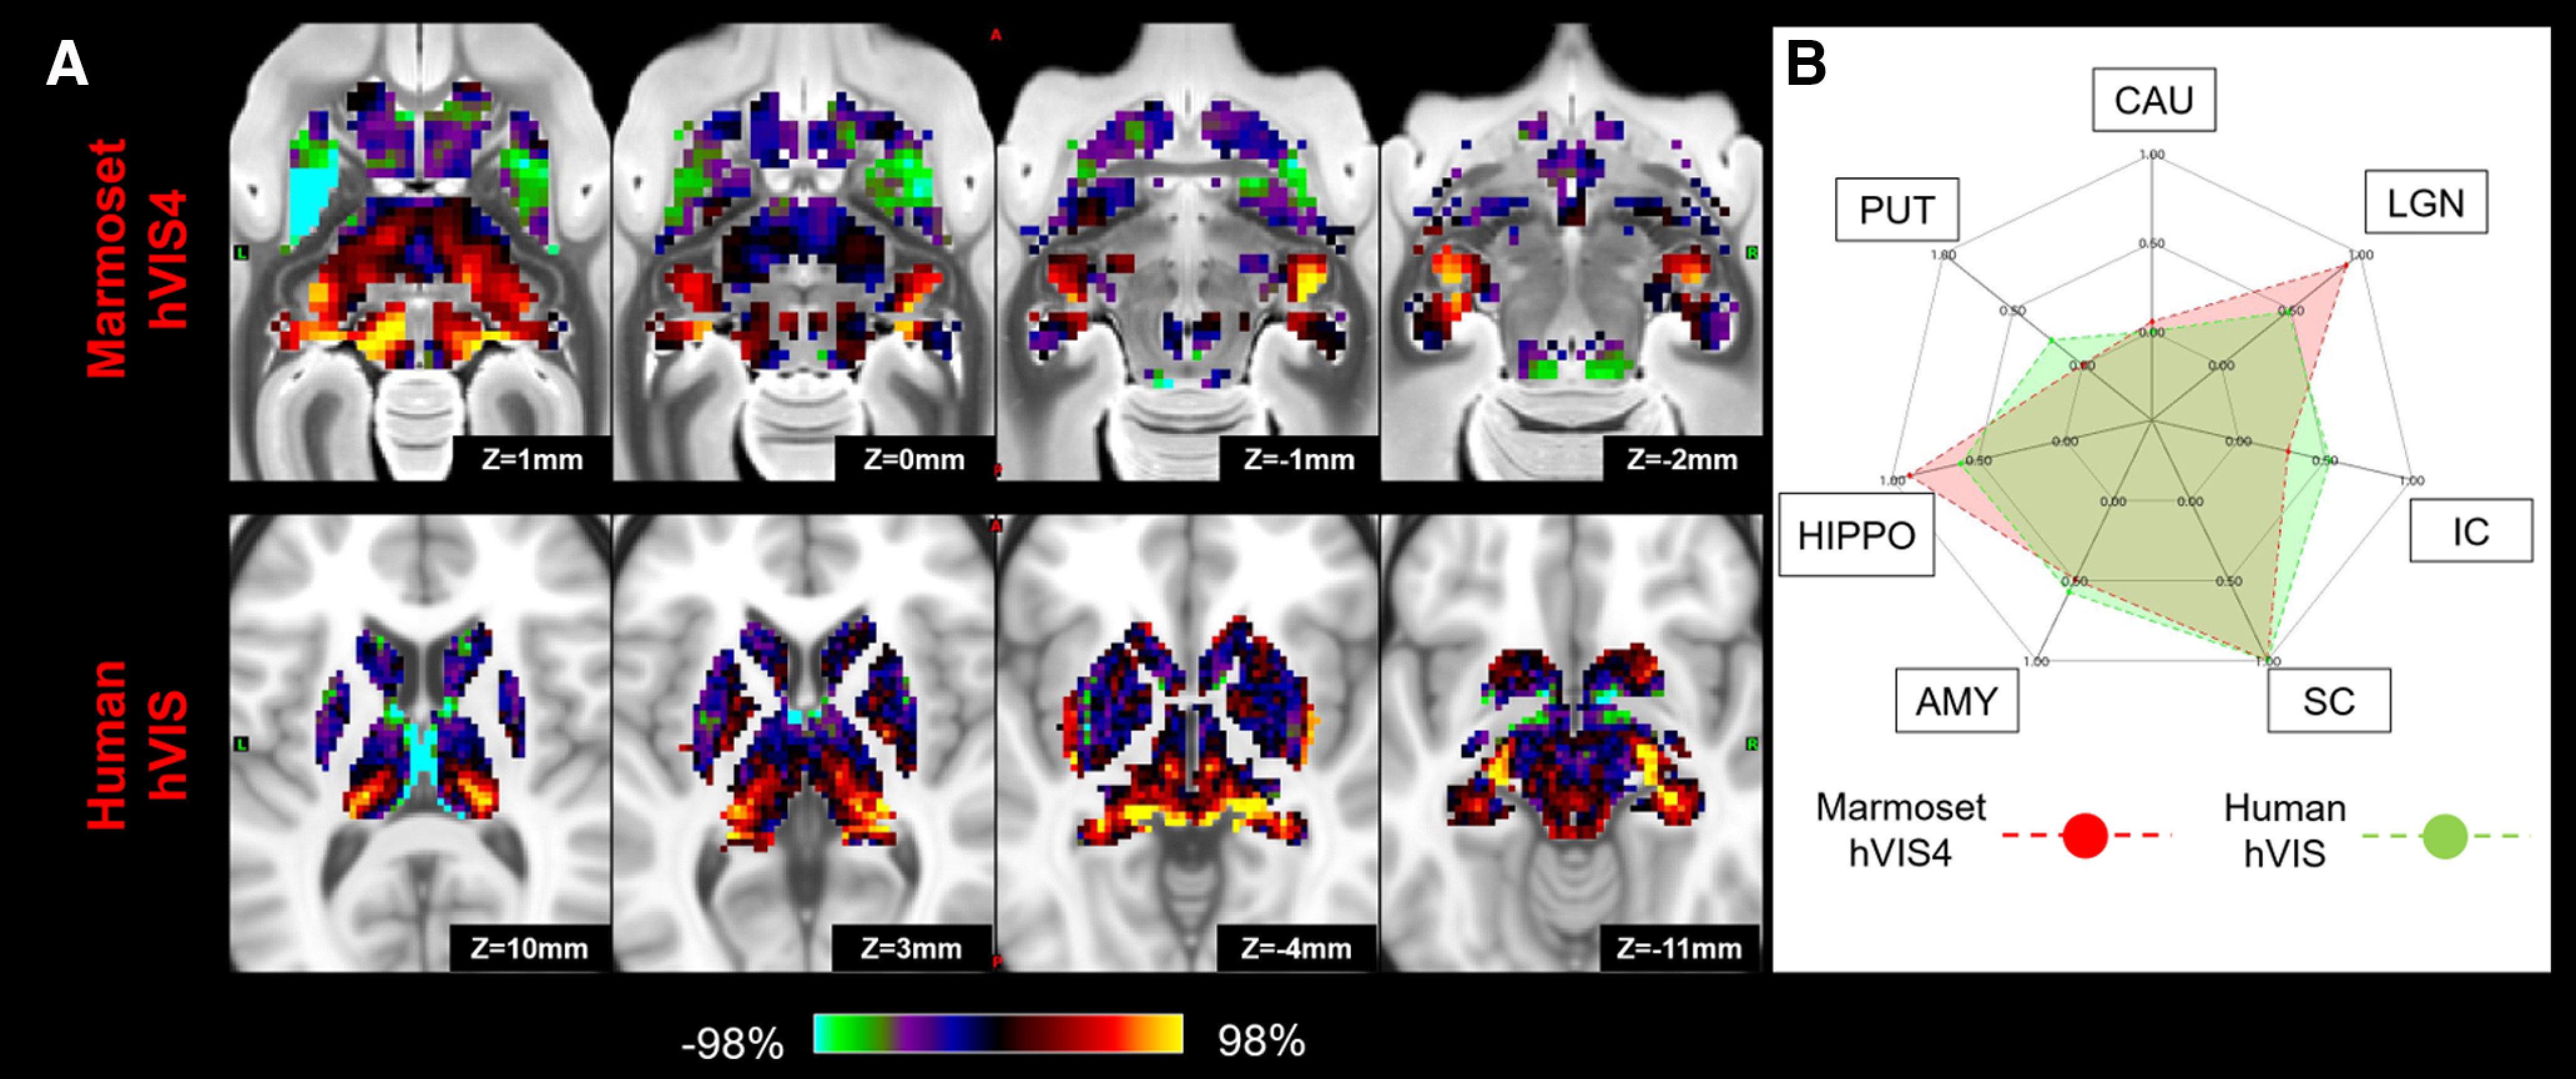
Matching human secondary visual network (hVIS) to marmoset high-order visual network (hVIS4) in subcortical area. A, z score maps were shown in axial slices focused on the superior colliculus and LGN, which have strong connections in both species. A single-color palette applies to two species but is scaled according to percentile ranges within each species rather than to absolute values. B, A fingerprint shows the matching connectivity patterns between marmosets and humans. Red and green areas represent marmoset and human fingerprints, respectively. CAU, Caudate; PUT, putamen; HIPPO, hippocampus; AMY, amygdala.
Figure 16.
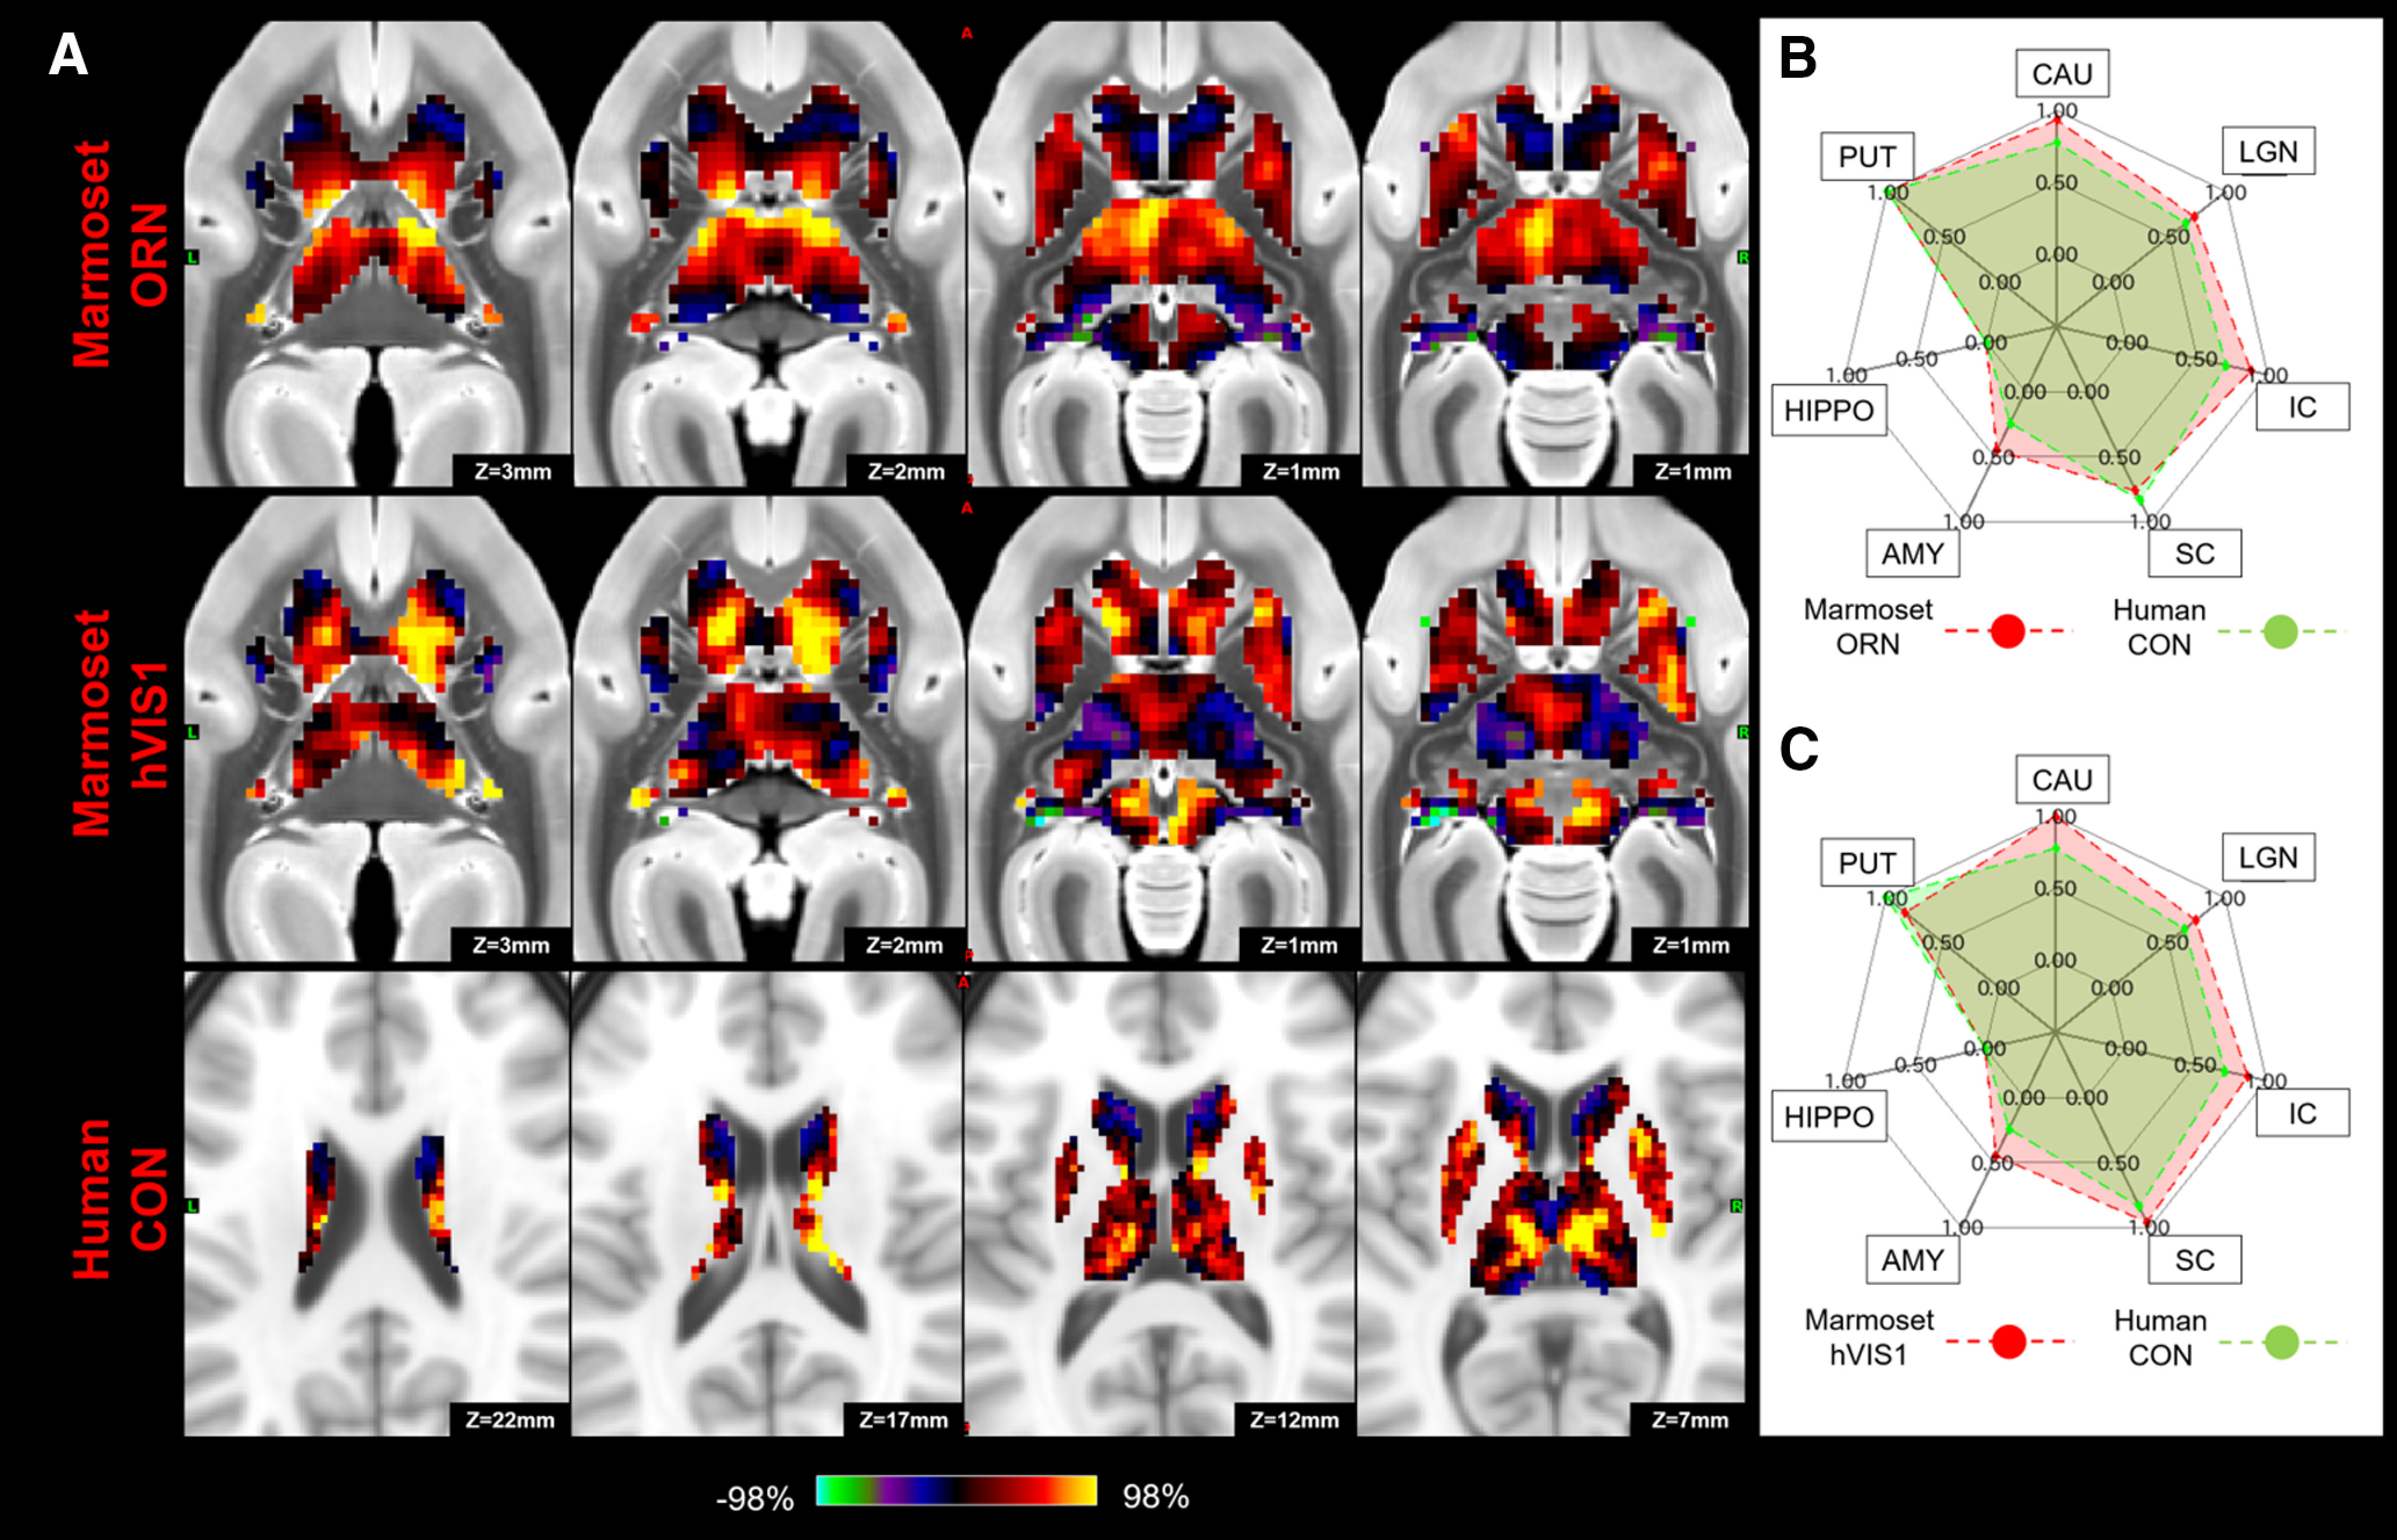
Matching human CON to marmoset ORN and high-order visual networks (hVIS1) in subcortical area. A, z score maps were shown in axial slices focused on the caudate and putamen, which have strong connections in both species. A single-color palette applies to two species but is scaled according to percentile ranges within each species rather than to absolute values. B, C, Fingerprints show the matching connectivity patterns between marmosets and humans. Red and green areas represent marmoset and human fingerprints, respectively. CAU, Caudate; PUT, putamen; HIPPO, hippocampus; AMY, amygdala.
Discussion
In the present study, we identified the cortico-subcortical functional connections of RSNs in marmosets, then matched these networks with similar human networks based on the fingerprints of their cortico-subcortical functional connectivity profiles. We found that the cortico-subcortical fingerprints of several RSNs matched between marmosets and humans, suggesting a similar functional cortico-subcortical organization of these networks in these two species.
The DMN includes the hippocampus not only in humans (Greicius et al., 2004), but also in macaques (Mantini et al., 2011; Vincent et al., 2007) and rats (Lu et al., 2012). Our results showed that the marmoset DMN includes the hippocampus as well, indicating that it may be a conserved feature across species. However, the cortical DMN in marmosets was also functionally connected to the SC, which is not the case for the human DMN. In addition to this difference in subcortical connectivity, the marmoset DMN includes a fairly large parietal region that includes areas LIP, VIP, and MIP. Microstimulation in this region around the shallow intraparietal sulcus evokes contralateral saccades (Ghahremani et al., 2019) and single neurons in this region are active for saccadic eye movements (Ma et al., 2020). On the other hand, the parietal region of the human DMN does not include the parietal eye fields defined by multimodal MRI techniques (Glasser et al., 2016). This discrepancy might produce the difference of the connections with the SC between the species. It also suggests that the marmoset DMN may not subserve all of the same functions as the human DMN.
The marmoset ATN consisted of ventral frontal areas (8aV, 45), which are associated with small saccadic eye movements (Selvanayagam et al., 2019). This network was mainly connected to the caudate and putamen, and this subcortical activation pattern was consistent with the human FPN, which includes the frontal eye field and intraparietal areas that are involved in saccade generation (Luna et al., 1998) and attention (Corbetta et al., 1998). Previous human (Raemaekers et al., 2002, 2006) and macaque studies (Hikosaka and Wurtz, 1989; Phillips and Everling, 2012) have shown activations in the striatum (both caudate and putamen) during saccade tasks. The parietal component of the marmoset ATN, however, lies anterior to area LIP, which is activated by saccadic eye movements (Schaeffer et al., 2019d) and where saccades can be evoked by electrical microstimulation in marmosets (Ghahremani et al., 2019), arguing perhaps against a pure role of this network in saccadic eye movements. Indeed, we found that the human LAN also matched the marmoset ATN in terms of its cortico-subcortical connectivity fingerprint. In both species, the networks showed strong functional connectivity with the caudate. In addition, there are also clear similarities in the cortical regions between the marmoset ATN and the human LAN. Broca's area (area 44, 45) is a prominent part of the human LAN and the marmoset ATN network also includes area 45. Single neurons in marmoset area 45 and 8aV respond to marmoset vocalizations and many are active for vocalizations (Miller et al., 2015), supporting a role of this area in vocalization. The finding that the cortico-subcortical fingerprint of the ATN matched with both the human FPN and the LAN may suggest that this core FPN is the evolutionary precursor to these networks. The marmoset labels might not always be correct because few studies have verified them (with the exception of the DMN by Cirong et al., 2019). Although we have labeled this network as ATN here to be consistent with a previous paper (Hori et al., 2020b), a better label would probably be just FPN for this network based on the subcortical profiles, which is consistent with an older report from our laboratory that used ICA to identify RSNs in anesthetized marmosets (Ghahremani et al., 2017).
The subcortical pattern in the human FPN also showed a match to the marmoset hVIS1. The main cortical activations in hVIS1 were along with the ventral visual stream, including TE3, V4T, and FST (Hung et al., 2015a; Schaeffer et al., 2019d). This is consistent with human and macaque studies showing that the FPN includes a part of ventral visual stream (Yeo et al., 2011; Hutchison et al., 2012; Ji et al., 2019). In addition, both human and macaque frontal eye fields are functionally connected to these regions (Hutchison et al., 2012). As such, the hVIS1 in marmosets seems to correspond to the temporal regions in the human FPN. Interestingly, the subcortical pattern in the hVIS1 also showed a match to the human CON as well as FPN. These two functional networks display increased activity during the performance of complex cognitive tasks (Dosenbach et al., 2006; Sheffield et al., 2015; Wallis et al., 2015), and both are associated with top-down control associated with executive functioning (Dosenbach et al., 2007). Together with our findings, the marmoset hVIS1 might be related to both FPN and CON through the putamen and caudate and play an important role in top-down cognitive processing.
The cortical visual networks in marmosets were strongly connected to the SC, LGN, VP, and pulvinar nucleus. These regions are known to be associated with the visual system (Hung et al., 2015a,b) and are structurally connected to visual-related cortices (Kaas and Lyon, 2007; Solomon and Rosa, 2014; Zeater et al., 2019). We found that these subcortical activation patterns in marmoset corresponded well to those in humans, suggesting that the visual systems have a similar cortico-subcortical organization in both species. Previous anatomic studies and electrophysiological recordings in marmosets have also shown that this species' cortical visual hierarchy closely resembles that of other primates, including humans (Yu and Rosa, 2010; McDonald et al., 2014; Mitchell and Leopold, 2015).
In conclusion, we have shown here that many of the marmoset RNSs can be matched to human RSNs based on their cortico-subcortical fingerprint. While this suggests a similar cortico-subcortical network organization in marmosets and humans, our results also show that there are differences in the connectivity profiles that likely have consequences on the actual functions of these RSNs. Electrophysiological and task-based fMRI studies in marmosets will be necessary to further investigate functional similarities and differences in RSN organization between the two species.
Footnotes
This work was supported by Canadian Institutes of Health Research FRN 148365 and FRN 353372, and the Canada First Research Excellence Fund to BrainsCAN. Human data were provided by the Washington University-University of Minnesota Consortium of the Human Connectome Project (WU-Minn HCP; Principal Investigators: David Van Essen and Kamil Ugurbil; 1U54MH091657) funded by the 16 National Institutes of Health institutes and centers that support the National Institutes of Health Blueprint for Neuroscience Research; and by the McDonnell Center for Systems Neuroscience at Washington University. We thank Miranda Bellyou and Cheryl Vander Tuin for animal preparation and care; and Dr. Alex Li for scanning assistance.
The authors declare no competing financial interests.
References
- Balsters JH, Zerbi V, Sallet J, Wenderoth N, Mars RB (2020) Primate homologs of mouse cortico-striatal circuits. eLife 9:e53680 10.7554/eLife.53680 [DOI] [PMC free article] [PubMed] [Google Scholar]
- Beckmann CF, Smith SM (2004) Probabilistic independent component analysis for functional magnetic resonance imaging. IEEE Trans Med Imaging 23:137–152. 10.1109/TMI.2003.822821 [DOI] [PubMed] [Google Scholar]
- Belcher AM, Yen CC, Stepp H, Gu H, Lu H, Yang Y, Silva AC, Stein EA (2013) Large-scale brain networks in the awake, truly resting marmoset monkey. J Neurosci 33:16796–16804. 10.1523/JNEUROSCI.3146-13.2013 [DOI] [PMC free article] [PubMed] [Google Scholar]
- Cirong L, Yen CC, Szczupak D, Ye FQ, Leopold DA, Silva AC (2019) Anatomical and Functional Investigation of the Marmoset Default Mode Network. Nat Commun 10:1975. [DOI] [PMC free article] [PubMed] [Google Scholar]
- Cléry JC, Schaeffer DJ, Hori Y, Gilbert KM, Hayrynen LK, Gati JS, Menon RS, Everling S (2020) Looming and receding visual networks in awake marmosets investigated with fMRI. Neuroimage 215:116815. 10.1016/j.neuroimage.2020.116815 [DOI] [PubMed] [Google Scholar]
- Corbetta M, Akbudak E, Conturo TE, Snyder AZ, Ollinger JM, Drury HA, Linenweber MR, Petersen SE, Raichle ME, Van Essen DC, Shulman GL (1998) A common network of functional areas for attention and eye movements. Neuron 21:761–773. 10.1016/s0896-6273(00)80593-0 [DOI] [PubMed] [Google Scholar]
- Damoiseaux JS, Rombouts SARB, Barkhof F, Scheltens P, Stam CJ, Smith SM, Beckmann CM (2006) Consistent Resting-State Networks across Healthy Subjects. Proc Natl Acad Sci USA 103:13848–13853. [DOI] [PMC free article] [PubMed] [Google Scholar]
- Dosenbach NU, Visscher KM, Palmer ED, Miezin FM, Wenger KK, Kang HC, Burgund ED, Grimes AL, Schlaggar BL, Petersen SE (2006) A core system for the implementation of task sets. Neuron 50:799–812. 10.1016/j.neuron.2006.04.031 [DOI] [PMC free article] [PubMed] [Google Scholar]
- Dosenbach NU, Fair DA, Miezin FM, Cohen AL, Wenger KK, Dosenbach RA, Fox MD, Snyder AZ, Vincent JL, Raichle ME, Schlaggar BL, Petersen SE (2007) Distinct brain networks for adaptive and stable task control in humans. Proc Natl Acad Sci USA 104:11073–11078. 10.1073/pnas.0704320104 [DOI] [PMC free article] [PubMed] [Google Scholar]
- Filippini N, MacIntosh BJ, Hough MG, Goodwin GM, Frisoni GB, Smith SM, Matthews PM, Beckmann CF, Mackay CE (2009) Distinct patterns of brain activity in young carriers of the APOE- 4 allele. Proc Natl Acad Sci USA 106:7209–7214. 10.1073/pnas.0811879106 [DOI] [PMC free article] [PubMed] [Google Scholar]
- Fox MD, Raichle ME (2007) Spontaneous Fluctuations in Brain Activity Observed with Functional Magnetic Resonance Imaging. Nat Rev Neurosci 8:700–711. [DOI] [PubMed] [Google Scholar]
- Ghahremani M, Hutchison RM, Menon RS, Everling S (2017) Frontoparietal functional connectivity in the common marmoset. Cereb Cortex 27:3890–3905. 10.1093/cercor/bhw198 [DOI] [PubMed] [Google Scholar]
- Ghahremani M, Johnston KD, Ma L, Hayrynen LK, Everling S (2019) Electrical microstimulation evokes saccades in posterior parietal cortex of common marmosets. J Neurophysiol 122:1765–1776. 10.1152/jn.00417.2019 [DOI] [PubMed] [Google Scholar]
- Glasser MF, Coalson TS, Robinson EC, Hacker CD, Harwell J, Yacoub E, Ugurbil K, Andersson J, Beckmann CF, Jenkinson M, Smith SM, Van Essen DC (2016) A multi-modal parcellation of human cerebral cortex. Nature 536:171–178. 10.1038/nature18933 [DOI] [PMC free article] [PubMed] [Google Scholar]
- Greicius MD, Srivastava G, Reiss AL, Menon V (2004) Default-mode network activity distinguishes Alzheimer's disease from healthy aging: evidence from functional MRI. Proc Natl Acad Sci USA 101:4637–4642. 10.1073/pnas.0308627101 [DOI] [PMC free article] [PubMed] [Google Scholar]
- Griffanti L, Douaud G, Bijsterbosch J, Evangelisti S, Alfaro-Almagro F, Glasser MF, Duff EP, Fitzgibbon S, Westphal R, Carone D, Beckmann CF, Smith SM (2017) Hand classification of fMRI ICA noise components. Neuroimage 154:188–205. 10.1016/j.neuroimage.2016.12.036 [DOI] [PMC free article] [PubMed] [Google Scholar]
- Handler WB, Bindseil G, Chaddock R, Dalrymple B, Gati JS, Gilbert KM, Harris C, Klassen LM, Peterson J, Van Sas F, Chronik BA (2020) Design and construction of a gradient coil for high resolution marmoset imaging. Biomed Phys Eng Express 6:045022 10.1088/2057-1976/ab8d97 [DOI] [PubMed] [Google Scholar]
- Hikosaka O, Wurtz RH (1989) The basal ganglia. Rev Oculomot Res 3:257–281. [PubMed] [Google Scholar]
- Hori Y, Schaeffer DJ, Gilbert KM, Hayrynen LK, Cléry JC, Gati JS, Menon RS, Everling S (2020a) Comparison of resting-state functional connectivity in marmosets with tracer-based cellular connectivity. Neuroimage 204:116241. 10.1016/j.neuroimage.2019.116241 [DOI] [PubMed] [Google Scholar]
- Hori Y, Schaeffer DJ, Gilbert KM, Hayrynen LK, Cléry JC, Gati JS, Menon RS, Everling S (2020b) Altered resting-state functional connectivity between awake and isoflurane anesthetized marmosets. Cereb Cortex 30:5943–5959. [DOI] [PMC free article] [PubMed] [Google Scholar]
- Hung CC, Yen CC, Ciuchta JL, Papoti D, Bock NA, Leopold DA, Silva AC (2015a) Functional MRI of visual responses in the awake, behaving marmoset. Neuroimage 120:1–11. 10.1016/j.neuroimage.2015.06.090 [DOI] [PMC free article] [PubMed] [Google Scholar]
- Hung CC, Yen CC, Ciuchta JL, Papoti D, Bock NA, Leopold DA, Silva AC (2015b) Functional mapping of face-selective regions in the extrastriate visual cortex of the marmoset. J Neurosci 35:1160–1172. 10.1523/JNEUROSCI.2659-14.2015 [DOI] [PMC free article] [PubMed] [Google Scholar]
- Hutchison RM, Gallivan JP, Culham JC, Gati JS, Menon RS, Everling S (2012) Functional connectivity of the frontal eye fields in humans and macaque monkeys investigated with resting-state fMRI. J Neurophysiol 107:2463–2474. 10.1152/jn.00891.2011 [DOI] [PubMed] [Google Scholar]
- Ji JL, Spronk M, Kulkarni K, Repovš G, Anticevic A, Cole MW (2019) Mapping the human brain's cortical-subcortical functional network organization. Neuroimage 185:35–57. 10.1016/j.neuroimage.2018.10.006 [DOI] [PMC free article] [PubMed] [Google Scholar]
- Johnston KD, Barker K, Schaeffer L, Schaeffer DJ, Everling S (2018) Methods for chair restraint and training of the common marmoset on oculomotor tasks. J Neurophysiol 119:1636–1646. 10.1152/jn.00866.2017 [DOI] [PubMed] [Google Scholar]
- Kaas JH, Lyon DC (2007) Pulvinar contributions to the dorsal and ventral streams of visual processing in primates. Brain Res Rev 55:285–296. 10.1016/j.brainresrev.2007.02.008 [DOI] [PMC free article] [PubMed] [Google Scholar]
- Li X, Morgan PS, Ashburner J, Smith J, Rorden C (2016) The first step for neuroimaging data analysis: DICOM to NIfTI conversion. J Neurosci Methods 264:47–56. 10.1016/j.jneumeth.2016.03.001 [DOI] [PubMed] [Google Scholar]
- Liu C, Ye FQ, Yen CC, Newman JD, Glen D, Leopold DA, Silva AC (2018) A digital 3D atlas of the marmoset brain based on multi-modal MRI. Neuroimage 169:106–116. 10.1016/j.neuroimage.2017.12.004 [DOI] [PMC free article] [PubMed] [Google Scholar]
- Liu C, Ye FQ, Newman JD, Szczupak D, Tian X, Yen CC, Majka P, Glen D, Rosa MG, Leopold DA, Silva AC (2020) A resource for the detailed 3D mapping of white matter pathways in the marmoset brain. Nat Neurosci 23:271–280. 10.1038/s41593-019-0575-0 [DOI] [PMC free article] [PubMed] [Google Scholar]
- Lu H, Zou Q, Gu H, Raichle ME, Stein EA, Yang Y (2012) Rat brains also have a default mode network. Proc Natl Acad Sci USA 109:3979–3984. 10.1073/pnas.1200506109 [DOI] [PMC free article] [PubMed] [Google Scholar]
- Luna B, Thulborn K, Strojwas M, McCurtain B, Berman R, Genovese C, Sweeney J (1998) Dorsal cortical regions subserving visually guided saccades in humans: an fMRI study. Cereb Cortex 8:40–47. 10.1093/cercor/8.1.40 [DOI] [PubMed] [Google Scholar]
- Ma L, Selvanayagam J, Ghahremani M, Hayrynen LK, Johnston KD, Everling S (2020) Single-unit activity in marmoset posterior parietal cortex in a gap saccade task. J Neurophysiol 123:896–911. 10.1152/jn.00614.2019 [DOI] [PubMed] [Google Scholar]
- Majka P, Bai S, Bakola S, Bednarek S, Chan JM, Jermakow N, Passarelli L, Reser DH, Theodoni P, Worthy KH, Wang XJ, Wójcik DK, Mitra PP, Rosa MG (2020) Open access resource for cellular-resolution analyses of corticocortical connectivity in the marmoset monkey. Nat Commun 11:1133. 10.1038/s41467-020-14858-0 [DOI] [PMC free article] [PubMed] [Google Scholar]
- Majka P, Chaplin TA, Yu HH, Tolpygo A, Mitra PP, Wójcik DK, Rosa MG (2016) Towards a comprehensive atlas of cortical connections in a primate brain: mapping tracer injection studies of the common marmoset into a reference digital template: atlas of primate brain cortical connections. J Comp Neurol 524:2161–2181. 10.1002/cne.24023 [DOI] [PMC free article] [PubMed] [Google Scholar]
- Mantini D, Gerits A, Nelissen K, Durand JB, Joly O, Simone L, Sawamura H, Wardak C, Orban GA, Buckner RL, Vanduffel W (2011) Default mode of brain function in monkeys. J Neurosci 31:12954–12962. 10.1523/JNEUROSCI.2318-11.2011 [DOI] [PMC free article] [PubMed] [Google Scholar]
- Mars RB, Verhagen L, Gladwin TE, Neubert FX, Sallet J, Rushworth MF (2016) Comparing brains by matching connectivity profiles. Neurosci Biobehav Rev 60:90–97. 10.1016/j.neubiorev.2015.10.008 [DOI] [PMC free article] [PubMed] [Google Scholar]
- Mars RB, Passingham RE, Jbabdi S (2018) Connectivity fingerprints: from areal descriptions to abstract spaces. Trends Cogn Sci 22:1026–1037. 10.1016/j.tics.2018.08.009 [DOI] [PMC free article] [PubMed] [Google Scholar]
- McDonald JS, Clifford CW, Solomon SS, Chen SC, Solomon SG (2014) Integration and segregation of multiple motion signals by neurons in area MT of primate. J Neurophysiol 111:369–378. 10.1152/jn.00254.2013 [DOI] [PubMed] [Google Scholar]
- Miller CT, Thomas AW, Nummela SU, de la Mothe LA (2015) Responses of primate frontal cortex neurons during natural vocal communication. J Neurophysiol 114:1158–1171. 10.1152/jn.01003.2014 [DOI] [PMC free article] [PubMed] [Google Scholar]
- Mitchell JF, Leopold DA (2015) The marmoset monkey as a model for visual neuroscience. Neurosci Res 93:20–46. 10.1016/j.neures.2015.01.008 [DOI] [PMC free article] [PubMed] [Google Scholar]
- Okano H, Mitra P (2015) Brain-mapping projects using the common marmoset. Neurosci Res 93:3–7. 10.1016/j.neures.2014.08.014 [DOI] [PubMed] [Google Scholar]
- Okano H, Sasaki E, Yamamori T, Iriki A, Shimogori T, Yamaguchi Y, Kasai K, Miyawaki A (2016) Brain/MINDS: a Japanese National Brain Project for Marmoset Neuroscience. Neuron 92:582–590. 10.1016/j.neuron.2016.10.018 [DOI] [PubMed] [Google Scholar]
- Park JE, Zhang XF, Choi SH, Okahara J, Sasaki E, Silva AC (2016) Generation of transgenic marmosets expressing genetically encoded calcium indicators. Sci Rep 6:34931. 10.1038/srep34931 [DOI] [PMC free article] [PubMed] [Google Scholar]
- Passingham RE, Stephan KE, Kötter R (2002) The anatomical basis of functional localization in the cortex. Nat Rev Neurosci 3:606–616. 10.1038/nrn893 [DOI] [PubMed] [Google Scholar]
- Paxinos G, Watson C, Petrides M, Rosa M, Tokuno H (2012) The marmoset brain in stereotaxic coordinates. San Diego: Academic. [Google Scholar]
- Phillips JM, Everling S (2012) Neural activity in the macaque putamen associated with saccades and behavioral outcome. PLoS One 7:e51596. 10.1371/journal.pone.0051596 [DOI] [PMC free article] [PubMed] [Google Scholar]
- Raemaekers M, Jansma JM, Cahn W, Van der Geest JN, van der Linden JA, Kahn RS, Ramsey NF (2002) Neuronal substrate of the saccadic inhibition deficit in schizophrenia investigated with 3-dimensional event-related functional magnetic resonance imaging. Arch Gen Psychiatry 59:313–320. 10.1001/archpsyc.59.4.313 [DOI] [PubMed] [Google Scholar]
- Raemaekers M, Ramsey NF, Vink M, van den Heuvel MP, Kahn RS (2006) Brain activation during antisaccades in unaffected relatives of schizophrenic patients. Biol Psychiatry 59:530–535. 10.1016/j.biopsych.2005.07.030 [DOI] [PubMed] [Google Scholar]
- Salimi-Khorshidi G, Douaud G, Beckmann CF, Glasser MF, Griffanti L, Smith SM (2014) Automatic denoising of functional MRI data: combining independent component analysis and hierarchical fusion of classifiers. Neuroimage 90:449–468. 10.1016/j.neuroimage.2013.11.046 [DOI] [PMC free article] [PubMed] [Google Scholar]
- Sasaki E, Suemizu H, Shimada A, Hanazawa K, Oiwa R, Kamioka M, Tomioka I, Sotomaru Y, Hirakawa R, Eto T, Shiozawa S, Maeda T, Ito M, Ito R, Kito C, Yagihashi C, Kawai K, Miyoshi H, Tanioka Y, Tamaoki N, et al. (2009) Generation of transgenic non-human primates with germline transmission. Nature 459:523–527. 10.1038/nature08090 [DOI] [PubMed] [Google Scholar]
- Schaeffer DJ, Adam R, Gilbert KM, Gati JS, Li AX, Menon RS, Everling S (2017) Diffusion-weighted tractography in the common marmoset monkey at 9.4T. J Neurophysiol 118:1344–1354. 10.1152/jn.00259.2017 [DOI] [PMC free article] [PubMed] [Google Scholar]
- Schaeffer DJ, Gilbert KM, Gati JS, Menon RS, Everling S (2019a) Intrinsic functional boundaries of lateral frontal cortex in the common marmoset monkey. J Neurosci 39:1020–1029. 10.1523/jneurosci.2595-18.2018 [DOI] [PMC free article] [PubMed] [Google Scholar]
- Schaeffer DJ, Gilbert KM, Ghahremani M, Gati JS, Menon RS, Everling S (2019b) Intrinsic functional clustering of anterior cingulate cortex in the common marmoset. Neuroimage 186:301–307. 10.1016/j.neuroimage.2018.11.005 [DOI] [PubMed] [Google Scholar]
- Schaeffer DJ, Gilbert KM, Hori Y, Gati JS, Menon RS, Everling S (2019c) Integrated radiofrequency array and animal holder design for minimizing head motion during awake marmoset functional magnetic resonance imaging. Neuroimage 193:126–138. 10.1016/j.neuroimage.2019.03.023 [DOI] [PubMed] [Google Scholar]
- Schaeffer DJ, Gilbert KM, Hori Y, Hayrynen LK, Johnston KD, Gati JS, Menon RS, Everling S (2019d) Task-based fMRI of a free-viewing visuo-saccadic network in the marmoset monkey. Neuroimage 202:116147. 10.1016/j.neuroimage.2019.116147 [DOI] [PubMed] [Google Scholar]
- Schaeffer DJ, Hori Y, Gilbert KM, Gati JS, Menon RS, Everling S (2020) Divergence of rodent and primate medial frontal cortex functional connectivity. Proc Natl Acad Sci USA 117:21681–21689. 10.1073/pnas.2003181117 [DOI] [PMC free article] [PubMed] [Google Scholar]
- Selvanayagam J, Johnston KD, Schaeffer DJ, Hayrynen LK, Everling S (2019) Functional localization of the frontal eye fields in the common marmoset using microstimulation. J Neurosci 39:9197–9206. 10.1523/JNEUROSCI.1786-19.2019 [DOI] [PMC free article] [PubMed] [Google Scholar]
- Sheffield JM, Repovs G, Harms MP, Carter CS, Gold JM, MacDonald AW 3rd, Ragland JD, Silverstein SM, Godwin D, Barch DM (2015) Fronto-parietal and cingulo-opercular network integrity and cognition in health and schizophrenia. Neuropsychologia 73:82–93. 10.1016/j.neuropsychologia.2015.05.006 [DOI] [PMC free article] [PubMed] [Google Scholar]
- Silva AC, Liu JV, Hirano Y, Leoni RF, Merkle H, Mackel JB, Zhang XF, Nascimento GC, Stefanovic B (2011) Longitudinal functional magnetic resonance imaging in animal models. Methods Mol Biol 711:281–302. [DOI] [PMC free article] [PubMed] [Google Scholar]
- Smith SM. (2002) Fast robust automated brain extraction. Hum Brain Mapp 17:143–155. 10.1002/hbm.10062 [DOI] [PMC free article] [PubMed] [Google Scholar]
- Smith SM, Jenkinson M, Woolrich MW, Beckmann CF, Behrens TE, Johansen-Berg H, Bannister PR, De Luca M, Drobnjak I, Flitney DE, Niazy RK, Saunders J, Vickers J, Zhang Y, De Stefano N, Brady JM, Matthews PM (2004) Advances in functional and structural MR image analysis and implementation as FSL. Neuroimage 23:S208–S219. 10.1016/j.neuroimage.2004.07.051 [DOI] [PubMed] [Google Scholar]
- Solomon SG, Rosa MG (2014) A simpler primate brain: the visual system of the marmoset monkey. Front Neural Circuits 8:96. 10.3389/fncir.2014.00096 [DOI] [PMC free article] [PubMed] [Google Scholar]
- Tomioka I, Ishibashi H, Minakawa EN, Motohashi HH, Takayama O, Saito Y, Popiel HA, Puentes S, Owari K, Nakatani T, Nogami N, Yamamoto K, Noguchi S, Yonekawa T, Tanaka Y, Fujita N, Suzuki H, Kikuchi H, Aizawa S, Nagano S, et al. (2017a) Transgenic monkey model of the polyglutamine diseases recapitulating progressive neurological symptoms. eNeuro 4:ENEURO.0250-16.2017 10.1523/ENEURO.0250-16.2017 [DOI] [PMC free article] [PubMed] [Google Scholar]
- Tomioka I, Nogami N, Nakatani T, Owari K, Fujita N, Motohashi H, Takayama O, Takae K, Nagai Y, Seki K (2017b) Generation of transgenic marmosets using a tetracyclin-inducible transgene expression system as a neurodegenerative disease model. Biol Reprod 97:772–780. 10.1093/biolre/iox129 [DOI] [PubMed] [Google Scholar]
- Van Essen DC, Smith SM, Barch DM, Behrens TE, Yacoub E, Ugurbil K, WU-Minn HCP Consortium (2013) The WU-Minn Human Connectome Project: an overview. Neuroimage 80:62–79. 10.1016/j.neuroimage.2013.05.041 [DOI] [PMC free article] [PubMed] [Google Scholar]
- Vincent JL, Patel GH, Fox MD, Snyder AZ, Baker JT, Van Essen DC, Zempel JM, Snyder LH, Corbetta M, Raichle ME (2007) Intrinsic functional architecture in the anaesthetized monkey brain. Nature 447:83–86. 10.1038/nature05758 [DOI] [PubMed] [Google Scholar]
- Wallis G, Stokes M, Cousijn H, Woolrich M, Nobre AC (2015) Frontoparietal and cingulo-opercular networks play dissociable roles in control of working memory. J Cogn Neurosci 27:2019–2034. 10.1162/jocn_a_00838 [DOI] [PubMed] [Google Scholar]
- Xiao Y, Beriault S, Pike GB, Collins DL (2012) Multicontrast multiecho FLASH MRI for targeting the subthalamic nucleus. Magn Reson Imaging 30:627–640. 10.1016/j.mri.2012.02.006 [DOI] [PubMed] [Google Scholar]
- Xiao Y, Fonov V, Bériault S, Subaie FA, Chakravarty MM, Sadikot AF, Pike GB, Collins DL (2015) Multi-contrast unbiased MRI atlas of a Parkinson's disease population. Int J Comput Assist Radiol Surg 10:329–341. 10.1007/s11548-014-1068-y [DOI] [PubMed] [Google Scholar]
- Yeo BT, Krienen FM, Sepulcre J, Sabuncu MR, Lashkari D, Hollinshead M, Roffman JL, Smoller JW, Zöllei L, Polimeni JR, Fischl B, Liu H, Buckner RL (2011) The organization of the human cerebral cortex estimated by intrinsic functional connectivity. J Neurophysiol 106:1125–1165. 10.1152/jn.00338.2011 [DOI] [PMC free article] [PubMed] [Google Scholar]
- Yu HH, Rosa MG (2010) A simple method for creating wide-field visual stimulus for electrophysiology: mapping and analyzing receptive fields using a hemispheric display. J Vis 10:15. 10.1167/10.14.15 [DOI] [PubMed] [Google Scholar]
- Zeater N, Buzás P, Dreher B, Grünert U, Martin PR (2019) Projections of three subcortical visual centers to marmoset lateral geniculate nucleus. J Comp Neurol 527:535–545. 10.1002/cne.24390 [DOI] [PubMed] [Google Scholar]