Abstract
Crystallography provides structural information crucial for fragment optimization, however several criteria must be met to screen directly on protein crystals as soakable, well‐diffracting specimen must be available. We screened a 96‐fragment library against the tRNA‐modifying enzyme TGT using crystallography. Eight hits, some with surprising binding poses, were detected. However, the amount of data collection, reduction and refinement is assumed substantial. Therefore, having a reliable cascade of fast and cost‐efficient methods available for pre‐screening before embarking to elaborate crystallographic screening appears beneficial. This allows filtering of compounds to the most promising hits, available to rapidly progress from hit‐to‐lead. But how to ensure that this workflow is reliable? To answer this question, we also applied SPR and NMR to the same screening sample to study whether identical hits are retrieved. Upon hit‐list comparisons, crystallography shows with NMR and SPR, only one overlapping hit and all three methods shared no common hits. This questions a cascade‐type screening protocol at least in the current example. Compared to crystallography, SPR and NMR detected higher percentages of non‐active‐site binders suggesting the importance of running reporter ligand‐based competitive screens in SPR and NMR, a requirement not needed in crystallography. Although not specific, NMR proved a more sensitive method relative to SPR and crystallography, as it picked up the highest numbers of binders.
Keywords: Fragment Screening, SPR, NMR, X-ray Crystallography, Comparative Analysis
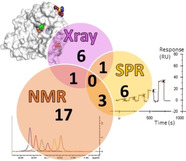
A tRNA‐modifying enzyme was screened against a 96‐fragment library using X‐ray crystallography. Given the elaborate labor‐intensive nature of crystallographic screening, we questioned the benefit of having a reliable cascade of fast and cost‐efficient methods for pre‐screening and filtering of compounds to the most promising hits. To answer this, we applied SPR and NMR to the same screening sample subjected to crystallography to study whether the same hits are retrieved. Upon hit‐list comparisons, crystallography shows with NMR and SPR only one overlapping hit and all three methods shared no common hits. Does this irrationalize screening cascades?
Introduction
Fragment screening has persistently proven in the past decade to be an effective tool in finding novel hits to be starting points for subsequent lead development projects. Its success is derived from deploying compounds of low molecular weight (<300 Da) and simple chemical structures, which enable a faster screening of libraries in comparison to more complex ligands. Furthermore, despite fragment libraries having a smaller number of screening candidates in comparison to HTS libraries, the compounds are meticulously selected to display more drug‐like properties such as low lipophilicity, which produces higher quality hits. [1]
The fragment library used in this project is an in‐house initial screening library consisting of 96 structurally diverse fragments developed in collaboration with the Helmholtz Zentrum in Berlin [2] and transferred by Jena Bioscience to a commercially available screening kit. [3] The fragments were selected specifically with a potential to harbor several assorted interactions to a large scope of target proteins. The 96 fragments contain a subset of a larger 361 fragment library that was designed to study whether a library with fragments non‐adhering to the Astex rule of 3 [4] could still provide hits that could be used as starting points for lead compounds. This library was tested against endothiapepsin and more than 50 % of the resulting hits did not adhere to the rule of 3, which meant that, had the rule of 3 been applied, several fragment hits would have been missed. [5] These fragment hits, in addition to others, were then selected to compile the 96‐fragment library.
Our primary goal was to screen the library by crystallography as this method provides binding pose information, essential for follow‐up hit‐to‐lead optimization. Nevertheless, it is common for fragment‐based hit finding projects to perform screening campaigns in a cascade manner, starting with the less demanding screening methods first and apply the more time and resource‐requiring screens at a later stage.[ 6 , 7 , 8 ] In our work, we did not follow such an approach but rather screened the entire fragment library directly on protein crystals as this method recently matured substantially, particularly with respect to throughput. For curiosity and to make an unbiased comparative analysis possible, we took the same set of fragments and performed independent screenings also with NMR and SPR as the assessment of the results obtained by the three different screening methods will allow us to compare and prioritize which method to begin with, and to check the validity and advantage of a screening cascade approach.
The target we selected for our comparative analysis is tRNA guanine transglycosylase (TGT). TGT is an enzyme that plays an important role in the pathogenicity of Shigella, a gram‐negative bacterium that infects the intestine. It causes shigellosis, a world‐wide endemic with 165 million cases reported per year, including 1.1 million deaths globally, mostly in children under five years of age. [9] Shigella is dependent on virulence factors (VirF), which are required to invade epithelial cells. The expression of these virulence factors is modulated by the enzyme TGT (EC 2.4.2.29), which catalyzes an anticodon modification of tRNAs specific for Asn, Asp, His and Tyr, leading to the replacement of guanine‐34 at the wobble position by the hypermodified base preQ1. The pathway is summarized in Scheme 1 and the incorporated preQ1 is further modified by downstream enzymes to queuine. [10] As this modification is a prerequisite for the formation of Shigella virulence factors, the inhibition of TGT has a direct impact on reducing the pathogenicity of Shigella. [11] This positive correlation between VirF and TGT was demonstrated by Durand et al. 1994 [12] and Björk et al. 1995 [13] where a mutant of Shigella flexneri with an inactivated tgt gene could not invade host cells due to a reduction in translation of VirF but unchanged levels of virF mRNA. Additionally, transforming the aforementioned mutant with a plasmid containing functional Shigella tgt gene restored queuine modification in the mutant as well as exhibiting VirF expression and virulence. [14]
Scheme 1.

Schematic representation of anticodon modification of tRNA by TGT.
In this paper, we present the results of our crystallographic screen, discuss the observed binding poses in terms of novel structural features, and face the detected hits to those obtained with the same library by NMR and SPR. We will discuss the differences between the three applied screening methods, particularly with respect to the observed low overlap.
Results and Discussion
Fragment screen by X‐ray crystallography
All fragments of the 96 entry library [2] were soaked at concentrations of 100 mM into apo crystals of TGT, for an exposure time ranging between three minutes and twenty hours depending on the crystal stability in the fragment solution. For the 96 fragments, eight hits were found to bind to TGT (PDB codes: 5SW3, 5N6F, 5UTI, 5UTJ, 5V3C, 6FS0) as listed in Table 1, five of which bind to the active site and three at the surface in the crystal packing (Figure 1). The structures were successfully refined to resolutions between 1.10 Å and 1.63 Å, giving clearly defined difference electron densities for the bound fragments. Images of the individual difference densities (“omit maps”) can be found in the Supporting Information (Figure S1). The interactions of the detected fragment hits are described below, where they have been classified based on their spatial locations.
Table 1.
Chemical structures and resolutions of TGT fragment hits discovery by a direct crystallographic screening.
|
Fragment Jena ID |
PDB Code |
Chemical Structure |
Resolution Å |
Active Site Binder |
|---|---|---|---|---|
|
J14 |
6FSO |
|
1.45 |
No |
|
J41 |
5SW3 |
|
1.38 |
Yes (molecule 1) No (molecule 2) |
|
J64 |
5N6F |
|
1.11 |
Yes |
|
J72 |
5UTI |
|
1.36 |
Yes |
|
J79 |
5UTJ |
|
1.55 |
Yes |
|
J86 |
5VC |
|
1.42 |
Yes |
|
J33 |
Not deposited |
|
1.25 |
No |
|
J19 |
Not deposited |
|
1.37 |
No |
Figure 1.
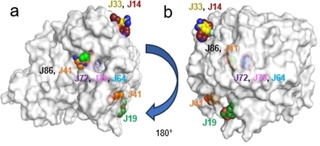
a) Overview of the spatial accommodation of the fragments detected in our crystallographic screen directly on protein crystals. Solvent accessible surface representation of TGT viewed toward the catalytic center with the discovered bound fragments in CPK representation, heteroatoms type‐coded, carbon atoms of the individual fragments displayed with the same color as the corresponding fragment labels, b) the same overview with the image rotated 180° to the left.
Fragments binding to the recognition pocket hosting the nucleobases in the catalytic reaction
As described in the Introduction, TGT catalyzes an anticodon modification of tRNAs by replacing guanine against the hypermodified base preQ1. To accomplish this exchange, the nucleobase must be recognized in a deep pocket composed of two adjacent Asp residues (Asp102, Asp156). The site is complemented by the carboxamide terminus of Gln203 and the backbone NH of Gly230. The imidazole moiety of guanine and the exocyclic amino group of preQ1 bind to the atoms of the peptide bond between Ala232 and Leu231. This peptide bond proved to be flexible and by a concerted backbone flip, it either exposed its H‐bond donor or acceptor functionality toward the bound substrate molecule. [15]
Fragment J41. Two copies of fragment J41 bind to TGT. The first molecule binds with full occupancy to the preQ1 recognition pocket where one oxygen atom of its carboxylate group forms two hydrogen bonds to the carboxamide nitrogen atom of Gln203 and backbone nitrogen atom of Gly230. The second oxygen atom of this carboxylate group forms one direct hydrogen bond to the carboxylate group of Asp156 and a second water‐mediated interaction (W137) to the other oxygen atom of the same residue. Likely, the fragment binds with its acid group in protonated state. J41 additionally forms a π‐π stacking interaction to Tyr106 (Figure 2). The binding interactions of the second molecule of J41 will be described below.
Figure 2.
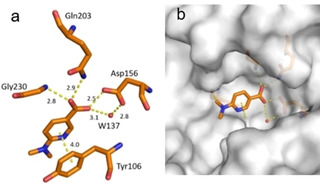
a) Binding mode of fragment J41 (PDB: 5SW3) in the preQ1 recognition pocket. Hydrogen bonds and π‐π stacking interactions are shown as yellow dotted lines, water molecules as red spheres, all distances in Å. b) Protein displayed by the gray solvent accessible surface. Residues Tyr106, Cys158, and Val159 have been omitted for image clarity.
Fragment J64. Guanine is present as a search fragment in the screened library. As a matter of fact, our screen also retrieved the natural substrate of TGT as a bound fragment hit. It binds with an occupancy of 100 % to the recognition pocket and forms two separate pairs of bidentate hydrogen bonds to the carboxylate groups of Asp156 and Asp102. To accomplish this interaction pattern, one of the two carboxylic acid groups must be assumed to be protonated. Additionally, the carbonyl group of its pyrimidine ring forms a hydrogen bond with the carboxamide nitrogen atom of Gln203 and the backbone nitrogen atom of Gly230. J64 also forms the π‐π stacking interaction with Tyr106 at a distance of 3.3 Å (not shown) (Figure 3).
Figure 3.
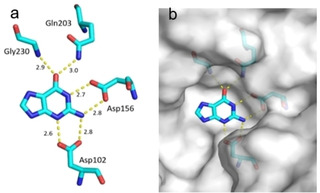
a) Binding mode of fragment J64 (PDB: 5N6F), guanine to the preQ1 pocket. Hydrogen bonds are shown as yellow dotted lines, water molecules as red spheres, all distances in Å. b) Protein displayed by the gray solvent accessible surface. Residues Tyr106 and Met109 have been omitted for image clarity.
Fragment J79. The fragment refines to an occupancy of 100 % in the preQ1 pocket where its triazole ring forms four hydrogen bonds with the enzyme; one with the backbone nitrogen atom of Gly230, one with the carboxamide nitrogen atom of Gln203, and a bidentate hydrogen bond (strong at 2.7 Å and weak at 3.8 Å) with the carboxylate oxygen atoms of Asp156. Additionally, the pyrimidinedione ring of J79 forms a hydrogen bond via its 7‐carbonyl group to the carboxamide nitrogen of Gln107. The 4‐nitrogen of J79 forms a water‐mediated interaction (W28) to the nitrogen atoms of both, Ala232 and Gly230. J79 also forms the π‐π stacking interaction with Tyr106 at a distance of 3.5 Å (data not shown) (Figure 4).
Figure 4.
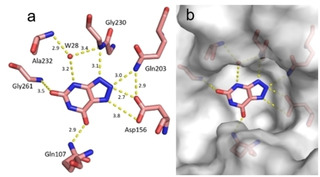
Binding mode of fragment J79 (PDB: 5UTJ) to preQ1 pocket. Hydrogen bonds are shown as yellow dotted lines, water molecules as red spheres, all distances in Å. b) Protein displayed by the gray solvent accessible surface. Residues Cys158 and Met109 have been omitted for image clarity.
Fragment J86. This fragment binds with an occupancy of 100 % to the preQ1 recognition pocket and forms a hydrogen bond to the carboxamide nitrogen atom of Gln203 and backbone nitrogen atom of Gly230 via one oxygen atom of its carboxylate group. The second oxygen atom of the acid group faces in monodentate fashion the carboxylate of Asp156. Thus, one of the facing carboxylic acid groups must be assumed to be protonated. Additionally, the terminal primary amine of J86 forms direct hydrogen bonds with the carbonyl oxygen atoms of Leu231 and Ala232, as well as a water‐mediated interaction (W120) to the carbonyl oxygen atom of Gly261 (Figure 5).
Figure 5.
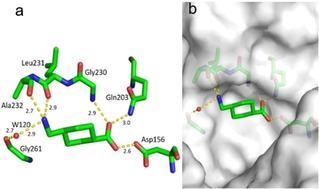
a) Binding mode of fragment J86 (PDB: 5V3C) to the preQ1 pocket. Hydrogen bonds as yellow dotted lines, water molecules as red spheres, all distances in Å. b) Protein displayed by the gray solvent accessible surface. Residues Tyr106 and Ser110 have been omitted for image clarity.
Fragment J72. This fragment, a derivative of the amino acid arginine, is amongst the most interesting fragment hits as it induces the opening of a sub‐pocket next to the preQ1 recognition site (Figure 6). This opening was previously only reported in a co‐crystallized structure of mutated variants of TGT in complex with the nucleobase queuine (PDB code 3BLO). [16] The latter substrate is related to preQ1 but comprises an attached sidechain bearing an unsaturated five‐membered carbo‐cycle (Scheme 1). The opening of the preQ1 sub‐pocket is brought on by the shifting of the Cys158 gatekeeper residue by 4 Å from its original position in the uncomplexed enzyme (Figure 7). J72 binds with full occupancy to the preQ1 recognition pocket where the fragment's guanidinium moiety forms two bidentate hydrogen‐bond interactions with the carboxylate groups of both, Asp102 and Asp156. The fragment adopts a bent, back‐folded geometry and forms with its carboxylate group a two‐membered water‐water chain (W263 and W302) that mediates a H‐bond interaction to the carboxamide nitrogen of Gln203 and two direct hydrogen bonds with the nitrogen of Gly230. The amino nitrogen of J72 forms a hydrogen bond with the amide oxygens of Leu231 and Met260. Additionally, this likely charged and protonated amino group forms a water‐mediated interaction (W80) with the amide oxygens of both Ala232 and Gly261.
Figure 6.
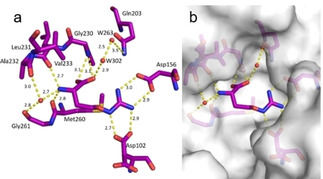
a) Binding mode of fragment J72 (PDB: 5UTI) to the preQ1 recognition pocket leading to the opening of a sub‐pocket next to the latter pocket. b) The opened pocket, filled by water molecules, is indicated, protein displayed by the gray solvent accessible surface. Hydrogen bonds are shown as yellow dotted lines, water molecules as red spheres, all distances in Å.
Figure 7.

A spatial movement of the Cys158 residue (carbons violet) by 4 Å is detected compared to the original position of this amino acid in the apo TGT structure (PDB: 1PUD, carbons pink) which indicates the opening of the sub‐pocket. Residues Tyr106 and Ser110 have been omitted for image clarity.
Fragments binding to the surface of the protein or into the interface of other crystal mates
Fragment J41. Some fragment hits bind to exposed pockets and depressions on the surface of TGT rather than to the active‐site pocket. The second molecule of fragment J41 binds with an occupancy of 100 % to the surface of TGT via its carboxylate group forming hydrogen bonds with the imidazole side chain of His133 and backbone nitrogen atom of Met134. Upon comparison with PDB codes 5N6F, 5UTI, 5UTJ, 5V3C, and 6FS0, the Arg139 side chain is always found oriented in the same position as with fragment J41. The flexibility of the Arg139 sidechain is what allows J41 to bind in its place. Additionally, J41 forms a water‐mediated interaction (W34) to the backbone nitrogen atom of Ala80 and carbonyl oxygen of Met75 (Figure 8).
Figure 8.
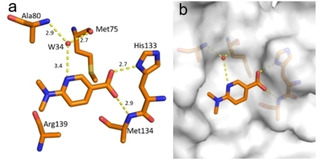
a) Fragment J41 (PDB: 5SW3) binding mode to the surface of TGT. Hydrogen bonds are shown as yellow dotted lines, water molecules as red spheres, all distances in Å. b) Protein displayed by the gray solvent accessible surface.
Fragment J14. The fragment binds at an occupancy of 100 % to the surface of TGT. The secondary and likely charged amino group of the furan moiety addresses both, the carboxamide oxygen atom of Gln213 as well as a carboxylate oxygen atom of Glu173 through hydrogen bonds (2.6, 2.7 Å). Additionally, the nitrogen atom of the pyridine moiety of J14 accepts a hydrogen bond from one nitrogen atom of the terminal Arg177 guanidinium head group (Figure 9).
Figure 9.
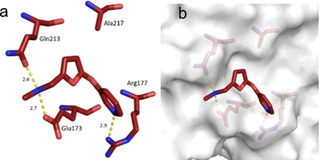
a) Binding mode of fragment J14 (PDB: 6FSO) to a surface depression of TGT where the fragment forms some polar contacts to the protein. Hydrogen bonds are shown as yellow dotted lines, all distances in Å. b) Protein displayed by the gray solvent accessible surface.
Fragment J19. This fragment binds with a refined occupancy of 56 % to the surface of TGT via a weak hydrogen bond (3.8 Å) between its benzodioxine ring and the backbone nitrogen atom of Lys85 (Figure 10a,b). Additionally, it forms two water‐mediated interactions, one by the nitrogen atom of its pyrrolidine ring via W102 to the carbonyl oxygen atom of Leu146, and a second between the pyrrolidine ring via W269 to the carbonyl oxygen atom of His145. The entire pyrrolidine moiety could not be resolved in the difference electron density (Figure 10c), therefore we refrained from depositing this partial fragment structure in the PDB. The target protein is only active as a homodimer. [17] Elaborate mutational studies showed that a cluster of four aromatic residues is important for the stability of the dimer interface. [18] Interestingly, while generating the symmetry mate to complete the dimer, it becomes obvious that although J19 does not form direct contacts with the aromatic hot spot formed by residues Trp326, Tyr330, His333 and Phe92’ from the other crystal mate, it binds to the interface of the crystallographic symmetry mate in direct contact to residues Ser188, Arg189, and Lys190, which shift by 3.3 Å, 3.8 Å, and 3.7 Å respectively in comparison to the structure of TGT in complex with J41 (PDB: 5SW3) (Figure 10d). Obviously, the fragment shifts the adjacent residues in space to create sufficient space for its accommodation. This shifting also causes the residues of the aromatic cluster to relocate by at least 3.8 Å in space compared to their positions in the interface for the unperturbed dimer (Figure 10g).
Figure 10.
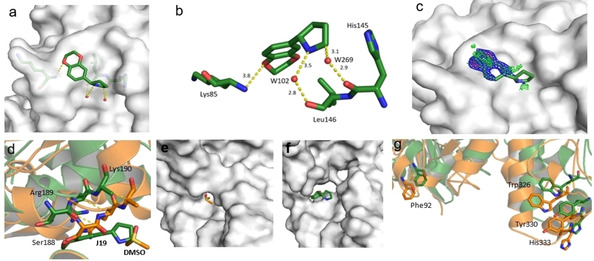
a) Binding mode of fragment J19 to the surface of TGT. b) The fragment is held in position by some weak polar interactions. c) In the refinement, the pyrrolidine moiety of J19 could not be fully resolved due to a partially defined electron density. The m|Fo|‐|D Fc| density map (green) is contoured at a sigma level of 3σ and the 2 m|Fo|‐|D Fc| density map (blue) is contoured at a sigma level of 1σ. d) Fragment J19 binds where usually a DMSO molecule can be found in other soaked crystals like the structure of TGT in complex with J41 (orange, PDB: 5SW3). When J19 binds it induces a shifting of the residues at the interface of the crystallographic symmetry mate to accommodate itself, otherwise it would clash with the residues as seen in the figure. These residues are Lys190, Arg189, and Ser188, which are shifted by 3.3 Å, 3.8 Å, and 3.7 Å respectively. e), f) This shifting can also be seen in the gap produced at this interface where without binding of the fragment the interface is continuous and after fragment binding f) the interface has gaps. g) Additionally, the residues that contribute to the aromatic hotspot at this interface are also shifted by at least 3.8 Å. In green: dimer with J19, in orange: dimer without J19. The symmetry mates are not shown.
Fragment J33. The fragment binds with a refined occupancy of 73 % to the surface of TGT via a bidentate salt bridge to Glu31’ from a neighboring crystal packing mate using its likely charged amidino function. Additionally, the p‐trifluoromethyl group forms van der Waals contacts with the methyl group of Ala217 and carbonyl oxygen atom of Gln213. The benzene ring of J33 is involved in a water‐mediated contact (W212) to the side chain of Arg177 (Figure 11).
Figure 11.
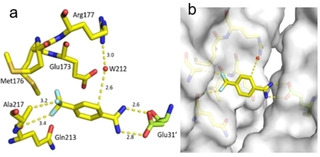
a) Binding mode of fragment J33 to the surface of TGT. b) The fragment bridges a contact between two crystal mates in the packing by interacting with Glu31’ of an adjacent TGT molecule in the packing.
This fragment was detected by running the program PanDDA (Pan‐Dataset Density Analysis),[19][20] designed to analyze multiple datasets and identify ligand binding. When checking the generated “event maps” we took notice of this fragment that otherwise could not be identified in the usual m|Fo|‐|D Fc| density map contoured at a sigma level of 3σ. This prompted us to reevaluate the structure and we could see more of the fragment when reducing the m|Fo|‐|D Fc| density map contouring to a sigma level of 2.3. After refinement was complete, the density for the fragment becomes more apparent as seen in Figure 12. The B‐factors of the refined J33 are also listed (Figure 12d).
Figure 12.
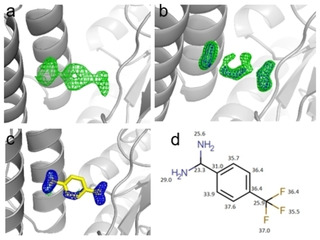
a) Event map generated by PanDDA shows electron density for J33. b). The m|Fo|‐|D Fc| density map (green) is contoured at a level of 2.3σ and the 2 m|Fo|‐|D Fc| density map (blue) is contoured at a level of 1σ. c) J33 after refinement, the m|Fo|‐|D Fc| density map (green) is contoured at a level of 3σ and the 2 m|Fo|‐|D Fc| density map (blue) is contoured at a sigma level of 1σ. d) B‐factors [Å2] of the refined J33 fragment of the non‐hydrogen atoms.
Comparison with alternative screening methods
After concluding our crystallographic fragment screen, we decided for reasons of comparison and to check the significance and reliability of a putative cascade screening strategy to evaluate the same fragment sample using SPR and NMR as primary screening methods. This was done to validate whether the two additional techniques would detect the same hits as X‐ray crystallography and to elucidate any differences between the hit rates.
Fragment screen by surface plasmon resonance (SPR)
A typical SPR‐based fragment screening workflow to prioritize binders and select the most promising hits consists of the three steps, the Clean Screen, the Binding Level Screen and the Affinity Screen. Subsequent to the affinity screen, a competition screen is performed to validate the screening hits.
Clean screen
A low molecular weight clean screen was performed to identify and exclude compounds that bind non‐specifically or show residual binding to the sensor chip matrix. It is important to remove such compounds because their residual binding can adversely affect the quality of the data of subsequent compound injections, as the biosensor surface is typically used in an iterative fashion. All 96 fragments were screened against the dextran surface of the sensor chip without any immobilized protein, and there were 15 fragments that had to be excluded due to undesirable properties and technical reasons. Their chemical structures are shown in Table S1 of the Supporting Information. Amongst these 15 excluded fragments is fragment J33, detected by PanDDA as an X‐ray hit.
Binding level screen and affinity screen
The binding level screen was performed with a total of 81 fragments at a concentration of 1 mM and the resulting response units (RUs) were double‐referenced against both, [21] the reference channel and the buffer blanks. From the binders, 10 fragments were prioritized as hits (those that had an RU below 13 were excluded, as this was the cut‐off value chosen based on binding to reference channel by the negative control). Their structures and responses are given in Table 2 below and correspond to a quite high hit rate of 12.3 %. An affinity screen with a full dose‐response was performed with the hits to estimate their binding affinity. From the resulting dose‐response curves, the dissociation constant (KD) could only be determined for J50 and amounts to 1.5 mM (± error limits, Figure 13).
Table 2.
TGT fragment hits from a binding level screen.
|
Jena Plate ID |
Fragment Chemical Structure |
RU |
|---|---|---|
|
J50 |
|
45.6 |
|
J36 |
|
21.3 |
|
J92 |
|
21.1 |
|
J09 |
|
17.3 |
|
J51 |
|
16.7 |
|
J55 |
|
15.3 |
|
J24 |
|
14.7 |
|
J07 |
|
14.3 |
|
J29 |
|
13.7 |
|
J79 |
|
13.5 |
Figure 13.

Dose‐response curve of J50. KD determined to be 1.5 mM.
Competition screen
To determine whether the fragment hits were specific active‐site binders or non‐active‐site binders, two separate competitive experiments were performed. In the first, compound 2 (Scheme 2) was measured at 40 nM in the presence and absence of the fragment hits and the responses were compared. If the response of compound 2 was attenuated in the presence of a fragment, this indicated competitive binding and hence the fragment was deemed as an active‐site binder. Likewise, if the response of compound 2 was fortified in the presence of the fragment, this indicated non‐competitive binding and hence the fragment was deemed a non‐active‐site binder. Only the binding response in presence of J50, J09, J79, and J92, whereas J50 had the strongest reduction in binding response. In the second experiment, dose‐response experiments were run in the presence of 8 nM of the potent active‐site inhibitor compound 2 [22] (SPR KD=7.7 nM). These second experiments did not include J92, J09, J51, J55, and J79 because of limited availability of material. In these experiments the binding response of J50 was reduced in the presence of the potent inhibitor used for displacement.
Scheme 2.
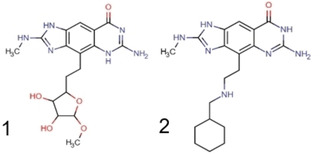
Chemical structures of reporter ligands 1: [16] 6‐amino‐4‐[2‐(3,4‐dihydroxy‐5‐methoxyoxolan‐2‐yl)ethyl]‐2‐(methylamino)‐1H,5H‐imidazo[4,5‐g]quinazolin‐8‐one and 2: [15] 6‐amino‐4‐[2‐[(cyclohexylmethyl)amino]ethyl]‐2‐(methylamino)‐1H,5H,6H,7H‐imidazo[4,5‐g]quinazolin‐8‐one.
Ligand binding by NMR
For binding studies and screening with NMR, the CPMG (Carr‐Purcell‐Meiboom‐Gill) [23] and the WaterLOGSY (Water‐Ligand Observed via Gradient SpectroscopY) [21] techniques were used. Experimental details can be found in the Materials and Methods section.
Validation of NMR setup
A binding test was performed using J50 (SPR KD=1.5 mM) as a reporter and compound 1 [24] (Scheme 2) (SPR KD=68±5 nM) as a potent inhibitor. A sample with 200 μM of the reporter compound in NMR buffer is measured first (Figure 14). Then a stepwise addition of sub‐stochiometric amounts of the TGT protein follows and further spectra are collected. Upon addition of the TGT protein, the CPMG peak of J50 is attenuated and the WaterLOGSY peak turns positive, confirming the weak binding of J50 to the TGT protein. The attenuation of the CPMG peak can be explained by the exchange between free J50 in solution and J50 bound to TGT and indicates that the exchange rate is on an intermediate time scale, compatible with the affinity obtained from SPR (c.f. above). Upon addition of a more potent competitive inhibitor such as inhibitor 2 (Scheme 2) the bound J50 is displaced from the binding site of TGT and the intensity of the J50 peak is regained. The intensity changes in the WaterLOGSY spectrum can be explained in a similar fashion. [21]
Figure 14.
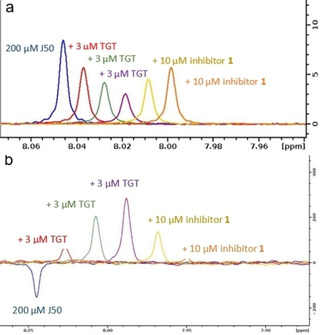
a) CPMG and b) WaterLOGSY spectra of J50 binding to TGT. The CPMG spectra in (a) show attenuation of the signal of the freely solvated J50 upon addition of TGT (red, green, violet), which is a proof of weak binding. Upon addition of inhibitor 1, an increase of the signal is detected, returning to that of the freely solvated J50, which is a proof for the displacement of J50 by the more potent inhibitor 1. The WaterLOGSY spectra (b) can be interpreted in a similar way.
Fragment solubility
To ensure that the fragments are sufficiently soluble in the NMR buffer, samples of the fragments alone without protein were prepared and tested in NMR. The recorded spectra were analyzed. Amongst the 96 fragments, 12 had very limited solubility and were therefore excluded from the NMR screen. In addition to these 12 excluded fragments, J67 showed impurity (the spectrum shows signals in the typical range of aromatic portions, however J67 is aliphatic) and J69 has only exchangeable NH protons, thus it cannot be detected by proton NMR. Considering the requirement of rather large amounts of fragment material in NMR, five fragments could not be included due to limited availability of the compounds (J35, J53, J54, J55, J57). These fragments were also excluded from the screen (Table S2 in Supporting Information). In the end only 77 of the 96 fragments remained to be screened. Amongst these 12 excluded fragments are X‐ray fragment hits J14, J64 and J79.
Binding screen
The NMR screen was performed following the same protocol as applied for the initial binding test. Fragments were studied at a concentration of 200 μM in the absence of TGT protein, and then 3 μM of TGT were added to the same sample. If attenuation of the resonance signal of the studied fragment was experienced, the fragment was considered as a potential hit. Out of 77 fragments, 22 fragments showed attenuation in their NMR signals after TGT addition (Figure 15). To confirm specific binding of these hits, 20 μM of the more potent competitive inhibitor 1 (Scheme 2) was added to the sample and a potential regain of the fragment's NMR resonance was recorded. If the fragment's signal intensity continued to become attenuated, it indicated that the fragment continued to bind in the presence of the competitive inhibitor and therefore it was classified as a non‐active site binder, and vice versa. From the 22 fragment hits, only four fragments showed a significant regain (more than 4 %) including the originally used reporter fragment J50 (Table 3). This corresponds to a hit rate of 5 %. Figure 15 shows the relative intensity of the signals after protein addition and after addition of inhibitor 1.
Figure 15.
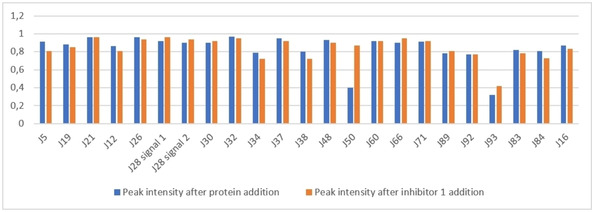
Fragments peak intensities difference after protein addition (blue) and after inhibitor 1 addition (orange)
Table 3.
Chemical structures of the fragment hits that showed active‐site binding in the NMR‐competitive experiments.
|
NMR‐Specific Hit |
Fragment Chemical Structure |
|---|---|
|
J28 |
|
|
J50 |
|
|
J66 |
|
|
J93 |
|
Before comparing the results of the SPR and NMR biophysical fragment screenings against the hits detected by X‐ray crystallography, we must consider that one obvious reason for any observed deviating hit rates originates from differences in the biophysical principles of the methods as well as their sensitivity. The concentrations by which the fragments are exposed to TGT deviate in each method. While X‐ray crystallography typically screens at very high fragment concentrations (up to 100 mM), fragment concentrations are limited in SPR and NMR where the concentrations used in SPR are limited to 2 mM due to the risk of unspecific adhesion on the dextran surface chips, and in NMR, fragments were tested at 200 μM to ensure significant binding effect (see Materials and Methods). This makes detecting of very weak binders more likely at the high concentrations applied in X‐ray crystallography. It should also be noted that the NMR binding experiment, contrary to SPR, is able to detect binding at significantly lower concentrations than KD which warrants the NMR technique being designated as a “spying technique”. However, in a recent comparative analysis performed by us, the higher hit rate obtained by crystallography is not simply explained by the fact that the additional hits were only weak binders which show up in the crystals due to the applied high concentrations, as the measured binding affinities of the hits showed strong binders as well. [25] Another obvious deviation between the applied assays may be attributed to the use of different buffers and conditions, as discussed in the following.
Overlap in hit rates of X‐ray crystallography and SPR
There is only one overlapping fragment hit, namely J79, between the crystallographic and SPR fragment screens (Figure 16a). In crystallography, J79 binds to the preQ1 pocket with an occupancy of 100 %. In SPR, the binding response of J79 was only 13.5 RU, attributing it with very low response in comparison to the other detected fragment hits. J79 was however amongst the fragments that were active‐site binders when measured in the SPR competitive experiments. Amongst these fragments were also J09, J50, and J92, which are not from the crystallographically documented hits, even after attempts to soak crystals in the same solution used for crystallization at a pH of 5.5. A possible reason for J50 not being detected by X‐ray crystallography may be the clashing of the piperidine ring of J50 with Ala232 which prevents it from binding as seen in Figure 17. This binding would require a conformational adaptation of the protein, which is feasible in solution, but the affinity might be lower in the crystal due to required conformational adaptations which are not feasible in all cases in the solid state. A similar observation has been reported before, where the affinities of several pterin derivatives discovered through virtual screening showed that a compound similar to J50 had a reduced affinity due to the unfavorable conformation the compound would need to adopt in the binding pocket. [26] In contrast, while J33 is a fragment hit in crystallography, it was among the fragments excluded from the SPR assay due to residual binding to the dextran matrix. Therefore, excluding fragments from specific screens for technical reasons, is also one explanation for missing overlap in the mutual hit rates.
Figure 16.
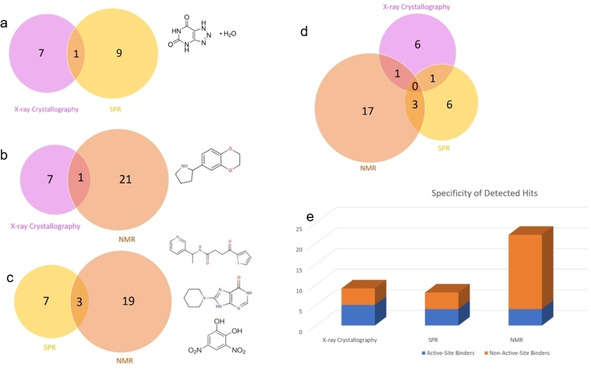
a) Overlap in hit rates between crystallography (left, magenta) and SPR (right, yellow) along with the formula of the overlapping hit J79. b) Overlap in hit rates between crystallography (left, magenta) and NMR (right, orange) and formulae of the overlapping hit J19. c) Overlap in hit rates between SPR (left, yellow) and NMR (right, orange) and formulae of the overlapping hits J24, J50, J92. d) Zero overlap in hit rates between crystallography (magenta), SPR (yellow) and NMR (orange). e) Correlation between active‐site and non‐active‐site binders as detected by the three methods.
Figure 17.
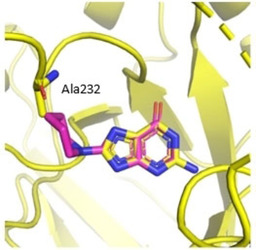
The published structure of TGT in complex with J64 (yellow, PDB: 5N6F) superimposed with one orientation of J50 (pink). The piperidine ring clashes with Ala232, demonstrating the unfavorable binding of the fragment in the binding pocket of TGT.
Overlap in hit rates of X‐ray crystallography and NMR
There is one overlapping hit between the crystallographic and the NMR‐based fragment screens, namely J19 (Figure 16b). It was picked up by the two screening methods and was confirmed as a non‐active‐site binder. J19 binds with an occupancy of 56 % to the crystal packing interface of TGT. In NMR, the difference in signal peak intensity of J19 was positive, which indicates that it continued to bind in the presence of the potent active‐site inhibitor 1. As mentioned earlier, the crystallographic fragment hits J14, J64, J79 were excluded from the NMR screening due to insufficient solubility, which compromises the possible overlap of these hits in both screening methods.
Overlap in hit rates between SPR and NMR
There are three overlapping fragment hits between the SPR and NMR fragment screens: J24, J50, and J92 (Figure 16c). Among them, J50 is confirmed by both approaches to be a specific active‐site binder. In SPR, J50 produces the highest amount of response units from all discovered hits (RU of 45.6). In NMR, it also shows the largest difference in signal intensity for the experiments after protein and after inhibitor addition (+0.48 (48 %) relative intensity). It has to be remembered that overall two SPR hits (J55 and J79) were discarded from the NMR screen and five NMR hits (J16, J21, J26, J48, J83) were never subjected to the SPR screen.
Overlap in hit rates of X‐ray crystallography relative to SPR and NMR
Upon comparison of all fragment hits, there were no overlapping fragment hits from all three methods (Figure 16d). As mentioned, several factors are responsible for this finding, at first exclusion of fragments from individual screens due to technical reasons, e. g. insufficient solubility, undesirable adhesion to sensor chip, or resolving of crystals upon soaking. In detail, four X‐ray hits (J33 and J14, J64, J79) were excluded from the SPR and NMR screens, respectively. Another factor is the physical differences seen between measuring fragments in a protein solution versus measurements in a protein crystal. As seen with J50, crystal contacts may affect fragment binding especially in the cases where a protein conformational adaption is needed. Additionally, another fragment which was detected by both SPR and NMR but not detected by X‐ray crystallography is J92, which may be a surface binder and hence its binding would also be compromised by crystal contacts. SPR and NMR also missed three active‐site binders that were detected by X‐ray crystallography namely J41, J72, J86.
Upon comparison of active‐site binders relative to non‐active site binders detected by the three methods, crystallography had the highest correlation between fragment hits detected and percentage of specific active‐site binders (Figure 16e) whereas NMR suggested a large amount of non‐active‐site binders.
Conclusions
Admittedly for technical reasons, limited solubility and reduced stock of the rare natural product fragment material, only 77 compounds could be subjected to all three assays in parallel. This reduced sample provided the basis for our comparison. SPR and NMR are currently the most commonly applied primary fragment screening techniques, [27] however, as shown by our results, they can still miss important protein binders that, at least in our example, were only discovered by the more elaborate crystallographic screen.
In summary, X‐ray crystallography allows the detection of specific binders that may be too weak binders to be detected by SPR and NMR. They would be missed if a cascade‐type screening approach would be followed with SPR or NMR as incipient test. Albeit weak, these specific binders can still provide valid structural information to support the search for appropriate starting points in lead discovery. [28] Particularly, J72 indicates the opening of a transient pocket, usually not seen with guanine‐like inhibitors. In a future study, this fragment gives us the perspective to design leads with alternative scaffolds that hopefully achieve the desired selectivity of bacterial versus eukaryotic TGTs. Additionally, SPR and NMR detected a significantly higher percentage of non‐active‐site binders relative to crystallography, which shows the importance of also running competition‐based screenings in SPR and NMR, a requirement not needed in crystallography. NMR proved to be a more sensitive method relative to SPR, as it appeared to pick up the highest numbers of putative binders to the TGT protein.
The frustratingly low overlap of hits discovered by the three methods remains puzzling, however it reflects the experience often reported by practitioners at relevant meetings. First of all, differences in the experimental setup can be a reason. Even though, we tried to keep the applied conditions rather similar, unavoidable differences will be given. The X‐ray crystallography screens were performed at much higher concentration to ensure efficient diffusion into the crystals. It must be kept in mind that crystal soaking is very tolerant if some of the ligand material is present in solid form. The more the ligand material becomes bound to the protein, the more of the solid resolves in equilibrium. In NMR, this kind of active transport cannot improve the detection threshold, and the quality of the spectral‐line width can be affected by aggregation or precipitated solid protein or ligand material. Nevertheless, NMR is the more sensitive method, crystallography only suggests ligand binding if a reasonable difference density is visible. For this the ligand has to be populated to at least 30 % and the binding mode should not be affected by high residual mobility and pronounced scatter over several binding geometries. SPR also needs turbid‐free solutions and the immobilization level and the mutual packing of the target protein on the sensor chip is crucial. This all makes comparisons with respect to concentration or sensitivity thresholds difficult. Accordingly, even assuming it would be possible to run the three methods under identical conditions, the question remains whether identical hits are to be expected? NMR is undoubtedly a solution method, where both partners float freely in buffered solution. SPR uses immobilized protein, which will take an influence on the protein dynamics and can affect access to the different binding sites. Furthermore, SPR in a flow cell is not a proper equilibrium method, perhaps steady‐state conditions under the applied flow conditions can be assumed. Crystallography definitely allows for the longest time span to approximate equilibrium conditions. However, the applied soaking requires diffusion into crystals and binding occurs in the solid state, even though the high‐water content of protein crystals makes them appear as something related to a highly concentrated solution. Nevertheless, some possibly required conformational changes, perhaps only temporarily needed to access a binding site, might be hampered in the solid state. Furthermore, it is the question whether the affinity of a ligand towards the crystallized protein is similar to that in solution or to the surface‐immobilized species. Studies on larger ligands have at least shown differences in the affinity in solution and solid state. [29] Additionally in crystallography, ligands have to pass through crystal packing channels to reach the binding site on the protein. These channels can block access, in the simplest case due to steric reason, but electrostatics or hydrophobic barriers can also hamper successful diffusion to the binding sites. As an alternative, co‐crystallization can be used as then, the binding event should be more similar to the conditions applied in NMR. However, this technique requires over and over again, successful crystallization of the formed complexes, an often not trivial endeavor as, due to the presence of the fairly concentrated fragments, the initial crystallization conditions are altered. Accordingly, it is perhaps a too optimistic view to expect highly overlapping hit rates from multiple orthogonal screening approaches. Hence, from a pragmatic point of view, fragment screening must provide starting points for further optimization, and to achieve this goal, any suitable method should be considered, however, techniques that determine an accurate binding pose certainly have an advantage.
Experimental Section
Expression and purification of the Z. mobilis TGT
The expression and purification protocol was adapted as previously described by Jakobi et al. [18] The E. coli cells BL21‐CodonPlus (DE3) ‐RIPL (Cam r), transformed with the plasmid vector pPR‐IBA2‐ZM10 (Amp r), were incubated in a pre‐culture of 100 mL LB medium containing 100 mg ⋅ L−1 ampicillin and 34 mg ⋅ L−1 chloramphenicol for 17 h at 37 °C and 220 rpm. In addition to ampicillin and chloramphenicol resistance, the plasmid contained a sequence encoding for an N‐terminal Strep‐tag II® separated from the tgt start codon by a spacer sequence and a sequence encoding a thrombin cleavage site. The pre‐culture was added to 2×2 L main culture (LB medium including 100 mg ⋅ L −1 ampicillin and 34 mg ⋅ L−1 chloramphenicol) which is incubated at 37 °C and 220 rpm until the OD 600=0.7. This main culture was then cooled to 15 °C and the protein expression induced by addition of IPTG (final concentration 1 mM). The main culture was then incubated at 15 °C and 220 rpm for a further 16–18 h. Afterwards, the cell pellets were harvested by centrifugation (10,000 rpm at 4 °C). They were subsequently re‐suspended in 100 mL lysis buffer (20 mM TRIS pH 7.8, 10 mM EDTA, 1 mM DTT and 2 cOmplete™‐Protease Inhibitor Cocktail Tablets (Roche) per 4 L of bacterial culture) and cell disruption was achieved via three rounds of sonification using a Branson Sonifier 250, with 90 seconds intervals (duty cycle 30 %, output control 7). Alternatively, cell disruption was achieved via an EmulsiFlex‐C5™ high‐pressure homogenizer (Avestin Europe GmbH). The soluble protein in the supernatant was then separated by centrifugation from the insoluble cell constituents in the pellets (centrifugation speed 19,000 rpm, 45 min, 4 °C). Purification of the protein was achieved at room temperature by two FPLC steps using an ÄKTA Purifier LC system. A Q‐Sepharose Fast Flow Anion Exchange Column (XK 26/15; GE Healthcare) was equilibrated with buffer A (10 mM TRIS pH 7.8, 1 mM EDTA, 1 mM DTT) and the clear cell lysate was passed through the column. The protein was then eluted by a buffer B containing 10 mM TRIS pH 7.8, 1 mM EDTA, 1 mM DTT, 1 M NaCl through gradient elution (a linear increase in the proportion of buffer B (from 0–100 % at 4 mL ⋅ min−1 column flow) and fractioning of the eluted portion. Fractions containing the target protein Z. mobilis TGT with the Strep tag II were determined by SDS‐PAGE. A Strep‐Tactin® Superflow® column (XK 16/10, IBA) was equilibrated with buffer W (100 mM TRIS pH 7.8, 1 M NaCl, 1 mM EDTA) and the corresponding fractions were passed through the column. The target protein was eluted by buffer E (100 mM TRIS pH 7.8, 1 M NaCl, 1 mM EDTA, 2.5 mM D‐desthiobiotin).
The fractions containing TGT protein were then concentrated in a VIVASPIN®20 centrifugal concentrator (Sartorius, MWCO=30,000) to a concentration of approximately 2 mg ⋅ mL−1 in a high salt buffer containing 10 mM TRIS pH 7.8, 2 M NaCl, 1 mM EDTA. Subsequently, the Strep‐tag® II was cleaved off and separated from the TGT protein via a Thrombin Cleavage Capture Kit (Novagen®) following the manufacturer‘s instructions where 2.5 U of biotinylated thrombin per mg TGT protein was incubated with the TGT protein for 16–18 h at 20 °C. The cleaved TGT protein was separated from the Strep‐tag® II, the biotinylated thrombin from the kit, and the streptavidin‐agarose beads by filtration using the filters of the kit. The separated TGT protein was then dialyzed against high salt buffer and concentrated via VIVASPIN®20 centrifugal concentrator until a final protein concentration of 12 mg ⋅ mL−1. Finally, the protein was flash frozen into aliquots of 70 μL and stored at −80 °C.
Crystallization and structure refinement of Z. mobilis TGT
Z. mobilis TGT apo crystals were grown at 18 °C using the sitting‐drop and hanging‐drop vapor diffusion methods. 1.5 μL of 12 mg ⋅ mL−1 were mixed with 1.5 μL of reservoir solution containing 100 mM MES pH 5.5, 1 mM DTT, 13 % (w/v) PEG8000, 10 % (v/v) DMSO in the wells of a crystallization plate containing 650 μL reservoir solution. Crystals could be seen within three days. Crystals were soaked into a solution containing 100 mM of fragment solution (dissolved in 100 % DMSO), 17.5 % PEG3350, 25 % PEG400, 200 mM NaCl, pH 7, for a time ranging between 3 minutes and 20 hours depending on crystal stability to the fragment solution. Crystals did not need a cryo‐buffer as the amount of PEG was sufficient, so they were directly flash‐frozen in liquid nitrogen. Data collection and refinement statistics are shown in Supporting Information (Tables S3–S4). The diffraction data were indexed, scaled, and merged using XDS [30] and XDSAPP. [31] Molecular replacement from the program PHASER MR [32] from the CCP4 suite [33] was used to determine all crystal structures. The structure 4LBU was used as a search model. In the refinement, a 5 % subset of all reflections was omitted during refinement to be used for Rfree calculation. Model building was achieved in COOT [34] and refinement using PHENIX.refine version 1.10.1‐2155. [35] Cartesian simulated annealing with default parameters was used as a first refinement step for all the structures. This was followed by refinement of XYZ coordinates and occupancies of protein residues and fragments (with the exception of water molecules whose occupancies were fixed). In the case of protein residues that gave additional density, they were refined in double conformation and kept if their refined occupancy was≥20 %. The structure of TGT in complex with J14 (PDB: 6FSO) was refined isotropically with 6 TLS groups. The structures of TGT in complex with J41 (PDB: 5SW3), TGT in complex with J72 (PDB: 5UTI), TGT in complex with J79 (PDB: 5UTJ), and TGT in complex with J86 (PDB: 5V3C) were all refined anisotropically except for water molecules. The structure of TGT in complex with J64 (PDB: 5N6F) was refined anisotropically. Hydrogen atoms were added to the refined structures in the last refinement step in PHENIX.refine. For two of the structures; TGT in complex with J19 and TGT in complex with J33, the resulting m|Fo|‐|D Fc| density maps could not identify the fragments. Only after observing the event maps created by PanDDA (Pan‐Dataset Density Analysis) could the fragments be identified. As these two structures do not meet the criteria for PDB depositions, they were not deposited. For the structure of TGT in complex with J79 (PDB: 5UTJ) the average B‐factor of the ligand remains high despite refining occupancy to 100 %. Chemicalize [36] developed by ChemAxon [37] was used for name‐to‐structure generation and SMILES code notation. The ligand PDB and restraint files were generated with the Grade Web Server. [38]
Applied buffers for the screening experiments
The conditions applied in the experiments were all close to neutral pH (pH 7 in soaking, HEPES and dTris buffers pH of 7.4 in SPR and NMR, respectively). TCEP is used in SPR and NMR as a reducing agent to prevent the formation of disulfide bridges in protein‐protein interfaces. During crystal growths, TCEP was also added to the crystallization condition. Since soaking involves the use of pre‐formed apo crystals, TCEP was not present in the soaking solutions. All screening conditions had high salt concentration. In SPR, the salt concentration is important to prevent non‐specific binding to the dextran surface in the reference channels [39] while in NMR, this salt concentration is important to prevent nonspecific binding through non‐specific ionic interactions. [40] A notable difference between the screening buffers is the concentration of DMSO. The soaking conditions had a concentration of 10 % DMSO, in comparison to 1 % DMSO in SPR and 0.2 % in NMR. Higher DMSO concentrations will enhance fragment solubility and reduces the risk of precipitation. The applied SPR conditions require 0.05 % Tween, which the soaking conditions did not contain. This may bring about a similar effect, even though Tween and DMSO unlikely function in the same way. While DMSO is used as co‐solvent to enhance compound solubility, Tween is used to reduce compound aggregation. [41] The fact that the NMR buffer did not contain a high percentage of DMSO explains why several fragments had to be excluded from the screen for limited solubility. PEG is used in the soaking conditions as a cryo‐protectant, it is neither used in the SPR nor NMR screening buffers. Despite PEG being noninvasive and thus less likely to interact within the interior of protein crystals,[42][43] it can still be found in some structures if the soaking conditions apply PEG in high concentration and PEG molecules have suitable size. The drawback of this is that a PEG molecule may even bind in the position where a fragment could accommodate, thus interfering with ligand binding. We found such a displacement of small PEG molecules in a study using crystals of endothiapepsin. [44] Fragments need a certain potency to displace the PEGs. EDTA is a chelating agent added to coordinate metal ions. In SPR and crystallography it is not necessary to add EDTA but in NMR it is primarily added to chelate paramagnetic impurities. [45] The sodium salt of trimethylsilylpropanoic acid deuterated in the propionic part (TMSP‐d4) is used as internal NMR reference. It contains nine equivalent methyl hydrogens and therefore its 1H NMR spectrum consists of a sharp singlet which is set as chemical shift of 0 ppm. As most compounds studied by 1H NMR spectroscopy show resonances downfield of the TMSP signal (especially organic compounds), there is usually no overlap with the signals of the samples.
SPR conditions
The SPR studies have been performed at 20 °C using a BIAcore 3000 instrument for the clean screen, and a BIAcore T200 instrument for the fragment screen. The Z. mobilis TGT was immobilized via amine coupling to a dextran sensor chip at a pH of 5.5. For the BIAcore 3000 experiments, a Xantec CMD 500 L sensor chip was used and for the BIAcore T200 experiments a BIAcore CM7 sensor chip was used. The functional groups of the Xantec CMD 500 L chip surface were first activated by injecting for 10 min at 10 μL/min with a 1 : 1 mixture of 0.5 M 1‐Ethyl‐3‐(3‐dimethylaminopropyl) carbodiimide hydrochloride (EDC) and 0.5 M N‐hydroxysuccinimide (NHS), immediately followed by injecting the TGT protein for 7 min at a flow rate of 10 μL/min to 2623 RU. Remaining activated carboxyl groups on the surface were blocked with 4×1.5 min pulses of 0.5 M ethanolamine. Immobilization levels achieved on the CM7 sensor chip were 9400 RU for the fragment screen. The running buffer used for the immobilization was 10 mM HEPES buffer pH 7.4, 0.05 % Tween 20, 150 mM NaCl, 1 mM TCEP, 1 % DMSO.
Before the final immobilization of the protein, a pH scouting was performed to find the appropriate pH conditions for TGT coupling onto the surface (the pH of the buffer in which the protein will be diluted). The running buffer used for pH scouting was 10 mM HEPES buffer pH 7.4, 0.05 % Tween 20, 150 mM NaCl, 1 mM TCEP, 1 % DMSO. To find the appropriate pH for TGT immobilization, the pI of the protein was considered. The selected pH must be below the TGT pI of 6.3 but above the pKa values of 3.5 of the carboxylates in the dextran matrix. A 50 μg ⋅ mL−1 stock solution of TGT was prepared in buffers of 10 mM sodium acetate at various pH values of 5.5, 5.0, 4.5, and 4.0, respectively. The protein samples in different buffers were injected onto the activated sensor chip surface separately in 20 μL volumes at a flow rate of 10 μL ⋅ min −1. Before each injection the sensor chip was preconditioned with a solution of 50 mM NaOH and 1 M NaCl at 10 μL ⋅ min−1 for 2 minutes. The corresponding curves and response values were monitored and the suitable pH of 5.5 was selected. A tool compound is used to test the correct immobilization of a protein to the sensor chip, and to also test the protein activity after consecutive uses of the sensor chip. A tool compound should have a known binding affinity that gives a measurable response on the sensorgram. Inhibitor 1 with a KD of 68±5 nM was used as the tool compound.
Clean screen
A clean screen with the fragments alone in the running buffer without protein was done to exclude the problematic fragments from the binding level screen. For this clean screen, the fragments were prepared in a 96‐well plate in 2 mM concentrations by diluting them in the running buffer. The running buffer was 10 mM HEPES, pH 7.4, 0.05 % Tween 20, 150 mM NaCl, 1 mM TCEP, and 1 % DMSO. The plates were spun down, and half of the volume was transferred into a new plate and diluted again 1 : 1 with the running buffer to give a final fragment concentration of 1 mM. The fragments were then passed over the CMD 500 L sensor chip at a flow rate of 20 μL/min for 1.5 min. To remove compounds from the biosensor surfaces, the flow channels were regenerated by a 90 s pulse of 0.5 % SDS. Fragments with irregular curves (very slow dissociation rate, jump in RU) were excluded from the fragment screening.
Binding level screen (fragment screen)
The fragments were screened at 1 mM concentrations, in a fragment binding level screen, and a standard solvent correction procedure was performed to correct for potential deviations in DMSO concentration between samples and running buffer. The running buffer used was 10 mM HEPES, pH 7.4, 0.05 % Tween 20, 150 mM NaCl, 1 mM TCEP, and 1 % DMSO. To remove compounds from the biosensor surfaces the flow channels were regenerated after each cycle with 50 % DMSO (a 1 : 1 dilution of running buffer and DMSO).
Affinity screen (determining binding kinetics)
For fragments, the affinity screen was done using 9 different concentrations and 3 blanks as follows: 0 μM, 0 μM, 0 μM, 20 μM, 35.6 μM, 63.2 μM, 112 μM, 200 μM, 356 μM, 632 μM, 1125 μM, 2000 μM. The running buffer used was 10 mM HEPES buffer pH 7.4, 0.1 % Tween 20, 250 mM NaCl, 1 mM TCEP, and 2 % DMSO.
NMR conditions
NMR experiments for fragment screening were performed at 25 °C using a Bruker Avance Neo 600 MHz spectrometer equipped with a cryogenically cooled probe‐head. Automatic sample changing was accomplished with a Bruker SampleJet system. For the initial validation experiments (Figure 2) a Bruker Avance III HD 800 MHz spectrometer equipped with a cryogenically cooled probe‐head, was used. NMR samples contained 200 μM fragment in aqueous buffer with 20 mM deuterated TRIS at pH 7.4, 1 mM EDTA, 150 mM NaCl, 10 % (vol/vol) D2O, 3 mM TCEP and 10 μM TMSP‐d11. A TECAN EVO 100 liquid handling robot was used to fill 5 mm O.D (outer tube diameter) NMR tubes in a SampleJet rack. The interscan delay was 3 s and 64 scans were accumulated. Solvent suppression was accomplished with an excitation sculpting scheme [46] using 2 ms sinc shape flip back pulses. In the CPMG experiment the DMSO peak was suppressed by off resonance irradiation during the interscan delay. For each compound the binding experiment was run in two or three steps. First CPMG and water‐LOGSY experiments were run on a sample containing the ligand alone to check solubility and integrity. Once the structure was confirmed from matching the spectra peaks to the predicted fragment peaks in the ACD/Labs software, 3 μM protein was added to check binding. For the samples with fragments that did bind, 10 μM of a potent inhibitor, inhibitor 1 (SPR Kd of 68±5 nM), was gradually added to the samples and a third set of NMR experiment were recorded. Inhibitor 1 binds to the active site and can therefore be used to identify specific active site binders. Spectra were processed and analyzed with TopSpin®.
Supporting information
As a service to our authors and readers, this journal provides supporting information supplied by the authors. Such materials are peer reviewed and may be re‐organized for online delivery, but are not copy‐edited or typeset. Technical support issues arising from supporting information (other than missing files) should be addressed to the authors.
Supplementary
Acknowledgements
The presented work was funded from the European Union's Framework Programme for Research and Innovation Horizon 2020 (2014‐2020) under the Marie Skłodowska‐Curie Grant Agreement No. 675555, Accelerated Early staGe drug discovery (AEGIS). We thank the Helmholtz‐Zentrum Berlin for the allocation of synchrotron radiation beamtime and travel support. We also thank Trieste for beamtime and beamline support at ELETTRA beamline 5.2R.
E. Hassaan, P.-O. Eriksson, S. Geschwindner, A. Heine, G. Klebe, ChemMedChem 2020, 15, 324.
References
- 1. Joseph-McCarthy D., Campbell A. J., Kern G., Moustakas D., J. Chem. Inf. Model. 2014, 54, 693–704. [DOI] [PubMed] [Google Scholar]
- 2.F. U. Huschmann, J. Linnik, K. Sparta, M. Uehlein, X. Wang, A. Metz, J. Schiebel, A. Heine, G. Klebe, M. S. Weiss, U. Mueller, Acta Crystallogr., Sect. F: Struct. Biol. Commun 2016, 72, 346–355. [DOI] [PMC free article] [PubMed]
- 3.https://www.jenabioscience.com/crystallography-cryo-em/screening/fragment-screen.
- 4. Congreve M., Carr R., Murray C., Jhoti H., Drug Discovery Today 2003, 8, 876–7. [DOI] [PubMed] [Google Scholar]
- 5. Koester H., Craan T., Brass S., Herhaus C., Zentgraf M., Neumann L., Heine A., Klebe G., J. Med. Chem. 2011, 54, 7784–7796. [DOI] [PubMed] [Google Scholar]
- 6. Silvestre H. L., Blundell T. L., Abell C., Ciulli A., Proc. Natl. Acad. Sci. USA 2013, 110, 12984–12989. [DOI] [PMC free article] [PubMed] [Google Scholar]
- 7. Scott D. E., Coyne A. G., Hudson S. A., Abell C., Biochemistry 2012, 51, 4990–5003. [DOI] [PubMed] [Google Scholar]
- 8. Mashalidis E. H., Śledź P., Lang S., Abell C., Nat. Protoc. 2013, 8, 2309–2324. [DOI] [PubMed] [Google Scholar]
- 9. Christopher P. R., David K. V., John S. M., Sankarapandian V., Cochrane Database Syst. Rev. 2010, 8, 1–102. [DOI] [PMC free article] [PubMed] [Google Scholar]
- 10. Romier C., Reuter K., Suck D., Ficner R., EMBO J. 1996, 15, 2850–2857. [PMC free article] [PubMed] [Google Scholar]
- 11. Graedler U., Gerber H.-D., Goodenough-Lashua D. M., Garcia G. A., Ficner R., Reuter K., Stubbs M. T., Klebe G., J. Mol. Biol. 2001, 306, 455–467. [DOI] [PubMed] [Google Scholar]
- 12. Durand J. M., Okada N., Tobe T., Watarai M., Fukuda I., Suzuki T., Nakata N., Komatsu K., Yoshikawa M., Sasakawa C., J. Bacteriol. 1994, 4627–4634. [DOI] [PMC free article] [PubMed] [Google Scholar]
- 13. Bjoerk G. R., Prog. Nucleic Acid Res. Mol. Biol. 1995, 50, 263–338. [DOI] [PubMed] [Google Scholar]
- 14. Hurt J. K., Olgen S., Garcia G. A., Nucleic Acids Res. 2007, 35, 4905–4913. [DOI] [PMC free article] [PubMed] [Google Scholar]
- 15. Tidten N., Stengl B., Heine A., Garcia G. A., Klebe G., Reuter K., J. Mol. Biol. 2007, 374, 764–776. [DOI] [PMC free article] [PubMed] [Google Scholar]
- 16. Biela I., Tidten-Luksch N., Immekus F., Glinca S., Nguyen T. X. P., Gerber H.-D., Heine A., Klebe G., Reuter K., PLoS One 2013, 8, e64240. [DOI] [PMC free article] [PubMed] [Google Scholar]
- 17. Ritschel T., Atmanene C., Reuter K., Van Dorsselaer A., Sanglier-Cianferani S., Klebe G., J. Mol. Biol. 2009, 393, 833–847. [DOI] [PubMed] [Google Scholar]
- 18. Jakobi S., Nguyen P. T. X., Debaene F., Cianférani S., Reuter K., Klebe G., ACS Chem. Biol. 2015, 10, 1897–1907. [DOI] [PubMed] [Google Scholar]
- 19. Pearce N. M., Krojer T., von Delft F., Acta Crystallogr. Sect. D 2017, 73, 256–266. [DOI] [PMC free article] [PubMed] [Google Scholar]
- 20. Pearce N. M., Krojer T., Bradley A. R., Collins P., Nowak R. P., Talon R., Marsden B. D., Kelm S., Shi J., Deane C. M., von Delft F., Nat. Commun. 2017, 8, 15123. [DOI] [PMC free article] [PubMed] [Google Scholar]
- 21. Schiebel J., Radeva N., Koester H., Metz A., Krotzky T., Kuhnert M., Diederich W. E., Heine A., Neumann L., Atmanene C., Roecklin D., Vivat-Hannah V., Renaud J. P., Meinecke R., Schlinck N., Sitte A., Popp F., Zeeb M., Klebe G., ChemMedChem 2015, 10, 1511–1521. [DOI] [PubMed] [Google Scholar]
- 22. Myszka D. G., J. Mol. Recognit. 1999, 12, 279–284. [DOI] [PubMed] [Google Scholar]
- 23. Barandun L. J., Immekus F., Kohler P. C., Ritschel T., Heine A., Orlando P., Klebe G., Diederich F., Acta Crystallogr. Sect. D 2013, 69, 1798–1807. [DOI] [PubMed] [Google Scholar]
- 24. Meiboom S., Gill D., Rev. Sci. Instrum. 1958, 29, 688–691. [Google Scholar]
- 25. Ehrmann F. R., Stojko J., Metz A., Debaene F., Barandun L. J., Heine A., Diederich F., Cianférani S., Reuter K., Klebe G., PLoS One 2017, 12, e0175723. [DOI] [PMC free article] [PubMed] [Google Scholar]
- 26.R. Benk, Virtuelles Screening, Strukturbasiertes Design und Kristallstrukturanalyse von Inhibitoren der tRNA-Guanin Transglykosylase, Ein Target der Bakterienruhr, Philipps-Universitaet Marburg, 2002.
- 27. Davis B. J., Erlanson D. A., Bioorg. Med. Chem. Lett. 2013, 23, 2844–2852. [DOI] [PubMed] [Google Scholar]
- 28. Murray C. W., Verdonk M. L., Rees D. C., Trends Pharmacol. Sci. 2012, 33, 224–232. [DOI] [PubMed] [Google Scholar]
- 29. Cousido-Siah A., Petrova T., Hazemann I., Mitschler A., Ruiz F. X., Howard E., Ginell S., Atmanene C., Van Dorsselaer A., Sanglier-Cianferani S., Joachimiak A., Podjarny, Proteins 2012, 80, 2552–2561. [DOI] [PMC free article] [PubMed] [Google Scholar]
- 30. Kapsch W., Acta Crystallogr., Sect. D: Biol. Crystallogr. 2010, 66, 125–132. [DOI] [PMC free article] [PubMed] [Google Scholar]
- 31. Krug M., Weiss M. S., Heinemann U., Mueller U., J. Appl. Crystallogr. 2012, 45, 568–572. [Google Scholar]
- 32. McCoy A. J., Grosse-Kunstleve R. W., Adams P. D., Winn M. D., Storoni L. C., Read R. J., J. Appl. Crystallogr. 2007, 40, 658–674. [DOI] [PMC free article] [PubMed] [Google Scholar]
- 33.Collaborative Computational Project, Number 4, Acta Crystallogr., Sect. D: Biol. Crystallogr 1994, 50, 760–763.
- 34. Emsley P., Cowtan K., Acta Crystallogr. Sect. D 2004, 60, 2126–2132. [DOI] [PubMed] [Google Scholar]
- 35. Adams P. D., Afonine P. V., Bunkóczi G., Chen V. B., Davis I. W., Echols N., Headd J. J., Hung L.-W., Kapral G. J., Grosse-Kunstleve R. W., McCoy A. J., Moriarty N. W., Oeffner R., Read R. J., Richardson D. C., Richardson J. S., Terwilliger T. C., Zwart P. H., Acta Crystallogr. Sect. D 2010, 66, 213–221. [DOI] [PMC free article] [PubMed] [Google Scholar]
- 36.https://chemicalize.com.
- 37.http://www.chemaxon.com.
- 38.O. S. Smart, T. O. Womack, A. Sharff, C. Flensburg, P. Keller, W. Paciorek, C. Vonrhein, G. Bricogne (2011) grade, version v1.103. http://www.globalphasing.com. [DOI] [PMC free article] [PubMed]
- 39.https://www.nicoyalife.com.
- 40. Staahlberg J., Joensson B., Horvath C., Anal. Chem. 1991, 63, 1867–1874. [DOI] [PubMed] [Google Scholar]
- 41. Feng B. Y., Shoichet B. K., Nat. Protoc. 2006, 1, 550–553. [DOI] [PMC free article] [PubMed] [Google Scholar]
- 42. Roberts S. M., Davies G. J., Methods Enzymol. 2012, 141–168. [DOI] [PubMed] [Google Scholar]
- 43. McPherson A., Gavira J. A., Acta Crystallogr. Sect. F 2014, 70, 2–20. [DOI] [PMC free article] [PubMed] [Google Scholar]
- 44. Radeva N., Krimmer S. G., Stieler M., Fu K., Wang X., Ehrmann F. R., Metz A., Huschmann F. U., Weiss M. S., Mueller U., Schiebel J., Heine A., Klebe G., J. Med. Chem. 2016, 59, 7561–7575. [DOI] [PubMed] [Google Scholar]
- 45. Bertini I., Turano P., Vila A. J., Chem. Rev. 1993, 93, 2833–2932. [Google Scholar]
- 46. Hwang T-L., Shaka A. J., J. Magn. Reson. 1995, 112, 275–279. [Google Scholar]
Associated Data
This section collects any data citations, data availability statements, or supplementary materials included in this article.
Supplementary Materials
As a service to our authors and readers, this journal provides supporting information supplied by the authors. Such materials are peer reviewed and may be re‐organized for online delivery, but are not copy‐edited or typeset. Technical support issues arising from supporting information (other than missing files) should be addressed to the authors.
Supplementary


