

Abstract
Background and Aims
When measuring inequalities in health, public health and addiction research has tended to focus on differences in average life‐span between socio‐economic groups. This does not account for the extent to which age of death varies between individuals within socio‐economic groups or whether this variation differs between groups. This study assesses (1) socio‐economic inequalities in both average life‐span and variation in age at death, (2) the extent to which these inequalities can be attributed to alcohol‐specific causes (i.e. those attributable only to alcohol) and (3) how this contribution has changed over time.
Design
Cause‐deleted life table analysis of national mortality records.
Setting
England and Wales, 2001–16.
Cases
All‐cause and alcohol‐specific deaths for all adults aged 18+, stratified by sex, age and quintiles of the index of multiple deprivation (IMD).
Measurements
Life expectancy at age 18 yearss and standard deviation in age at death within IMD quintiles and the contribution of alcohol to overall differences in both measures between the highest and lowest IMD quintiles by comparing observed and cause‐deleted inequality ‘gaps’.
Findings
In 2016, alcohol‐specific causes reduced life expectancy for men and women by 0.26 and 0.14 years, respectively, and increased the standard deviation in age at death. These causes also increased the inequality gap in life expectancy by 0.33 years for men and 0.17 years for women, and variation in age at death by 0.14 years and 0.13 years, respectively. For both measures, the contribution of alcohol to mortality inequalities rose after 2001 and subsequently fell back. For women, alcohol accounted for 3.6% of inequality in age at death and 6.0% of life‐span uncertainty, suggesting that using only the former may underestimate alcohol‐induced inequalities. There was no comparable difference for men.
Conclusions
Deaths from alcohol‐specific causes increase inequalities in both life expectancy and variation in age of death between socio‐economic groups. Using both measures can provide a fuller picture of overall inequalities in health.
Keywords: Alcohol, demography, inequalities, life expectancy, life‐span variation, mortality
Introduction
Alcohol consumption has been established as a causal risk factor for more than 60 health conditions [1] and is estimated to be responsible for the loss of over 1000 years of life for every 100 000 years lived world‐wide [2]. Many studies throughout a wide range of countries and contexts have identified substantial socio‐economic gradients in health between the most educated and affluent in society and their less well‐off counterparts [3, 4, 5, 6]. Similar gradients have been observed for alcohol‐related health conditions [7, 8, 9, 10, 11], with some evidence that alcohol‐related inequalities may be wider than those from other causes [12], suggesting that alcohol is exacerbating broader societal inequality.
A key aspect of these socio‐economic inequalities in health is the relationship between socio‐economic position and length of life. There are two primary ways to quantify this relationship. The first is to look at between‐group variation in life‐span, i.e. the difference in life expectancy between low and high socio‐economic groups. This is the prevailing paradigm in public health and addiction research. The second approach is to look at differences in within‐group variation in life‐span between groups, i.e. to assess and compare the standard deviation in age at death in low and high socio‐economic groups [13]. This measure, often called ‘life‐span inequality’, can be viewed as a measure of the uncertainty faced by an individual within a given subgroup of the population in their own length of life. This latter measure has been the subject of much research in the field of demography (e.g. [4, 13, 14, 15, 16, 17]), and is also closely linked to debates in health economics about whether only the expected (i.e. average) effect of an intervention in the population should be considered, or whether the extent to which the actual impacts on health will vary between individuals (i.e. whether one differentiates between an intervention which improves everyone's health a little and one which improves the health of a small number of people a great deal) should also be considered [18].
Measures of life expectancy and variation in age of death have been shown to be correlated; however, several studies have demonstrated that significant variation in life‐span inequality may exist where differences in life expectancies are minimal (e.g. between countries [15, 17] and between socio‐economic groups within countries [13]). These inequalities are a concern from the perspective of public health for several reasons. At the individual level, greater uncertainty concerning one's remaining life‐span may have a negative impact on long‐term decisions around financial planning, which have important implications for health, particularly in older age [19, 20]. This uncertainty may also foster a sense of powerlessness over one's health, leading to increased levels of unhealthy behaviours such as smoking and drinking [4]. These concerns are not just hypothetical—it has been demonstrated that lower education levels are associated with greater uncertainty in individual estimates of remaining life‐span [21]. At a societal level, understanding variation in length of life is critical for the purposes of planning provision of health and social care services, and greater inequalities in life‐span between individuals may indicate a failure of health and social protection policies designed to protect the young and most vulnerable in society [4, 14]. It may also point to additional, within‐group inequalities that require attention.
Improvements in life expectancy require mortality rates to fall at any age, while desirable reductions in variation of age at death require mortality rates to fall faster at younger, rather than older, ages, leading to a narrowing of the distribution of ages at death. As a result, efforts to reduce life‐span inequality require particular attention to the causes of death at younger ages [22]. Deaths from alcohol‐specific causes (those which are wholly attributable to alcohol consumption, such as alcoholic liver disease, excluding partially alcohol‐attributable conditions such as cardiovascular disease or cancer) typically occur at relatively young ages and are markedly more prevalent among lower socio‐economic groups [23]. As a result, studies which have looked only at the impact of alcohol on inequalities in life expectancy may be underestimating the true contribution of alcohol‐attributable harm to socio‐economic inequalities in health.
This paper therefore focuses on the impact of alcohol‐specific causes on mortality to both assess their impact on socio‐economic inequalities in health and to illustrate the value of considering both within‐ and between‐group measures of inequality together. We use mortality record data for England and Wales for the period 2001–16 to calculate:
the ‘gap’ in both life expectancy and life‐span variation between highest and lowest socio‐economic groups;
the proportion of this gap which can be attributed to alcohol‐specific causes; and
how both these figures have changed between 2001 and 2016.
Methods
Data
Mortality data for England and Wales for the period from 2001 to 2016 were obtained from the Office for National Statistics (ONS). These data comprised the count of cause‐specific deaths and estimates of the total population size by single year of age, sex and quintile of index of multiple deprivation (IMD), a composite, area‐level measure which is the UK government's preferred measure of socio‐economic inequality [24]. For our analysis we considered two primary outcomes: all‐cause mortality and alcohol‐specific mortality. This latter measure includes only deaths from causes which are wholly attributable to alcohol (i.e. those causes from which there would be no deaths if the entire population abstained from drinking), as listed in Table 1, henceforth referred to as ‘alcohol‐specific causes’. During the period from 2001–2016, these causes accounted for 1.3% of all deaths among 18–89‐year‐olds. This definition aligns with that used by the ONS, which was revised in 2017 [25]. The revised ONS definition excludes unspecified hepatitis and fibrosis and cirrhosis of the liver (ICD‐10 codes K73, K74.0‐K74.2 and K74.6), which accounted for 27 425 deaths in England and Wales from 2001 to 2016. Approximately half of deaths from these causes are attributable to alcohol, but are nonetheless recorded as of unspecified aetiology [26]. This is important for our analysis, as there may be changes over time in the extent to which liver diseases have been explicitly recorded as being alcohol‐related; for example, due to issues of stigma surrounding alcohol [27]. Therefore, we explore the impact of including deaths from these causes in a sensitivity analysis. Due to the small number of deaths from alcohol‐specific conditions at ages 90+ data in this age group were not available, and our analysis therefore focuses on adults aged 18–89 years. In order to facilitate future comparisons with other countries, results including ages 0–17 are provided in the Supporting information.
Table 1.
List of included alcohol‐specific health conditions.
| ICD‐10 code | Condition | Total number of deaths recorded 2001–16 (ages 18–89) |
|---|---|---|
| Alcohol‐specific causes | ||
| F10.0 | Acute intoxication | 1194 |
| F10.1–F10.9 | Mental and behavioural disorders due to use of alcohol | 7130 |
| G31.2 | Degeneration | 154 |
| G62.1 | Alcoholic polyneuropathy | 5 |
| G72.1 | Alcoholic myopathy | 8 |
| I42.6 | Alcoholic cardiomyopathy | 1533 |
| K29.2 | Alcoholic gastritis | 81 |
| K70.0–K70.4, K70.9 | Alcoholic liver disease | 69 455 |
| K85.2 | Acute pancreatitis (alcohol‐induced) | 357 |
| K86.0 | Chronic pancreatitis (alcohol‐induced) | 520 |
| X45, X65, Y15 | Alcohol poisoning | 3904 |
| All alcohol‐specific causes | 84 341 | |
| All other causes | 6 510 926 | |
Analytical approach
First, for both sexes, IMD quintile, year and year of age, we calculated alcohol‐specific (mAlc), all other cause (mOth) and overall (m) mortality rates. These overall mortality rates were then converted into annual probabilities of death (q) and used to construct life tables using the standard demographic approach [28]. From these we derived two key measures, as follows.
-
1
Remaining life expectancy at age 18 up to age 90 (e(18 ∣ 90)) calculated by:
where li represents the proportion of individuals surviving to age i. The exclusion of ages 90+ from the calculations means that quantity this has an upper bound of 72 and is sometimes referred to as ‘temporary life expectancy between 18 and 90’.
-
2
Within‐group life‐span variation, measured as the standard deviation in age at death between ages 18 and 90 (S(18| 90)) as follows:
where mi represents the mortality rate at age i.As S(18| 90) is a measure of the dispersion of the distribution of ages at death, higher values represent a greater number of deaths at young (or very old) ages. A reduction over time in this measure represents a compression of the distribution of age of death (i.e. a reduction in the within‐group inequality in life‐span and thus the uncertainty around age at death). Our choice of age 18 as the lower bound for this analysis is motivated primarily by the fact that this is the legal drinking age in England and Wales. The impact of this choice is expected to be minimal, as deaths from alcohol‐specific causes below this age are extremely rare (14 in total for 2001–16).
Next, we generated life tables for both sexes and IMD quintile for a counterfactual scenario in which there are no deaths from alcohol‐specific causes, using Chiang's approach [28, 29]. This method enables the estimation of a ‘cause‐deleted’ life table (i.e. one where deaths from alcohol‐specific causes are removed) by adjusting the annual probabilities of death as follows:
where π represents the proportion of all deaths which were from alcohol‐specific causes. From this alternative life table we calculate life expectancy at age 18 (e(18| 90)†) and standard deviation in age at death (S(18| 90)†) in the absence of alcohol‐specific deaths. We can then derive the impact of alcohol‐specific causes on remaining life expectancy at age 18 as ∆eAlc = e(18| 90) − e(18| 90)† and on standard deviation in age at death as ∆SAlc = S(18| 90) − S(18| 90)†.
Finally, we estimate the contribution of alcohol towards socio‐economic gradients in both life expectancy and standard deviation in age at death. First, we calculate the ‘gap’ between the least (Q1) and most deprived (Q5) IMD quintiles on each measure as gape = e(18| 90)Q1 − e(18| 90)Q5 and gapS = S(18| 90)Q1 − S(18| 90)Q5, respectively, with gape† and gapS† defined similarly. Secondly we calculate the contribution of alcohol to these gaps as and . The final step is then to calculate the proportional contributions of alcohol, defined as and .
All analyses were undertaken and data visualizations created using R statistical software [30]. The analytical code can be found at: https://github.com/VictimOfMaths/Publications/blob/master/EngMortalityInequalities.R. Ethical approval for the use of ONS data was obtained from the School of Health and Related Research ethics committee at the University of Sheffield (ref. 023092). This analysis was not pre‐registered and the results should be considered exploratory.
Results
Estimating the magnitude of the inequality ‘gap’
Full results of the analysis for both life expectancy and standard deviation in age at death are presented in Table 2 for men and Table 3 for women. In 2016, the remaining life expectancy for an 18‐year‐old man in England was 61.46 years, with a standard deviation of 11.35 years. Female life expectancy at 18 was higher at 64.40 years and was less uncertain, with a standard deviation of 10.01 years. There is substantial variation in these measures between socio‐economic groups. Men in the most deprived IMD quintile live, on average, 6.53 years fewer and face greater uncertainty in age of death (reflected in a standard deviation that is 2.56 years higher) than men in the least deprived quintile. In women this inequality gap is smaller, but still substantial, with those in the most deprived quintile living 4.73 years fewer and with a standard deviation that is 2.15 years higher.
Table 2.
Trends in life expectancy and standard deviation in age at death from age 18 and the contribution of alcohol‐specific causes to this: males.
| 2001 | 2002 | 2003 | 2004 | 2005 | 2006 | 2007 | 2008 | 2009 | 2010 | 2011 | 2012 | 2013 | 2014 | 2015 | 2016 | |
|---|---|---|---|---|---|---|---|---|---|---|---|---|---|---|---|---|
| Life expectancy (male) | ||||||||||||||||
| Population | ||||||||||||||||
| Remaining life expectancy at age 18: e(18| 90) | 58.48 | 58.63 | 58.81 | 59.27 | 59.53 | 59.78 | 60.00 | 60.13 | 60.47 | 60.73 | 61.11 | 61.26 | 61.24 | 61.42 | 61.32 | 61.46 |
| Remaining life expectancy at age 18 without alcohol: e(18| 90)† | 58.69 | 58.85 | 59.04 | 59.5 | 59.77 | 60.03 | 60.26 | 60.41 | 60.73 | 61.01 | 61.39 | 61.51 | 61.51 | 61.68 | 61.57 | 61.73 |
| Impact of alcohol (years): ∆eAlc | −0.21 | −0.21 | −0.23 | −0.23 | −0.25 | −0.26 | −0.26 | −0.28 | −0.27 | −0.27 | −0.28 | −0.25 | −0.26 | −0.26 | −0.25 | −0.26 |
| IMD Q1 (least deprived) | ||||||||||||||||
| Remaining life expectancy at age 18: e(18| 90)Q1 | 61.05 | 61.27 | 61.40 | 61.77 | 62.04 | 62.3 | 62.57 | 62.68 | 62.92 | 63.15 | 63.49 | 63.58 | 63.56 | 63.77 | 63.75 | 63.86 |
| Remaining life expectancy at age 18: without alcohol e(18| 90)†Q1 | 61.15 | 61.37 | 61.51 | 61.88 | 62.16 | 62.41 | 62.69 | 62.80 | 63.05 | 63.29 | 63.61 | 63.7 | 63.70 | 63.89 | 63.88 | 63.98 |
| Impact of alcohol (years): ∆eAlcQ1 | −0.10 | −0.10 | −0.10 | −0.11 | −0.12 | −0.11 | −0.12 | −0.12 | −0.13 | −0.14 | −0.12 | −0.12 | −0.13 | −0.13 | −0.13 | −0.12 |
| IMD Q5 (most deprived) | ||||||||||||||||
| Remaining life expectancy at age 18: e(18| 90)Q5 | 54.56 | 54.67 | 54.82 | 55.26 | 55.54 | 55.6 | 55.78 | 55.87 | 56.23 | 56.67 | 57.05 | 57.28 | 57.31 | 57.28 | 57.2 | 57.33 |
| Remaining life expectancy at age 18 without alcohol: e(18| 90)†Q5 | 54.96 | 55.07 | 55.27 | 55.70 | 56.00 | 56.11 | 56.27 | 56.41 | 56.73 | 57.18 | 57.56 | 57.75 | 57.79 | 57.77 | 57.62 | 57.79 |
| Impact of alcohol (years): ∆eAlcQ5 | −0.04 | −0.40 | −0.45 | −0.44 | −0.46 | −0.50 | −0.49 | −0.54 | −0.50 | −0.51 | −0.51 | −0.46 | −0.48 | −0.49 | −0.42 | −0.45 |
| Inequality ‘gap’ in life expectancy: gape | 6.50 | 6.59 | 6.58 | 6.51 | 6.51 | 6.70 | 6.79 | 6.81 | 6.69 | 6.47 | 6.44 | 6.30 | 6.26 | 6.49 | 6.55 | 6.53 |
| Contribution of alcohol to this: | 0.31 | 0.30 | 0.35 | 0.33 | 0.34 | 0.39 | 0.37 | 0.42 | 0.37 | 0.37 | 0.39 | 0.35 | 0.35 | 0.36 | 0.30 | 0.33 |
| Relative contribution of alcohol: | 4.7% | 4.6% | 5.3% | 5.1% | 5.2% | 5.9% | 5.5% | 6.1% | 5.5% | 5.6% | 6.0% | 5.5% | 5.6% | 5.6% | 4.5% | 5.1% |
| SD in age of death (male) | ||||||||||||||||
| Population | ||||||||||||||||
| SD in age of death (18+): S(18| 90) | 11.95 | 11.94 | 11.91 | 11.81 | 11.77 | 11.76 | 11.71 | 11.72 | 11.69 | 11.54 | 11.37 | 11.26 | 11.33 | 11.34 | 11.35 | 11.35 |
| SD in age of death (18+) without alcohol: S(18| 90)† | 11.79 | 11.77 | 11.74 | 11.63 | 11.59 | 11.56 | 11.51 | 11.50 | 11.48 | 11.31 | 11.14 | 11.04 | 11.11 | 11.13 | 11.15 | 11.15 |
| Impact of alcohol (years): ∆SAlc | 0.16 | 0.16 | 0.18 | 0.18 | 0.19 | 0.20 | 0.20 | 0.23 | 0.22 | 0.23 | 0.23 | 0.21 | 0.22 | 0.21 | 0.20 | 0.21 |
| IMD Q1 (least deprived) | ||||||||||||||||
| SD in age of death (18+): S(18| 90)Q1 | 10.54 | 10.58 | 10.57 | 10.52 | 10.57 | 10.39 | 10.26 | 10.33 | 10.33 | 10.14 | 10.00 | 9.87 | 9.98 | 9.88 | 9.88 | 9.95 |
| SD in age of death (18+) without alcohol: S(18| 90)†Q1 | 10.44 | 10.48 | 10.48 | 10.43 | 10.45 | 10.29 | 10.14 | 10.22 | 10.20 | 9.98 | 9.87 | 9.76 | 9.85 | 9.74 | 9.75 | 9.83 |
| Impact of alcohol (years): ∆SAlcQ1 | 0.10 | 0.10 | 0.09 | 0.09 | 0.11 | 0.10 | 0.12 | 0.12 | 0.13 | 0.15 | 0.12 | 0.11 | 0.13 | 0.14 | 0.13 | 0.12 |
| IMD Q5 (most deprived) | ||||||||||||||||
| SD in age of death (18+): S(18| 90)Q5 | 13.31 | 13.22 | 13.16 | 13.09 | 13.04 | 13.08 | 13.02 | 13.00 | 13.04 | 12.78 | 12.62 | 12.50 | 12.45 | 12.58 | 12.56 | 12.51 |
| SD in age of death (18+) without alcohol: S(18| 90)†Q5 | 13.08 | 13.00 | 12.91 | 12.84 | 12.78 | 12.79 | 12.74 | 12.68 | 12.75 | 12.47 | 12.31 | 12.21 | 12.14 | 12.30 | 12.31 | 12.25 |
| Impact of alcohol (years): ∆SAlcQ5 | 0.23 | 0.22 | 0.25 | 0.25 | 0.25 | 0.29 | 0.28 | 0.31 | 0.29 | 0.31 | 0.31 | 0.29 | 0.31 | 0.28 | 0.25 | 0.26 |
| Inequality ‘gap’ in SD in age of death (years): gapS | −2.77 | −2.65 | −2.59 | −2.57 | −2.47 | −2.68 | −2.76 | −2.66 | −2.71 | −2.64 | −2.62 | −2.63 | −2.47 | −2.70 | −2.68 | −2.56 |
| Contribution of alcohol to this: | −0.13 | −0.13 | −0.16 | −0.16 | −0.14 | −0.18 | −0.16 | −0.20 | −0.17 | −0.16 | −0.19 | −0.18 | −0.18 | −0.15 | −0.12 | −0.14 |
| Relative contribution of alcohol: | 4.7% | 4.7% | 6.1% | 6.1% | 5.7% | 6.9% | 5.9% | 7.3% | 6.2% | 6.1% | 7.2% | 6.8% | 7.3% | 5.4% | 4.4% | 5.3% |
SD = standard deviation; IMD = index of multiple deprivation.
Table 3.
Trends in life expectancy and standard deviation in age at death from age 18 and the contribution of alcohol‐specific causes to this: females.
| 2001 | 2002 | 2003 | 2004 | 2005 | 2006 | 2007 | 2008 | 2009 | 2010 | 2011 | 2012 | 2013 | 2014 | 2015 | 2016 | |
|---|---|---|---|---|---|---|---|---|---|---|---|---|---|---|---|---|
| Life expectancy (female) | ||||||||||||||||
| Population | ||||||||||||||||
| Remaining life expectancy at age 18: e(18| 90) | 62.47 | 62.57 | 62.60 | 62.99 | 63.11 | 63.36 | 63.46 | 63.52 | 63.88 | 63.99 | 64.21 | 64.24 | 64.30 | 64.43 | 64.29 | 64.40 |
| Remaining life expectancy at age 18 without alcohol: e(18| 90)† | 62.58 | 62.68 | 62.72 | 63.12 | 63.24 | 63.50 | 63.61 | 63.66 | 64.03 | 64.13 | 64.36 | 64.38 | 64.44 | 64.58 | 64.44 | 64.54 |
| Impact of alcohol (years): ∆eAlc | −0.11 | −0.11 | −0.12 | −0.13 | −0.13 | −0.14 | −0.14 | −0.15 | −0.14 | −0.14 | −0.15 | −0.14 | −0.14 | −0.15 | −0.14 | −0.14 |
| IMD Q1 (least deprived) | ||||||||||||||||
| Remaining life expectancy at age 18: e(18| 90)Q1 | 63.99 | 64.08 | 64.18 | 64.51 | 64.65 | 64.82 | 64.94 | 65.09 | 65.39 | 65.45 | 65.71 | 65.75 | 65.81 | 65.89 | 65.90 | 65.95 |
| Remaining life expectancy at age 18 without alcohol: e(18| 90)†Q1 | 64.05 | 64.14 | 64.25 | 64.57 | 64.72 | 64.90 | 65.02 | 65.16 | 65.47 | 65.53 | 65.79 | 65.83 | 65.89 | 65.97 | 65.98 | 66.02 |
| Impact of alcohol (years): ∆eAlcQ1 | −0.06 | −0.06 | −0.07 | −0.06 | −0.07 | −0.08 | −0.08 | −0.07 | −0.07 | −0.08 | −0.09 | −0.08 | −0.09 | −0.08 | −0.08 | −0.08 |
| IMD Q5 (most deprived) | ||||||||||||||||
| Remaining life expectancy at age 18: e(18| 90)Q5 | 59.84 | 59.91 | 59.80 | 60.17 | 60.33 | 60.48 | 60.53 | 60.43 | 60.97 | 61.05 | 61.22 | 61.28 | 61.24 | 61.36 | 61.10 | 61.22 |
| Remaining life expectancy at age 18 without alcohol: e(18| 90)†Q5 | 60.05 | 60.11 | 60.01 | 60.40 | 60.56 | 60.74 | 60.79 | 60.70 | 61.22 | 61.29 | 61.48 | 61.52 | 61.47 | 61.61 | 61.35 | 61.46 |
| Impact of alcohol (years): ∆eAlcQ5 | −0.21 | −0.21 | −0.22 | −0.23 | −0.23 | −0.25 | −0.26 | −0.27 | −0.25 | −0.24 | −0.26 | −0.24 | −0.23 | −0.25 | −0.25 | −0.24 |
| Inequality ‘gap’ in life expectancy: gape | 4.15 | 4.17 | 4.39 | 4.34 | 4.33 | 4.34 | 4.41 | 4.66 | 4.43 | 4.40 | 4.49 | 4.46 | 4.56 | 4.53 | 4.80 | 4.73 |
| Contribution of alcohol to this: | 0.15 | 0.14 | 0.15 | 0.16 | 0.16 | 0.17 | 0.18 | 0.20 | 0.18 | 0.16 | 0.17 | 0.16 | 0.14 | 0.17 | 0.17 | 0.17 |
| Relative contribution of alcohol: | 3.5% | 3.4% | 3.4% | 3.8% | 3.8% | 4.0% | 4.2% | 4.2% | 4.1% | 3.6% | 3.8% | 3.5% | 3.1% | 3.8% | 3.5% | 3.5% |
| SD in age of death (female) | ||||||||||||||||
| Population | ||||||||||||||||
| SD in age of death (18+): S(18| 90) | 10.42 | 10.37 | 10.38 | 10.33 | 10.28 | 10.21 | 10.17 | 10.20 | 10.12 | 10.08 | 10.03 | 9.92 | 9.93 | 9.98 | 9.96 | 10.01 |
| SD in age of death (18+) without alcohol: S(18| 90)† | 10.31 | 10.25 | 10.26 | 10.20 | 10.14 | 10.06 | 10.01 | 10.05 | 9.96 | 9.91 | 9.86 | 9.76 | 9.78 | 9.82 | 9.79 | 9.85 |
| Impact of alcohol (years): ∆SAlc | 0.12 | 0.12 | 0.12 | 0.13 | 0.14 | 0.15 | 0.16 | 0.16 | 0.16 | 0.16 | 0.17 | 0.16 | 0.16 | 0.17 | 0.16 | 0.16 |
| IMD Q1 (least deprived) | ||||||||||||||||
| SD in age of death (18+): S(18| 90)Q1 | 9.47 | 9.43 | 9.40 | 9.30 | 9.30 | 9.28 | 9.22 | 9.17 | 9.05 | 9.01 | 8.88 | 8.85 | 8.80 | 8.88 | 8.75 | 8.88 |
| SD in age of death (18+) without alcohol: S(18| 90)†Q1 | 9.40 | 9.36 | 9.32 | 9.23 | 9.22 | 9.20 | 9.12 | 9.10 | 8.96 | 8.89 | 8.77 | 8.75 | 8.68 | 8.78 | 8.64 | 8.78 |
| Impact of alcohol (years): ∆SAlcQ1 | 0.07 | 0.07 | 0.08 | 0.07 | 0.08 | 0.09 | 0.10 | 0.08 | 0.09 | 0.11 | 0.11 | 0.11 | 0.12 | 0.10 | 0.10 | 0.10 |
| IMD Q5 (most deprived) | ||||||||||||||||
| SD in age of death (18+): S(18| 90)Q5 | 11.42 | 11.33 | 11.38 | 11.29 | 11.24 | 11.16 | 11.18 | 11.25 | 11.15 | 11.09 | 11.09 | 10.84 | 10.94 | 11.00 | 10.99 | 11.02 |
| SD in age of death (18+) without alcohol: S(18| 90)†Q5 | 11.24 | 11.15 | 11.18 | 11.09 | 11.02 | 10.93 | 10.94 | 11.01 | 10.91 | 10.86 | 10.85 | 10.61 | 10.73 | 10.76 | 10.76 | 10.80 |
| Impact of alcohol (years): ∆SAlcQ5 | 0.19 | 0.18 | 0.20 | 0.20 | 0.21 | 0.23 | 0.24 | 0.24 | 0.24 | 0.23 | 0.24 | 0.23 | 0.22 | 0.24 | 0.24 | 0.23 |
| Inequality ‘gap’ in SD in age of death (years): gapS | −1.95 | −1.90 | −1.98 | −1.99 | −1.94 | −1.88 | −1.96 | −2.07 | −2.10 | −2.08 | −2.21 | −1.98 | −2.15 | −2.12 | −2.25 | −2.15 |
| Contribution of alcohol to this: | −0.11 | −0.11 | −0.12 | −0.13 | −0.13 | −0.14 | −0.14 | −0.16 | −0.15 | −0.11 | −0.13 | −0.12 | −0.10 | −0.14 | −0.13 | −0.13 |
| Relative contribution of alcohol: | 5.8% | 5.9% | 5.9% | 6.5% | 6.9% | 7.7% | 7.2% | 7.6% | 7.3% | 5.5% | 5.8% | 6.0% | 4.7% | 6.5% | 5.9% | 6.0% |
SD = standard deviation; IMD = index of multiple deprivation.
Alcohol's contribution to mortality inequalities
Table 2 demonstrates that we find that alcohol‐specific causes were responsible for a 0.26‐year (4.2%) reduction in life expectancy for men in 2016, equivalent to 13.5 weeks, and an increase in standard deviation in age at death of 0.21 years (+1.9%). Table 3 shows that this impact is smaller for women, with alcohol reducing life expectancy by 0.14 years (2.2%), equivalent to 7.3 weeks, and increasing standard deviation in age at death by 0.16 (+1.6%). However, alcohol‐specific deaths are not evenly distributed across the socio‐economic spectrum. Figure 1 illustrates the age distribution of alcohol‐specific and all other cause deaths, showing this disparity in harm rates between socio‐economic groups. This also highlights that alcohol‐specific deaths are concentrated in later middle age, while deaths from other causes are not, and shows that deaths from alcohol‐specific causes typically occur at younger ages as deprivation increases, particularly among women.
Figure 1.

Age distribution of alcohol‐specific deaths (a) and deaths from all other causes (b) by deprivation (2001–16 data pooled). [Colour figure can be viewed at wileyonlinelibrary.com]
Alcohol‐specific causes are estimated to reduce life expectancy among 18‐year‐old men in the most deprived IMD quintile by 0.45 (7.8%) years compared to a reduction of 0.12 (1.9%) in the least deprived quintile (Table 2). As a result, alcohol‐specific causes are responsible for 0.33 years (5.1%) of the inequality gap in male life expectancy. Among women, alcohol‐specific causes are responsible for a reduction of 0.24 (3.9%) in life expectancy at age 18 (Table 3) in the most deprived quintile compared to a reduction of 0.08 (1.2%) years in the least deprived quintile. This corresponds to 0.17 years (3.5%) of the inequality gap in female life expectancy.
We also find that alcohol‐specific causes lead to a greater increase in life‐span uncertainty in more deprived groups. These causes are responsible for a 0.26‐year increase (+2.1%) in the standard deviation of age of death among men in the most deprived quintile compared to a 0.12‐year increase (+1.2%) in the least deprived quintile. This equates to a contribution of 0.14 years (5.3%) to the inequality gap in standard deviation of age of death, similar to the 5.1% effect on life expectancy. For women, standard deviation in age at death is increased by 0.23 years (+2.1%) in the most deprived group and 0.10 years (+1.1%) in the least deprived group from the impact of alcohol‐specific deaths, meaning that alcohol‐specific causes are responsible for 0.13 years (6.0%) of the inequality gap in life‐span variation.
Temporal trends in alcohol's contribution to mortality inequalities
The trends in both outcome measures between 2001 and 2016, both with and without the contribution of alcohol‐specific causes, are shown in Fig. 2. This shows that for both men and women, and for both life expectancy and standard deviation in age at death, alcohol‐specific causes have had a larger impact on the most deprived group in all years. These figures also illustrate that that a stagnation in life expectancy since 2010, particularly in the most deprived groups, has seen a concurrent stagnation, or even reversal, of falling uncertainty in age of death.
Figure 2.
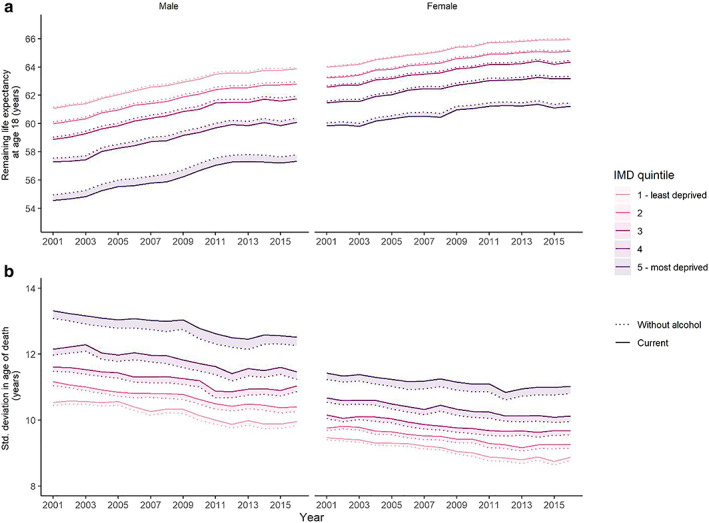
Trends in life expectancy (a) and standard deviation of age at death (b) with and without the contribution of alcohol‐specific causes, represented by the shaded areas, by sex and index of multiple deprivation (IMD) quintile. [Colour figure can be viewed at wileyonlinelibrary.com]
Tables 2 and 3 also present the temporal trends for all outcome measures between 2001 and 2016. During this period the overall inequality gap in life expectancy for men rose until 2007 before falling back to 2001 levels, while for women it rose until 2008, fell back and then rose again, largely as a result of the stagnation in improvements in the most deprived IMD quintile. The time trends in the inequality gap in standard deviation in age at death are less pronounced; however, in general the gap among men has fallen gradually from 2.77 years in 2001 to 2.56 years in 2016, while it has risen among women, from 1.95 to 2.15 during the same period.
Time trends in the relative contribution of alcohol to these gaps are shown in Fig. 3. These trends illustrate that both life expectancy and life‐span uncertainty display broadly similar trends in both men and women, rising and then falling back. However, in men the fall in the contribution of alcohol to inequality in both life expectancy and standard deviation in age at death has only come since 2014, while it peaked in women for both measures in 2008. This figure also illustrates that alcohol‐specific causes make a similar contribution to inequality as measured using both life expectancy and life‐span variation among men, while alcohol makes a substantially greater contribution to inequality in women when measured using standard deviation in age at death. This suggests that using life expectancy as the sole measure of mortality inequalities is likely to underestimate the contribution of alcohol to these inequalities among women.
Figure 3.

Trends in the contribution of alcohol‐specific causes to the inequality gap between highest and lowest deprivation groups in life expectancy and standard deviation of age at death, by sex. [Colour figure can be viewed at wileyonlinelibrary.com]
A sensitivity analysis using a broader definition of liver disease marginally increases the estimated impact of alcohol on life expectancy and life‐span uncertainty and the inequality gaps in both, but does not materially change the results. See Supporting information, Tables S1 and S2 for these results. For comparative purposes, results calculated using birth, rather than age 18 as the lower bound, are presented in Tables S3 and S4.
Discussion
Our findings show that there are significant socio‐economic inequalities in both alcohol‐specific and overall mortality in England and Wales, with more deprived groups experiencing shorter life expectancy and greater uncertainty in age at death. In 2016, alcohol‐specific causes represented only 1.3% of all deaths, yet were responsible for a 4.2% reduction in life expectancy among men and a 2.2% reduction in women. They also increased uncertainty in age at death by 1.9 and 1.6%, respectively. Alcohol‐specific mortality was substantially greater in more deprived groups and, as a result, alcohol‐specific causes were responsible for 5.1% of the gap in life expectancy between the most‐ and least‐deprived groups in men and 3.6% of the gap in women in 2016. The contribution to life‐span inequality was greater still, particularly for women, with these causes accounting for 6.0% of the inequality gap in this measure. Over time, the impact of alcohol on life expectancy, life‐span inequality and the inequality gap in both measures increased between 2001 and 2008–11 and has subsequently reduced. During the same period, alcohol, per capita alcohol consumption rose until 2004 and fell for most of the following decade, levelling off in the last few years [31]. This suggests that there may be a lag of several years between changes in alcohol consumption and changes in alcohol‐related harm, in line with epidemiological evidence [32]. We also find that the stagnation in improvements in life expectancy, identified in several previous studies [33, 34] have been accompanied by similar stagnation in life‐span uncertainty, particularly for women in the most deprived IMD quintile.
This study is, to our knowledge, the first to produce estimates of the contribution of alcohol to both between‐ and within‐group socio‐economic inequalities in life‐span. By considering both these measures together, our study contributes to understanding these inequalities and the impacts they have on society. A key strength is that the data we used comes from national records and represents every death recorded in England and Wales over a significant time‐period.
There are, however, limitations to our approach. Our inclusion of only alcohol‐specific health conditions ensures that our results are a consequence only of alcohol, rather than trends in other risk factors. However, in doing so we have excluded a significant proportion of the true burden of alcohol, including the impacts on cardiovascular disease, cancers and injuries, for which alcohol is one of multiple risk factors [35, 36, 37]. Modelling studies have suggested that alcohol‐specific deaths represent approximately 40% of all deaths caused by alcohol consumption [38, 39]. A recent study using estimates from the Global Burden of Disease study of the impact of alcohol among all health conditions found reductions in life expectancy attributable to alcohol in the United Kingdom, which were approximately three times larger than our estimates [40]. It is also likely that the exclusion of partially alcohol‐attributable conditions from our analysis means that we are underestimating the impact of alcohol on within‐group variation in life expectancy, as we are excluding causes such as accidents and injuries which make a significant contribution to deaths at younger ages. It is less clear, however, how this exclusion might impact on our estimates of alcohol's contribution to between‐group inequalities, as this will depend on the prevalence and age distribution of deaths from partially attributable causes among different socio‐economic groups. It is also important to note that there will be some random variation from year‐to‐year in mortality rates from all conditions; however, the large sample size and the relative stability of the year‐on‐year trends suggests that this is unlikely to affect our conclusions. Finally, mortality data for England are only available stratified by IMD, which is derived from the home postcode of the deceased. The use of other, individual‐level measures of socio‐economic position may show subtly different relationships between alcohol and inequalities [41].
Previous studies have estimated the contribution of alcohol to socio‐economic gradients in life expectancy in Denmark [42], Finland [43], Sweden [44] and Norway [45]. All four studies used similar methodologies to the present study, but found that alcohol was responsible for a much larger proportion of the inequality gap between socio‐economic groups (e.g. 35% for men and 22% for women in Finland in 2003–07 [43]). In part, this disparity is likely to be a consequence of the inclusion of deaths in these studies where alcohol‐specific disease or intoxication was listed on the death certificate as a contributory cause. Higher rates of identification of alcohol as a contributory factor may also be a consequence of much higher rates of postmortems in Scandinavian countries.
Future research to develop more refined approaches to attributing deaths to alcohol (and other health risk factors) should be considered an important priority in order to ensure that we fully understand the impact that alcohol has on health inequalities and, as a result, the extent to which any alcohol policy can affect overall inequalities in health. This could involve understanding the differing contributions that alcohol and other risk factors, such as smoking, diet and exercise, make to health harms among different socio‐economic groups. An important related question is the extent to which particular health conditions are contributing to the inequalities we have described—a key question from a policy perspective because the approaches required to reduce the prevalence of deaths from, for example, alcohol poisoning may only partially overlap with those required for alcoholic liver disease. It is also important to recognize that the contribution of alcohol to socio‐economic inequalities to health is modest, as is the case for many other leading risk factors individually [2]. As a result, any attempt to reduce these inequalities will need to address multiple risk factors and/or the underlying social determinants of health in order to be successful.
The approach described in this study could be replicated in any country with a national deaths register using ICD‐10 coding. One of the greatest values in metrics of inequality is in using them to compare inequality between different countries and contexts [20]. We would therefore strongly encourage the production of comparative estimates of alcohol's contribution to health inequalities in other countries. We would anticipate that countries with higher levels of drinking, particularly in younger age groups and larger differences in health between higher and lower socio‐economic groups would show larger contributions of alcohol to inequalities in both between‐ and within‐group inequalities in health.
This study illustrates the value of measuring alcohol's contribution to inequality through both life expectancy and variation in age of death, highlighting that a focus on life expectancy alone would underestimate the contribution of alcohol to health inequalities in women in particular. We therefore recommend that future research in the field of alcohol and addiction science incorporates analysis of variation in age of death alongside more commonly used measures of life expectancy when evaluating socio‐economic inequalities in health. Our findings show that alcohol‐specific causes contribute to a shorter life expectancy and increased uncertainty around age at death, although these effects are modest. This impact is larger in more deprived groups, and therefore these causes increase inequality both between and within socio‐economic groups. Reducing rates of alcohol‐specific death, particularly at younger ages, is likely to reduce socio‐economic inequalities in health; however, this impact is unlikely to be large.
Declaration of interests
C.A., J.H. and P.M. have received funding related to commissioned research from Systembolaget and Alko, the Swedish and Finnish government‐owned alcohol retail monopoly. R.P., F.d.V., M.H., A.B. and D.G. have no interests to declare.
Supporting information
Figure S1 Age distribution of a broader definition of alcohol‐specific deaths (Panel A) and deaths from all other causes (Panel B) by deprivation (2001–16 data pooled)
Table S1 Trends in life expectancy and standard deviation in age of death from age 18 and the contribution of alcohol to this under a broader definition of ‘alcohol‐specific’ – males
Table S2 Trends in life expectancy and standard deviation in age of death from age 18 and the contribution of alcohol to this under a broader definition of ‘alcohol‐specific’ – females
Figure S2 Trends in life expectancy (panel A) and standard deviation of age at death (panel B) with and without the contribution of a broader definition of alcohol‐specific causes, represented by the shaded areas, by sex and IMD quintile
Figure S3 Trends in the contribution of a broader definition of alcohol‐specific causes to the inequality gap between highest and lowest deprivation groups in life expectancy and standard deviation of age at death, by sex
Figure S4 Age distribution of alcohol‐specific deaths (Panel A) and deaths from all other causes (Panel B) from ages 0–90 by deprivation (2001–16 data pooled)
Table S3 Trends in life expectancy and standard deviation in age of death from ages 0–90 and the contribution of alcohol to this – males
Table S4 Trends in life expectancy and standard deviation in age of death from ages 0–90 and the contribution of alcohol to this ‐ females
Figure S5 Trends in life expectancy (panel A) and standard deviation of age at death (panel B) from ages 0–90 with and without the contribution of alcohol‐specific causes, represented by the shaded areas, by sex and IMD quintile
Figure S6 Trends in the contribution of alcohol‐specific causes to the inequality gap between highest and lowest deprivation groups in life expectancy and standard deviation of age at death, by sex.
Acknowledgements
The purchase of the mortality data used for this research was supported by the National Institute for Health Research School for Public Health Research (NIHR SPHR). NIHR SPHR is a partnership between the Universities of Sheffield, Bristol, Cambridge, Exeter and UCL; The London School for Hygiene and Tropical Medicine; the LiLaC collaboration between the Universities of Liverpool and Lancaster and Fuse; and The Centre for Translational Research in Public Health, a collaboration between Newcastle, Durham, Northumbria, Sunderland and Teesside Universities. The views expressed are those of the author(s) and not necessarily those of the NHS, the NIHR or the Department of Health. The mortality data used in this study were provided by the Office for National Statistics (ONS). The ONS bears no responsibility for the analysis presented in this study or its interpretation. The authors would like to thank Rosie Seaman for her helpful comments on a draft of this manuscript.
Angus, C. , Pryce, R. , Holmes, J. , de Vocht, F. , Hickman, M. , Meier, P. , Brennan, A. , and Gillespie, D. (2020) Assessing the contribution of alcohol‐specific causes to socio‐economic inequalities in mortality in England and Wales 2001–16. Addiction, 115: 2268–2279. 10.1111/add.15037.
References
- 1. Rehm J., Gmel G. E., Gmel G., Hasan O. S. M., Imtiaz S., Popova S., et al The relationship between different dimensions of alcohol use and the burden of disease‐an update. Addiction 2017; 112: 968–1001. [DOI] [PMC free article] [PubMed] [Google Scholar]
- 2. Forouzanfar M. H., Afshin A., Alexander L. T., Anderson H. R., Bhutta Z. A., Biryukov S., et al Global, regional, and national comparative risk assessment of 79 behavioural, environmental and occupational, and metabolic risks or clusters of risks, 1990–2015: a systematic analysis for the global burden of disease study 2015. Lancet 2016; 388: 1659–1724. [DOI] [PMC free article] [PubMed] [Google Scholar]
- 3. Mackenbach J. P., Stirbu I., Roskam A.‐J. R., Schaap M. M., Menvielle G., Leinsalu M., et al Socioeconomic inequalities in health in 22 European countries. N Engl J Med 2008; 358: 2468–2481. [DOI] [PubMed] [Google Scholar]
- 4. van Raalte A. A., Kunst A. E., Deboosere P., Leinsalu M., Lundberg O., Martikainen P., et al More variation in lifespan in lower educated groups: evidence from 10 European countries. Int J Epidemiol 2011; 40: 1703–1714. [DOI] [PubMed] [Google Scholar]
- 5. Davey Smith G., Hart C., Blane D., Gillis C., Hawthorne V. Lifetime socioeconomic position and mortality: prospective observational study. BMJ 1997; 314: 547–547. [DOI] [PMC free article] [PubMed] [Google Scholar]
- 6. Huisman M., Kunst A. E., Bopp M., Borgan J.‐K., Borrell C., Costa G., et al Educational inequalities in cause‐specific mortality in middle‐aged and older men and women in eight western European populations. Lancet 2005; 365: 493–500. [DOI] [PubMed] [Google Scholar]
- 7. Sadler S., Angus C., Gavens L., Gillespie D., Holmes J., Hamilton J., et al Understanding the alcohol harm paradox: an analysis of sex‐ and condition‐specific hospital admissions by socio‐economic group for alcohol‐associated conditions in England. Addiction 2017; 112: 808–817. [DOI] [PubMed] [Google Scholar]
- 8. Green M. A., Strong M., Conway L., Maheswaran R. Trends in alcohol‐related admissions to hospital by age, sex and socioeconomic deprivation in England, 2002/03 to 2013/14. BMC Public Health 2017; 17: 412. [DOI] [PMC free article] [PubMed] [Google Scholar]
- 9. Mackenbach J. P., Kulhánová I., Bopp M., Borrell C., Deboosere P., Kovács K., et al Inequalities in alcohol‐related mortality in 17 European countries: a retrospective analysis of mortality registers. PLOS Med 2015; 12: e1001909. [DOI] [PMC free article] [PubMed] [Google Scholar]
- 10. Katikireddi S. V., Whitley E., Lewsey J., Gray L., Leyland A. H. Socioeconomic status as an effect modifier of alcohol consumption and harm: analysis of linked cohort data. Lancet Public Health 2017; 2: e267–e276. [DOI] [PMC free article] [PubMed] [Google Scholar]
- 11. Jones L., Bates G., McCoy E., Bellis M. A. Relationship between alcohol‐attributable disease and socioeconomic status, and the role of alcohol consumption in this relationship: a systematic review and meta‐analysis. BMC Public Health 2015; 15: 400. [DOI] [PMC free article] [PubMed] [Google Scholar]
- 12. Probst C., Roerecke M., Behrendt S., Rehm J. Socioeconomic differences in alcohol‐attributable mortality compared with all‐cause mortality: a systematic review and meta‐analysis. Int J Epidemiol 2014; 43: 1314–1327. [DOI] [PMC free article] [PubMed] [Google Scholar]
- 13. van Raalte A. A., Kunst A. E., Lundberg O., Leinsalu M., Martikainen P., Artnik B., et al The contribution of educational inequalities to lifespan variation. Popul Health Metr 2012; 10: 3. [DOI] [PMC free article] [PubMed] [Google Scholar]
- 14. Edwards R. D., Tuljapurkar S. Inequality in life spans and a new perspective on mortality convergence across industrialized countries. Popul Dev Rev 2005; 31: 645–674. [Google Scholar]
- 15. Seaman R., Leyland A. H., Popham F. Increasing inequality in age of death at shared levels of life expectancy: a comparative study of Scotland and England and Wales. SSM Popul Health 2016; 2: 724–731. [DOI] [PMC free article] [PubMed] [Google Scholar]
- 16. Gillespie D. O. S., Trotter M. V., Tuljapurkar S. D. Divergence in age patterns of mortality change drives international divergence in lifespan inequality. Demography 2014; 51: 1003–1017. [DOI] [PMC free article] [PubMed] [Google Scholar]
- 17. Smits J., Monden C. Length of life inequality around the globe. Soc Sci Med 2009; 68: 1114–1123. [DOI] [PubMed] [Google Scholar]
- 18. Eyal N. Inequalities in Health: Concepts, Measures, and Ethics. Oxford: Oxford University Press; 2013, p. 335. [Google Scholar]
- 19. Edwards R. D. The cost of uncertain life span. J Popul Econ 2013; 26: 1485–1522. [DOI] [PMC free article] [PubMed] [Google Scholar]
- 20. van Raalte A. A., Sasson I., Martikainen P. The case for monitoring life‐span inequality. Science 2018; 362: 1002–1004. [DOI] [PubMed] [Google Scholar]
- 21. Bago d'Uva T., O'Donnell O., van Doorslaer E. Who can predict their own demise? Heterogeneity in the accuracy and value of longevity expectations. J Econ Ageing 2017. 100135; 10.1016/j.jeoa.2017.10.003. [DOI] [Google Scholar]
- 22. Seligman B., Greenberg G., Tuljapurkar S. Equity and length of lifespan are not the same. Proc Natl Acad Sci 2016; 113: 8420–8423. [DOI] [PMC free article] [PubMed] [Google Scholar]
- 23. Williams R., Alexander G., Armstrong I., Baker A., Bhala N., Camps‐Walsh G., et al Disease burden and costs from excess alcohol consumption, obesity, and viral hepatitis: fourth report of the Lancet Standing Commission on Liver Disease in the UK. Lancet 2018; 391: 1097–1107. [DOI] [PubMed] [Google Scholar]
- 24. Department for Communities and Local Government English Indices of Deprivation, 2015. London: Ministry of Housing, Communities and Local Government; 2015. [Google Scholar]
- 25. Office for National Statistics . The impact of using the new definition of alcohol‐specific deaths—Office for National Statistics [internet]. 2017 [cited 2019 Mar 13]. Available at: https://www.ons.gov.uk/peoplepopulationandcommunity/birthsdeathsandmarriages/deaths/articles/theimpactofusingthenewdefinitionofalcoholspecificdeaths/2017‐10‐27 (accessed 13 March 2019).
- 26. Webster L., Angus C., Holmes J., Brennan A., Gillespie D. Alcohol Attributable Fractions for England. Sheffield, UK: School of Health and Related Research, University of Sheffield; 2019. [Google Scholar]
- 27. Ratib S., West J., Fleming K. M. Liver cirrhosis in England—an observational study: are we measuring its burden occurrence correctly? BMJ Open 2017; 7: e013752. [DOI] [PMC free article] [PubMed] [Google Scholar]
- 28. Preston S., Heuveline P., Guillot M. Demography: measuring and modeling population processes. Oxford, UK: Blackwell Publishing; 2001. [Google Scholar]
- 29. Chiang C. Introduction to stochastic processes in biostatistics. New York/London/Sydney: John Wiley and Sons; Wiley; 1968. [Google Scholar]
- 30. R Core Team R: A language and environment for statistical computing. Vienna, Austria: R Foundation for Statistical Computing; 2017. [Google Scholar]
- 31. British Beer and Pub Association Statistical Handbook 2018. Paul Oakle. London: Brewing Publications Ltd, p. 2018. [Google Scholar]
- 32. Holmes J., Meier P. S., Booth A., Guo Y., Brennan A. The temporal relationship between per capita alcohol consumption and harm: a systematic review of time lag specifications in aggregate time series analyses. Drug Alcohol Depend 2012; 123: 7–14. [DOI] [PubMed] [Google Scholar]
- 33. Raleigh V. S. Stalling life expectancy in the UK. BMJ (on‐line) 2018; 362; 10.1136/bmj.k4050. [DOI] [PubMed] [Google Scholar]
- 34. Leon D. A., Jdanov D. A., Shkolnikov V. M. Trends in life expectancy and age‐specific mortality in England and Wales, 1970–2016, in comparison with a set of 22 high‐income countries: an analysis of vital statistics data. Lancet Public Health 2019; 4: e575–e582. [DOI] [PubMed] [Google Scholar]
- 35. Griswold M. G., Fullman N., Hawley C., Arian N., Zimsen S. R. M., Tymeson H. D., et al Alcohol use and burden for 195 countries and territories, 1990–2016: a systematic analysis for the Global Burden of Disease study 2016. Lancet 2018; 392: 1015–1035. [DOI] [PMC free article] [PubMed] [Google Scholar]
- 36. Brown K. F., Rumgay H., Dunlop C., Ryan M., Quartly F., Cox A., et al The fraction of cancer attributable to modifiable risk factors in England, Wales, Scotland, Northern Ireland, and the United Kingdom in 2015. Br J Cancer 2018; 23: 1. [DOI] [PMC free article] [PubMed] [Google Scholar]
- 37. Jones L., Bellis M. Updating England‐Specific Alcohol‐Attributable fractions. Liverpool, UK: John Moores University/Centre for Public Health; 2013. [Google Scholar]
- 38. Angus C, Holmes J, Brennan A, Meier PS. Model‐based Appraisal of the Comparative Impact of Minimum Unit Pricing and Taxation Policies in Wales: Final Report. Cardiff, UK: Welsh Government; 2018.
- 39. Angus C., Holmes J., Pryce R., Meier P., Brennan A. Model‐based appraisal of the comparative impact of Minimum Unit Pricing and taxation policies in Scotland. Sheffield, UK: University of Sheffield; 2016. [Google Scholar]
- 40. Trias‐Llimós S., Kunst A. E., Jasilionis D., Janssen F. The contribution of alcohol to the east‐West life expectancy gap in Europe from 1990 onward. Int J Epidemiol 2017; 8; 10.1093/ije/dyx244. [DOI] [PubMed] [Google Scholar]
- 41. Tarkiainen L., Martikainen P., Laaksonen M. The contribution of education, social class and economic activity to the income‐mortality association in alcohol‐related and other mortality in Finland in 1988–2012. Addiction 2016; 111: 456–464. [DOI] [PubMed] [Google Scholar]
- 42. Koch M. B., Diderichsen F., Grønbæk M., Juel K. What is the association of smoking and alcohol use with the increase in social inequality in mortality in Denmark? A nationwide register‐based study. BMJ Open 2015; 5: e006588. [DOI] [PMC free article] [PubMed] [Google Scholar]
- 43. Martikainen P., Mäkelä P., Peltonen R., Myrskylä M. Income differences in life expectancy: the changing contribution of harmful consumption of alcohol and smoking. Epidemiology 2014; 25: 182–190. [DOI] [PubMed] [Google Scholar]
- 44. Östergren O., Martikainen P., Lundberg O. The contribution of alcohol consumption and smoking to educational inequalities in life expectancy among Swedish men and women during 1991–2008. Int J Public Health 2018; 63: 41–48. [DOI] [PMC free article] [PubMed] [Google Scholar]
- 45. Östergren O., Martikainen P., Tarkiainen L., Elstad J. I., Brønnum‐Hansen H. Contribution of smoking and alcohol consumption to income differences in life expectancy: evidence using Danish, Finnish, Norwegian and Swedish register data. J Epidemiol Community Health 2019; 73: 334–339. [DOI] [PMC free article] [PubMed] [Google Scholar]
Associated Data
This section collects any data citations, data availability statements, or supplementary materials included in this article.
Supplementary Materials
Figure S1 Age distribution of a broader definition of alcohol‐specific deaths (Panel A) and deaths from all other causes (Panel B) by deprivation (2001–16 data pooled)
Table S1 Trends in life expectancy and standard deviation in age of death from age 18 and the contribution of alcohol to this under a broader definition of ‘alcohol‐specific’ – males
Table S2 Trends in life expectancy and standard deviation in age of death from age 18 and the contribution of alcohol to this under a broader definition of ‘alcohol‐specific’ – females
Figure S2 Trends in life expectancy (panel A) and standard deviation of age at death (panel B) with and without the contribution of a broader definition of alcohol‐specific causes, represented by the shaded areas, by sex and IMD quintile
Figure S3 Trends in the contribution of a broader definition of alcohol‐specific causes to the inequality gap between highest and lowest deprivation groups in life expectancy and standard deviation of age at death, by sex
Figure S4 Age distribution of alcohol‐specific deaths (Panel A) and deaths from all other causes (Panel B) from ages 0–90 by deprivation (2001–16 data pooled)
Table S3 Trends in life expectancy and standard deviation in age of death from ages 0–90 and the contribution of alcohol to this – males
Table S4 Trends in life expectancy and standard deviation in age of death from ages 0–90 and the contribution of alcohol to this ‐ females
Figure S5 Trends in life expectancy (panel A) and standard deviation of age at death (panel B) from ages 0–90 with and without the contribution of alcohol‐specific causes, represented by the shaded areas, by sex and IMD quintile
Figure S6 Trends in the contribution of alcohol‐specific causes to the inequality gap between highest and lowest deprivation groups in life expectancy and standard deviation of age at death, by sex.