Abstract
Background
Differences in imaging parameters influence computer‐extracted parenchymal enhancement measures from breast MRI.
Purpose
To investigate the effect of differences in dynamic contrast‐enhanced MRI acquisition parameter settings on quantitative parenchymal enhancement of the breast, and to evaluate harmonization of contrast‐enhancement values with respect to flip angle and repetition time.
Study Type
Retrospective.
Phantom/Populations
We modeled parenchymal enhancement using simulations, a phantom, and two cohorts (N = 398 and N = 302) from independent cancer centers.
Sequence Field/Strength
1.5T dynamic contrast‐enhanced T1‐weighted spoiled gradient echo MRI. Vendors: Philips, Siemens, General Electric Medical Systems.
Assessment
We assessed harmonization of parenchymal enhancement in simulations and phantom by varying the MR parameters that influence the amount of T1‐weighting: flip angle (8°–25°) and repetition time (4–12 msec). We calculated the median and interquartile range (IQR) of the enhancement values before and after harmonization. In vivo, we assessed overlap of quantitative parenchymal enhancement in the cohorts before and after harmonization using kernel density estimations. Cohort 1 was scanned with flip angle 20° and repetition time 8 msec; cohort 2 with flip angle 10° and repetition time 6 msec.
Statistical Tests
Paired Wilcoxon signed‐rank‐test of bootstrapped kernel density estimations.
Results
Before harmonization, simulated enhancement values had a median (IQR) of 0.46 (0.34–0.49). After harmonization, the IQR was reduced: median (IQR): 0.44 (0.44–0.45). In the phantom, the IQR also decreased, median (IQR): 0.96 (0.59–1.22) before harmonization, 0.96 (0.91–1.02) after harmonization. Harmonization yielded significantly (P < 0.001) better overlap in parenchymal enhancement between the cohorts: median (IQR) was 0.46 (0.37–0.58) for cohort 1 vs. 0.37 (0.30–0.44) for cohort 2 before harmonization (57% overlap); and 0.35 (0.28–0.43) vs. .0.37 (0.30–0.44) after harmonization (85% overlap).
Data Conclusion
The proposed practical harmonization method enables an accurate comparison between patients scanned with differences in imaging parameters.
Level of Evidence
3
Technical Efficacy Stage
4
DYNAMIC CONTRAST‐ENHANCED magnetic resonance imaging (MRI) is the principal sequence in breast MRI for assessment of breast cancer. 1 Healthy breast parenchymal tissue also demonstrates contrast‐enhancement on MRI. This background parenchymal enhancement (BPE) is increasingly used in the context of cancer diagnosis, prognosis, and risk assessment. 2 , 3
Assessment of breast MRI follows guidelines from the Breast Imaging Reporting and Data System (BI‐RADS). 4 , 5 , 6 , 7 These guidelines address standardization of image acquisition parameters such as the timing of the postcontrast images. 4 They do not, however, address imaging parameter settings such as the values of the flip angle and repetition time (TR). 4 These parameters influence the signal intensity in spoiled gradient echo imaging, the most commonly used imaging technique in breast dynamic contrast‐enhanced MRI. 1 Therefore, differences in parameters will influence computer‐extracted measures from these images. 8
Recently, several researchers suggested computer‐extracted measures to quantify BPE. 9 , 10 , 11 , 12 , 13 , 14 , 15 , 16 , 17 These measurements are inherently sensitive to differences in imaging parameter settings, complicating pooling of results across studies. For example, two studies reporting an association between parenchymal enhancement of the contralateral breast and patient survival used cohort‐specific data‐driven cutoffs. 18 , 19 In a recent prospective multicenter study, computer‐extracted biomarkers based on contrast enhancement needed to be manually adjusted to account for variability in the MRI system and scan protocol. 8 Since it is difficult to prospectively account for all variation in multicenter studies, post‐hoc harmonization of enhancement biomarkers is of interest (ie, the process of achieving a consistent value regardless of imaging protocol).
Taking the above into account, we aimed to investigate the effect of differences in MRI acquisition parameter settings on quantitative parenchymal enhancement. Furthermore, we evaluated a harmonization method to adjust the differences in enhancement caused by differences in parameters.
Material and Methods
Simulation
Contralateral parenchymal enhancement (CPE) is defined as the top 10% relative signal‐enhancement between the first and the last postcontrast scan in dynamic contrast‐enhanced MRI (Fig. 1). 18 We simulated the image intensities of breast parenchymal tissue at three timepoints in a contrast‐enhanced series: precontrast, first postcontrast (eg, 90 seconds after contrast injection), and last postcontrast (eg, 360 seconds after contrast injection) (Fig. 1).
FIGURE 1.
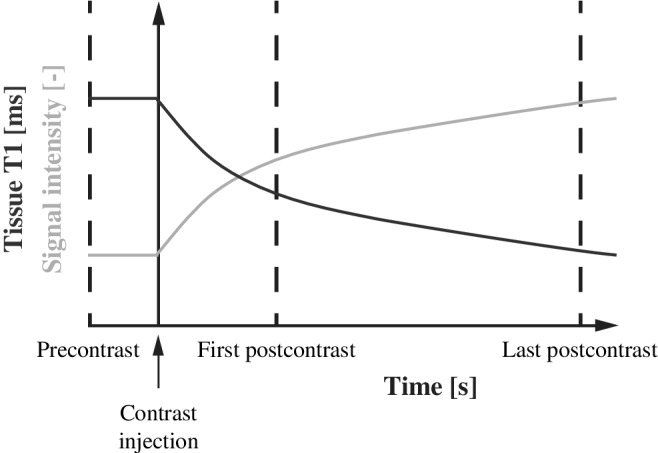
Illustration of the continuous decrease of T1 in the breast parenchyma (vertical axis, blue line) over time (horizontal axis) after contrast injection. As a result of decreasing T1, the signal intensity in these voxels increases (vertical axis, gold line). The parenchymal enhancement biomarker is defined as the top‐10% relative increase between the first and last postcontrast scan.
We simulated the parenchymal tissue at known quantitative T1 values at 1.5T. 20 We modeled the signal of the precontrast parenchyma using 1000 voxel values with a T1 value of 1246 msec. We used a range of T1 values in the postcontrast simulations since the parenchyma typically shows heterogeneity of signal enhancement in response to contrast influx. 21
We chose a T1 ranging from 959–1149 msec for the first postcontrast series, and 597–892 msec for the last postcontrast series. The ranges decrease over time because the concentration of gadolinium after contrast typically continues to increase in parenchymal tissue (Fig. 1).
We simulated the signal using the steady‐state spoiled gradient echo signal equation, 22 and added Gaussian noise to the signal with a signal‐to‐noise ratio (SNR) comparable to our phantom measurements (ie, 25, 28, and 45 for pre‐, first post‐, and last postcontrast, respectively). We simulated this signal using a range of imaging parameter settings resembling those used in clinical protocols: TRs between 4 and 12 msec and flip angles between 8° and 25°. 18 , 23 , 24 , 25 Proton density and TE were kept constant.
We assessed the effect of SNR on the ability to accurately correct parenchymal enhancement. For this, we simulated the precontrast and postcontrast signals with increasing noise levels, and recorded at which noise level the error between the harmonized CPE and the reference CPE (ie, flip angle 10°, TR 4 msec) became higher than 10%.
Furthermore, we assessed the effect of B1 + field inhomogeneities using a similar method, by recording at what field inhomogeneity the error between the harmonized CPE and the reference CPE (ie, flip angle 10°, TR 4 msec) became higher than 10%. We simulated the inhomogeneities using both a bias and deviations from the nominal flip angle. The bias of the simulated B1 + field inhomogeneities was set at 120%, 26 while ranging the absolute deviations from this bias between 0% and 100%. Hence, a B1 + inhomogeneity of 40% refers to a B1 + field ranging between 80% and 160%, with the average at 120%.
Phantom
We measured parenchymal enhancement using a calibrated phantom containing a series of materials with known relaxation times (Test object 5, Eurospin II Test System, Diagnostic Sonar, Edinburgh, UK).
The phantom included a set of 18 calibrated test tubes. Each tube is filled with doped polysaccharide gel and provides specific relaxation times at specified temperatures and magnetic field strengths. We defined three signals using these tubes: one signal consisted of a “precontrast tube” mimicking parenchymal tissue without contrast, and two consisted of “postcontrast tubes” mimicking the gradual decrease of T1 (Fig. 1). We chose the tube calibrated at a T1 of 1246 msec as the precontrast tube. We chose the tubes calibrated at a T1 of 1149, 1023, and 959 msec as the first postcontrast tubes, and the tubes at a T1 of 892, 745, and 597 as the last postcontrast tubes.
We approximated dynamic contrast‐enhanced MRI in the phantom using different tubes at known T1 values. Hence, our timepoints (ie, precontrast, first postcontrast, and last postcontrast) were actually different locations in the MR image. These spatial variations may influence the measurements because of differences in the B1 + field and may therefore influence the adjustment of parenchymal enhancement. We showed the effect of these spatial variations by using the actual flip angle in our harmonization, which was the flip angle multiplied by the scaling of the B1 + field at that location.
MRI
We imaged the phantom using a 1.5T MR unit (Achieva, Philips, Best, The Netherlands). We used a dedicated breast MR coil (SENSE 7 Breast coil, Philips) and performed spoiled gradient echo imaging using the same range of clinically used imaging parameter as in the simulation. 18 , 23 , 24 , 25 Other imaging parameters were: echo time (TE) 1.7 msec, voxel size 1 × 1 × 1 mm3, and image dimension 224 × 224 × 50 voxels. We assessed the SNR of the MR image by measuring the noise of the phantom using a scan without gradients and radiofrequency pulses at TR of 4 msec and flip angle of 10°. 27 We acquired a B1 +‐map to assess the actual flip angle (actual flip angle imaging, TRs 30 and 150 msec, TE 2.4 msec, flip angle 60°, resolution 2 × 2 × 4 mm3). 28
Image Analysis
We automatically extracted the calibrated tubes from the MR image using a threshold based on Otsu's method 29 and labeled them with a connected component analysis, yielding a binary mask per tube. We eroded the binary masks (radius of two voxels) to account for partial volume effects along the borders.
To assess parenchymal enhancement, we used the previously defined signal‐tubes: the precontrast tube, the first postcontrast tubes, and the last postcontrast tubes. From the latter tubes, we randomly sampled the same number of voxels (ie, 5201 voxels) yielding a total of 15,603 voxel values from which we calculated the CPE.
Harmonization of Parenchymal Enhancement
We harmonized parenchymal enhancement for differences in TR and flip angle based on the method proposed by Haacke et al. 22 First, we assessed the T1 value of each voxel in the parenchyma at the postcontrast image 22 :
with:
where S(0) is the signal of the precontrast image, S(t) the signal at the postcontrast image at timepoint t, T1(0) the T1 value in without contrast agent, TR the repetition time, and α the flip angle.
After obtaining T1(t), we calculated the simulated signal in each voxel of the parenchymal tissue as if they were imaged with different repetition time (TRnew) and flip angle (αnew):
We chose a TR of 4 msec and flip angle 10°.
We performed these steps for both the first postcontrast and the last postcontrast signal. From these new adjusted postcontrast signals, the adjusted parenchymal enhancement was calculated using the same CPE definition.
All harmonization steps were performed in Python 3.7.4.
Clinical Data
We evaluated CPE using two previously reported cohorts with a total of 696 patients. 18 , 19 Institutional Review Board (IRB) approvals were obtained for the analyses of patient data 18 , 19 ; written informed consent was obtained 18 or waived by the IRB. 19 Both cohorts solely included patients with unilateral estrogen receptor‐positive/HER2‐negative breast cancer who received a preoperative dynamic contrast‐enhanced T1‐weighted MRI of both breasts. All patients were eligible for breast‐conserving surgery based on conventional imaging and clinical examination (Table 1). CPE was calculated in parenchymal tissue voxels on dynamic contrast‐enhanced MRI, which were automatically segmented in 3D (Fig. 2, see 18 , 19 for implementation details) (Table 1).
TABLE 1.
Patient Characteristics
| Characteristic | Cohort 1 (N = 398) | Cohort 2 (N = 302) |
|---|---|---|
| Age at diagnosis (years) a | 58 (50–64) | 48 (42–57) |
| Largest tumor diameter (cm) a | 1.7 (1.2–2.5) | 1.3 (0.8–1.9) |
| Histological grade (%) | ||
| Grade I | 161 (41) | 26 (9) |
| Grade II | 181 (46) | 106 (35) |
| Grade III | 44 (11) | 157 (52) |
| Unknown | 8 (2) | 13 (4) |
| Progesterone receptor | ||
| Negative | 99 (25) | 49 (16) |
| Positive | 294 (75) | 253 (84) |
| Unknown | 1 (0) | 0 (0) |
| Axillary load (%) | ||
| 0 positive lymph nodes | 265 (67) | 166 (55) |
| 1–3 positive lymph nodes | 101 (26) | 99 (33) |
| 4 or more positive lymph nodes | 24 (6) | 36 (12) |
| Unknown | 4 (1) | 1 (0) |
All patients had unilateral estrogen receptor‐positive/HER2‐negative breast cancer. Values represent number of patients (percentages).
Values represent median value (interquartile range).
FIGURE 2.
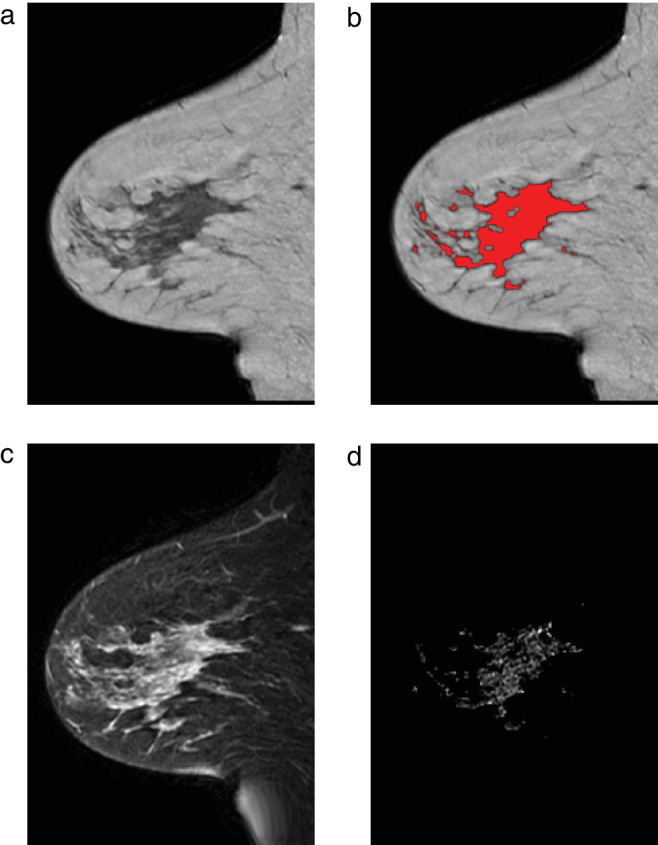
Example of the image processing from cohort 2 in the contralateral breast of a 42‐year‐old patient with an ER‐positive/HER2‐negative invasive ductal carcinoma in the right breast. (a) Sagittal T1‐weighted image. (b) Same image with parenchymal tissue overlaid in red. (c) Fat‐suppressed first postcontrast image. (d) Enhancement in the parenchymal tissue segmentation.
Notable differences in MRI acquisition between these two patient cohorts were the discrepancies in vendor, flip angle, and TR. Cohort 1 was scanned on a Siemens MR unit with TR of 8.0 msec and flip angle of 20°, whereas cohort 2 was scanned on a General Electric Medical Systems (Milwaukee, WI) MR unit with TR of 6.0 msec and flip angle 10° (Table 2).
TABLE 2.
MRI Characteristics
| Characteristic | Cohort 1 (N = 398) | Cohort 2 (N = 302) |
|---|---|---|
| Field strength (T) | 1.5 | 1.5 |
| Vendor | Siemens | General Electric Medical Systems |
| Sequence | Spoiled gradient echo | Spoiled gradient echo |
| Repetition time (msec) | 8.0 | 6.0 |
| Echo time (msec) | 4.0 | 4.2 |
| Flip angle (°) | 20 | 10 |
| Contrast agent | Prohance (Bracco‐Byk Gulden) | Magnevist (Bayer Health Care Pharmaceuticals) |
| Injected dose (mmol/kg) | 0.1 | 0.1 |
| Duration of dynamic contrast‐enhanced series (s) | 360 | 360 |
| Voxel size (mm3) | 1.35 × 1.35 × 1.35 | 0.7 × 0.7 × 3.0 |
| Matrix size | 256 × 256 × 100 | 256 × 256 × 100 |
| Fat suppression | No | Yes |
To assess whether our clinical data have the required SNR for harmonization, we calculated the SNR in the parenchymal tissue using manual annotations in 10 patients (Table 3). The signal was assessed in the parenchymal tissue of the first postcontrast image; the noise was assessed as a Rician distribution in the air. 30
TABLE 3.
Signal‐to‐Noise Ratios in 10 Patients From Cohort 1
| Patient Study ID | SNR |
|---|---|
| 1 | 15.4 |
| 2 | 11.2 |
| 3 | 13.5 |
| 4 | 15.1 |
| 5 | 13.8 |
| 6 | 18.3 |
| 7 | 21.4 |
| 8 | 15.0 |
| 9 | 17.1 |
| 10 | 17.7 |
| Mean (SD) | 15.9 (2.7) |
Statistical Analysis
We assessed the effect of harmonization on the simulations and phantom using the median and interquartile range (IQR). We tested the similarity of the CPE distributions in the two cohorts using the overlap of the kernel density estimations, 31 and tested the improvement of overlap after harmonization using the paired Wilcoxon signed rank test after bootstrapping. We considered the results statistically significant when the two‐sided P‐value was under 0.05. Statistical analyses were performed using R 3.6.1. (R Foundation for Statistical Computing, Vienna, Austria).
Results
Simulation
As shown in Fig. 3, the simulated parenchymal enhancement increased with increasing flip angle and decreased with increasing TR. Before harmonization, simulated parenchymal enhancement values had a median (IQR) value of 0.46 (0.34–0.49). After harmonization, the IQR reduced: median (IQR): 0.44 (0.44–0.45) (Fig. 3).
FIGURE 3.
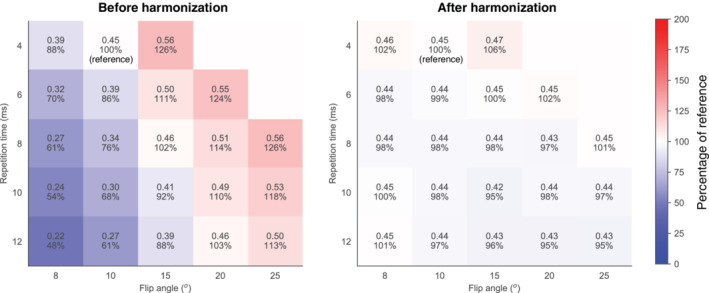
Parenchymal enhancement simulated at various flip angles and TRs before (left) and after harmonization (right). The reference situation was at flip angle of 10° and TR of 4 msec. The median (interquartile range (IQR)) of the simulations was 0.46 (0.34–0.54) before harmonization (left image) and 0.44 (0.44–0.46) after harmonization (right image). The colors are based on the percentages compared to the reference.
The error to the reference parenchymal enhancement value (flip angle 10°, TR 4 msec) after harmonization was lower than 10% in most clinically used parameter settings for commonly used SNRs (Fig. 4) and for clinically expected B1 + field inhomogeneities (Fig. 5).
FIGURE 4.
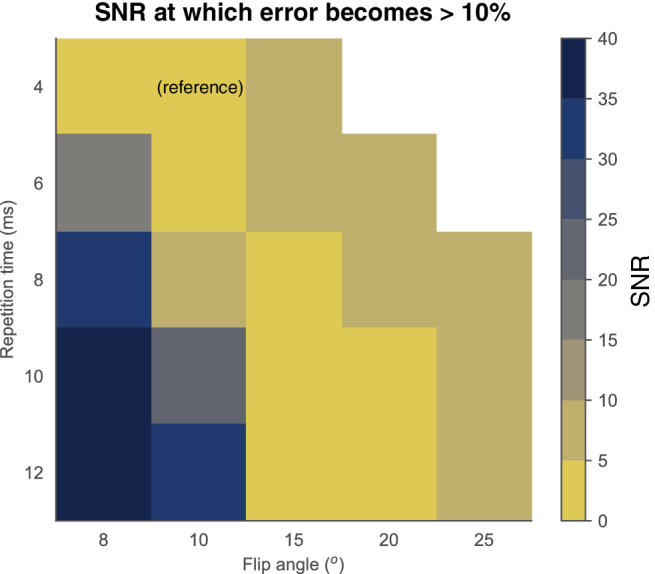
Minimum required SNRs to be able to harmonize simulated parenchymal enhancement to the reference (flip angle 10°, TR 4 msec). Acceptable limits were chosen at 10% error from the reference. It is feasible to adjust parenchymal enhancement to the reference if the SNR is higher than 5 to 10 (yellow diagonal band).
FIGURE 5.
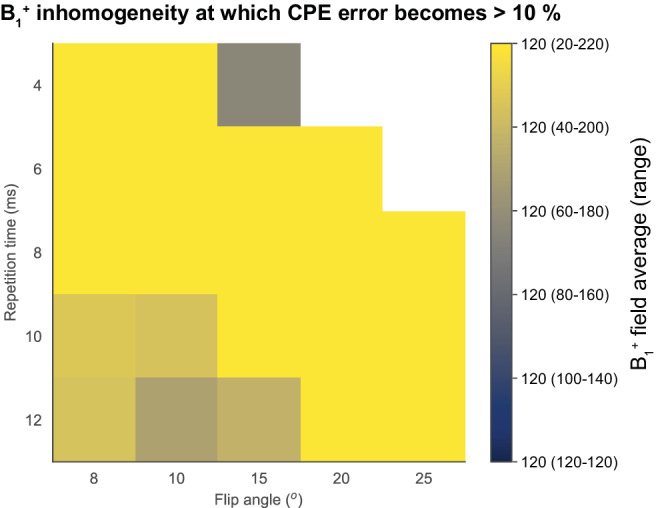
B1 + field inhomogeneities at which the harmonization error of the simulated parenchymal enhancement to the reference (flip angle 10°, TR 4 msec) exceeds the accepted limit. The acceptable limit was chosen at 10% error from the reference. Note that in the bright yellow band, harmonization of parenchymal enhancement to the reference was possible for all simulated B1 + inhomogeneities.
Phantom
We observed similar behavior in the phantom as in the simulation: signal enhancement values increased with increasing flip angle and decreased with increasing TR (Fig. 6).
FIGURE 6.
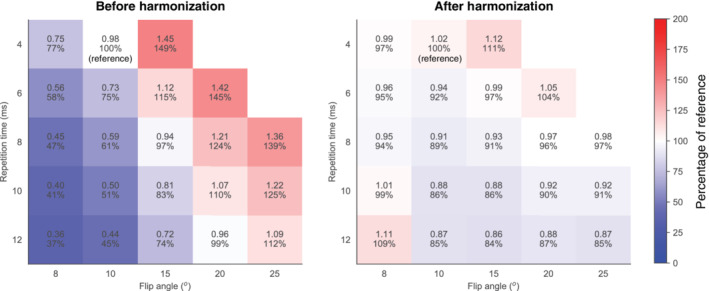
Parenchymal enhancement measured in the phantom at various flip angles and TRs before (left) and after harmonization (right). The reference situation was at flip angle of 10° and TR of 4 msec. The median (IQR) of the measurements was 0.96 (0.59–1.22) before harmonization (left figure) and 0.96 (0.91–1.02) after harmonization and mitigation of B1 + inhomogeneities (right figure). The colors are based on the percentages compared to the reference comparable to Fig. 3.
Before harmonization, signal enhancement values measured in the phantom had a median (IQR) of 0.96 (0.59–1.22). After harmonization, the IQR decreased: median (IQR): 0.91 (0.86–0.98) without mitigating B1 + inhomogeneities, median (IQR): 0.96 (0.91–1.02) with mitigating B1 + inhomogeneities.
The SNR was 25 in the precontrast tube, 28 in the first postcontrast tubes, and 46 in the last postcontrast tubes. The median actual flip angle was above 90% and below 110% in all tubes.
Clinical Data
Consistent with the simulation and phantom, CPE was higher at a flip angle of 20° and TR of 8 msec (cohort 1, median [IQR]: 0.46 [0.37–0.58]) compared to using flip angle of 10° and TR of 6 msec (cohort 2, median [IQR]: 0.37 [0.30–0.44], Fig. 7). After harmonization of cohort 1 to the parameter settings of cohort 2, the distribution in cohort 1 better resembled cohort 2 (median [IQR]: 0.35 [0.28–0.43], Fig. 7). The overlap of the kernel density estimations significantly increased from 57% (95% confidence interval [CI]: 49–63%) to 85% (95% CI: 73–89%) after harmonization (P < 0.001). The mean SNR that we measured in the parenchymal tissue of patients was 15.9 with a standard deviation (SD) of 2.7 (Table 3).
FIGURE 7.
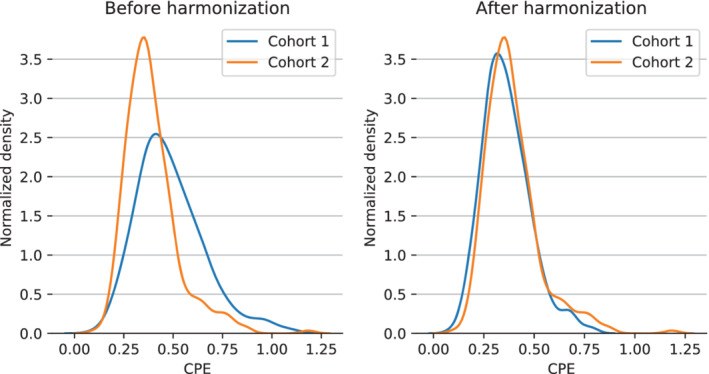
The overlap of the kernel density estimations between contralateral parenchymal enhancement in cohort 1 (n = 394, blue) and cohort 2 (n = 302, orange) significantly increased after harmonization from 57% (left) to 85% (right) (P < 0.001).
Discussion
We demonstrated that harmonization of parenchymal enhancement values is needed to ensure an accurate comparison between patients scanned with different dynamic contrast‐enhanced MRI acquisition parameter settings. We proposed a harmonization method to adjust differences in parenchymal enhancement caused by differences in these parameters. Additionally, we showed that the CPE observed in two patient cohorts was equivalent after harmonization. These results suggest that pooling of data in multi‐institutional studies is feasible after correction of enhancement values.
Differences in image acquisition parameter settings influence computer‐extracted measures of dynamic contrast‐enhanced MRI. 8 In addition to complicating pooling of data across studies, it also complicates correctly classifying prospectively acquired subject data, hindering research into personalized healthcare. Therefore, it is desirable to produce the same value for such biomarkers regardless of acquisition parameters. One way to achieve such harmonization is by strict guidelines or community‐wide harmonization efforts. 4 , 5 While these guidelines are important for established biomarkers, they are unfeasible for relatively novel biomarkers. Only more established biomarkers are likely to receive the required support from the scientific and clinical community to a priori harmonize relevant parameters between centers. Therefore, post‐hoc harmonization of relatively novel biomarkers is of interest.
We provided such harmonization by adjusting the CPE biomarker. 18 , 19 , 32 , 33 We showed that we were able to adjust this biomarker in our simulation with realistic parameter settings. Compared to the simulation, our phantom study showed slightly more variation after harmonization. This may be because the noise levels in our simulations were based on the SNR measurement from our phantom, which was assessed once at a flip angle of 10° and TR of 4 msec. As a result, the noise varies between acquisition settings in our phantom study, where it does not in our simulation. Another reason may be T2*‐effects, which were not addressed by our simulations. To minimize this potential reason, we chose tubes in our phantom with similar T2‐values and we chose our TE as short as possible on our MR system.
In our clinical data, the improved similarity between CPE values in the cohorts after harmonization was in agreement with the simulations for the parameter settings we were adjusting given the SNR in our images. Therefore, even though the SNR of the MR acquisition is often not optimized for parenchymal tissue, harmonization with real patient cohort data still appears feasible.
The proposed harmonization method is relatively straightforward to implement using the provided description and the article from Haacke et al. 22 Although we used seemingly straightforward MR physics, there are several aspects that potentially complicate harmonization of patient data. These aspects include postprocessing on the scanner by vendor software, noise, patient motion, and biological patient variation. It is promising that, in spite of these potential complications, our results show a good harmonization between patient cohorts.
The duration of the dynamic contrast‐enhanced series was comparable in the cohorts. Hence, our study did not investigate the effect of temporal resolution on enhancement features. This is subject to future research. International guidelines prescribe, however, limits to the range of timing in dynamic contrast‐enhanced series. 5 , 34
Different contrast agents have different relaxivity properties that might influence enhancement characteristics. 35 The contrast agents used in our study (Prohance and Magnevist) have, however, similar relaxivity properties. 35
We harmonized the parenchymal enhancement in the contralateral breast. Although we focused on the contralateral breast to exclude cancer‐induced enhancement, the same methodology can be applied to the ipsilateral breast.
The effect of harmonization on other enhancement biomarkers, such as radiomics features extracted from the tumor, 36 , 37 , 38 may also lend themselves to harmonization. In future research, we will investigate the effect of harmonization on these biomarkers.
We chose a model‐based harmonization method. The alternative would be a data‐driven approach. Such approaches exist; for example, by harmonizing given feature distributions, 39 or by harmonizing MR images using deep learning, from which features can then be calculated. 40 Our model‐based approach may have several advantages over data‐driven approaches. First, by using a model‐based approach, one can anticipate the efficacy of the harmonization under different conditions. Second, data‐driven approaches typically require much data. This can be a problem with the prospective use of such methods. For example, in the case of a new MR unit, one needs to gather enough data first in order to perform accurate harmonization.
Limitations
Our study has some limitations. First, we performed our analyses only at 1.5T. Our results may slightly vary at 3T, due to the slightly higher T1 of parenchymal tissue at 3T and the decreased effect of contrast agent at 3T. 20 , 35 However, since the overall behavior of spoiled gradient echo is similar at both field strengths, we expect our results to hold for 3T. Our study shows promising results at B1 + field inhomogeneities that are expected at 1.5T. 26 These inhomogeneities are higher at higher field strengths. 41 Vendors, however, have acknowledged this and updated their systems accordingly. 42
We only gave indirect evidence for the efficacy of the harmonization method in patients. A more direct assessment of the harmonization method in vivo may be a test–retest measurement: scanning the same patient twice or more often with different flip angles and TRs. To fully elucidate the parenchymal enhancement, this would mean scanning the same patient on different days, since clearance of the contrast agent from the body takes ~1 day. 43 , 44 Furthermore, even if all these steps would be taken, there are considerable physiological variations in breast parenchyma that occur from day to day, 45 , 46 rendering it difficult to control such an experiment.
Conclusion
We showed promising results that harmonization of parenchymal enhancement values can enable accurate comparisons between patients scanned with differences in imaging parameters.
Contract grant sponsor: the Dutch Cancer Society (KWF); Contract grant number: 10755.
Level of Evidence Technical Efficacy Stage
REFERENCES
- 1. Kuhl CK. The current status of breast MR imaging part I. Choice of technique, image interpretation, diagnostic accuracy, and transfer to clinical practice. Radiology 2007;244:356‐378. [DOI] [PubMed] [Google Scholar]
- 2. Arasu VA, Miglioretti DL, Sprague BL, et al. Population‐based assessment of the association between magnetic resonance imaging background parenchymal enhancement and future primary breast cancer risk. J Clin Oncol 2019;37:954‐963. [DOI] [PMC free article] [PubMed] [Google Scholar]
- 3. King V, Brooks JD, Bernstein JL, Reiner AS, Pike MC, Morris EA. Background parenchymal enhancement at breast MR imaging and breast cancer risk. Radiology 2011;260:50‐60. [DOI] [PMC free article] [PubMed] [Google Scholar]
- 4.Breast Magnetic Resonance Imaging (MRI) Accreditation Program Requirements. https://www.acraccreditation.org/modalities/breast-mri
- 5. Morris EA, Comstock CE, Lee CH. ACR BI‐RADS magnetic resonance imaging. Reston, VA: American College of Radiology; 2013. [Google Scholar]
- 6. El Khoury M, Lalonde L, David J, Labelle M, Mesurolle B, Trop I. Breast imaging reporting and data system (BI‐RADS) lexicon for breast MRI: Interobserver variability in the description and assignment of BI‐RADS category. Eur J Radiol 2015;84:71‐76. [DOI] [PubMed] [Google Scholar]
- 7. Grimm LJ, Anderson AL, Baker JA, et al. Interobserver variability between breast imagers using the fifth edition of the BI‐RADS MRI lexicon. Am J Roentgenol 2015;204:1120‐1124. [DOI] [PubMed] [Google Scholar]
- 8. Hylton NM, Gatsonis CA, Rosen MA, et al. Neoadjuvant chemotherapy for breast cancer: Functional tumor volume by MR imaging predicts recurrence‐free survival‐results from the ACRIN 6657/CALGB 150007 I‐SPY 1 TRIAL. Radiology 2016;279:44‐55. [DOI] [PMC free article] [PubMed] [Google Scholar]
- 9. Liao GJ, Henze Bancroft LC, Strigel RM, et al. Background parenchymal enhancement on breast MRI: A comprehensive review. J Magn Reson Imaging 2019;51:43‐61. [DOI] [PMC free article] [PubMed] [Google Scholar]
- 10. Wu S, Weinstein SP, DeLeo MJ, et al. Quantitative assessment of background parenchymal enhancement in breast MRI predicts response to risk‐reducing salpingo‐oophorectomy: Preliminary evaluation in a cohort of BRCA1/2 mutation carriers. Breast Cancer Res 2015;17:1‐11. [DOI] [PMC free article] [PubMed] [Google Scholar]
- 11. Hu X, Jiang L, Li Q, Gu Y. Quantitative assessment of background parenchymal enhancement in breast magnetic resonance images predicts the risk of breast cancer. Oncotarget 2017;8:10620‐10627. [DOI] [PMC free article] [PubMed] [Google Scholar]
- 12. You C, Peng W, Zhi W, et al. Association between background parenchymal enhancement and pathologic complete remission throughout the neoadjuvant chemotherapy in breast cancer patients. Transl Oncol 2017;10:786‐792. [DOI] [PMC free article] [PubMed] [Google Scholar]
- 13. Luo J, Johnston BS, Kitsch AE, et al. Ductal carcinoma in situ: Quantitative preoperative breast MR imaging features associated with recurrence after treatment. Radiology 2017;285:788‐797. [DOI] [PMC free article] [PubMed] [Google Scholar]
- 14. Knuttel FM, van der Velden BHM, Loo CE, et al. Prediction model for extensive ductal carcinoma in situ around early‐stage invasive breast cancer. Invest Radiol 2016;51:462‐468. [DOI] [PubMed] [Google Scholar]
- 15. Hattangadi J, Park C, Rembert J, et al. Breast stromal enhancement on MRI is associated with response to neoadjuvant chemotherapy. Am J Roentgenol 2008;190:1630‐1636. [DOI] [PubMed] [Google Scholar]
- 16. Jones EF, Sinha SP, Newitt DC, et al. MRI enhancement in stromal tissue surrounding breast tumors: Association with recurrence free survival following neoadjuvant chemotherapy. PLoS One 2013;8:1‐8. [Google Scholar]
- 17. Vreemann S, Dalmis MU, Bult P, et al. Amount of fibroglandular tissue FGT and background parenchymal enhancement BPE in relation to breast cancer risk and false positives in a breast MRI screening program. Eur Radiol 2019;29:4678‐4690. [DOI] [PMC free article] [PubMed] [Google Scholar]
- 18. van der Velden BHM, Dmitriev I, Loo CE, Pijnappel RM, Gilhuijs KGA. Association between parenchymal enhancement of the contralateral breast in dynamic contrast‐enhanced MR imaging and outcome of patients with unilateral invasive breast cancer. Radiology 2015;276:675‐685. [DOI] [PubMed] [Google Scholar]
- 19. van der Velden BHM, Sutton EJ, Carbonaro LA, Pijnappel RM, Morris EA, Gilhuijs KGA. Contralateral parenchymal enhancement on dynamic contrast‐enhanced MRI reproduces as a biomarker of survival in ER‐positive/HER2‐negative breast cancer patients. Eur Radiol 2018;28:4705‐4716. [DOI] [PMC free article] [PubMed] [Google Scholar]
- 20. Rakow‐Penner R, Daniel B, Yu H, Sawyer‐Glover A, Glover GH. Relaxation times of breast tissue at 1.5T and 3T measured using IDEAL. J Magn Reson Imaging 2006;23:87‐91. [DOI] [PubMed] [Google Scholar]
- 21. Giess CS, Yeh ED, Raza S, Birdwell RL. Background parenchymal enhancement at breast MR imaging: Normal patterns, diagnostic challenges, and potential for false‐positive and false‐negative interpretation. Radiographics 2014;34:234‐247. [DOI] [PubMed] [Google Scholar]
- 22. Haacke EM, Filleti CL, Gattu R, et al. New algorithm for quantifying vascular changes in dynamic contrast‐enhanced MRI independent of absolute T1 values. Magn Reson Med 2007;58:463‐472. [DOI] [PubMed] [Google Scholar]
- 23. Kim S‐Y, Cho N, Park I‐A, et al. Dynamic contrast‐enhanced breast MRI for evaluating residual tumor size after neoadjuvant chemotherapy. Radiology 2018;289:327‐334. [DOI] [PubMed] [Google Scholar]
- 24. Hegenscheid K, Schmidt CO, Seipel R, et al. Normal breast parenchyma: Contrast enhancement kinetics at dynamic MR mammography—Influence of anthropometric measures and menopausal status. Radiology 2013;266:72‐80. [DOI] [PubMed] [Google Scholar]
- 25. Chan S, Su M‐YL, Lei F‐J, et al. Menstrual cycle–related fluctuations in breast density measured by using three‐dimensional MR imaging. Radiology 2011;261:744‐751. [DOI] [PMC free article] [PubMed] [Google Scholar]
- 26. Tsai W‐C, Kao K‐J, Chang K‐M, et al. B 1 field correction of T1 estimation should be considered for breast dynamic contrast‐enhanced MR imaging even at 1.5T. Radiology 2017;282:55‐62. [DOI] [PubMed] [Google Scholar]
- 27. Dietrich O, Raya JG, Reeder SB, Reiser MF, Schoenberg SO. Measurement of signal‐to‐noise ratios in MR images: Influence of multichannel coils, parallel imaging, and reconstruction filters. J Magn Reson Imaging 2007;26:375‐385. [DOI] [PubMed] [Google Scholar]
- 28. Yarnykh VL. Actual flip‐angle imaging in the pulsed steady state: A method for rapid three‐dimensional mapping of the transmitted radiofrequency field. Magn Reson Med 2007;57:192‐200. [DOI] [PubMed] [Google Scholar]
- 29. Otsu N. A threshold selection method from gray‐level histograms. IEEE Trans Syst Man Cybern 1979;SMC‐9:62‐66. [Google Scholar]
- 30. Gudbjartsson H, Patz S. The Rician distribution of noisy MRI data. Magn Reson Med 1995;34:910‐914. [DOI] [PMC free article] [PubMed] [Google Scholar]
- 31. Pastore M. Overlapping: A R package for estimating overlapping in empirical distributions software • review • repository • archive. J Open Source Softw 2018;3:1‐4. [Google Scholar]
- 32. van der Velden BHM, Elias SG, Bismeijer T, et al. Complementary value of contralateral parenchymal enhancement on DCE‐MRI to prognostic models and molecular assays in high‐risk ER+/HER2− breast cancer. Clin Cancer Res 2017;23:6505‐6515. [DOI] [PubMed] [Google Scholar]
- 33. van der Velden BHM, Bismeijer T, Canisius S, et al. Are contralateral parenchymal enhancement on dynamic contrast‐enhanced MRI and genomic ER‐pathway activity in ER‐positive/HER2‐negative breast cancer related? Eur J Radiol 2019;121:1‐6. [DOI] [PubMed] [Google Scholar]
- 34. Mann RM, Kuhl CK, Kinkel K, Boetes C. Breast MRI: Guidelines from the European Society of Breast Imaging. Eur Radiol 2008;18:1307‐1318. [DOI] [PMC free article] [PubMed] [Google Scholar]
- 35. Rohrer M, Bauer H, Mintorovitch J, Requardt M, Weinmann H‐J. Comparison of magnetic properties of MRI contrast media solutions at different magnetic field strengths. Invest Radiol 2005;40:715‐724. [DOI] [PubMed] [Google Scholar]
- 36. Valdora F, Houssami N, Rossi F, Calabrese M, Tagliafico AS. Rapid review: Radiomics and breast cancer. Breast Cancer Res Treat 2018;169:217‐229. [DOI] [PubMed] [Google Scholar]
- 37. Chitalia RD, Kontos D. Role of texture analysis in breast MRI as a cancer biomarker: A review. J Magn Reson Imaging 2019;49:927‐938. [DOI] [PMC free article] [PubMed] [Google Scholar]
- 38. Chan HM, van der Velden BHM, Loo CE, Gilhuijs KGA. Eigentumors for prediction of treatment failure in patients with early‐stage breast cancer using dynamic contrast‐enhanced MRI: A feasibility study. Phys Med Biol 2017;62:6467‐6485. [DOI] [PubMed] [Google Scholar]
- 39. Whitney HM, Li H, Ji Y, Liu P, Giger ML. Harmonization of radiomic features of breast lesions across international DCE‐MRI datasets. J Med Imaging 2020;7:1. [DOI] [PMC free article] [PubMed] [Google Scholar]
- 40. Modanwal G, Vellal A, Buda M, Mazurowski MA. MRI image harmonization using cycle‐consistent generative adversarial network In: Hahn HK, Mazurowski MA, editors. Medical imaging 2020 Computer diagnosis, Vol 11314 Bellingham, WA: SPIE; 2020. p 36. [Google Scholar]
- 41. Kuhl CK, Kooijman H, Gieseke J, Schild HH. Effect of B 1 inhomogeneity on breast MR imaging at 3.0 T. Radiology 2007;244:929‐930. [DOI] [PubMed] [Google Scholar]
- 42. Harvey PR, Hoogeveen RM. Multitransmit parallel RF transmission technology setting the benchmark in clinical high‐field imaging. http://mri‐q.com/uploads/3/4/5/7/34572113/mr_achieva_tx_whitepaper_multitransmit.pdf
- 43. Bellin M‐F, Van Der Molen AJ. Extracellular gadolinium‐based contrast media: An overview. Eur J Radiol 2008;66:160‐167. [DOI] [PubMed] [Google Scholar]
- 44. Aime S, Caravan P. Biodistribution of gadolinium‐based contrast agents, including gadolinium deposition. J Magn Reson Imaging 2009;30:1259‐1267. [DOI] [PMC free article] [PubMed] [Google Scholar]
- 45. Aliu SO, Jones EF, Azziz A, et al. Repeatability of quantitative MRI measurements in normal breast tissue. Transl Oncol 2014;7:130‐137. [DOI] [PMC free article] [PubMed] [Google Scholar]
- 46. Arslan G, Çelik L, Çubuk R, Çelik L, Atasoy MM. Background parenchymal enhancement: Is it just an innocent effect of estrogen on the breast? Diagn Interv Radiol. 2017;23:414‐419. [DOI] [PMC free article] [PubMed] [Google Scholar]


