Abstract
The hypothalamus is composed of many neuropeptidergic cell populations and directs multiple survival behaviors, including defensive responses to threats. However, the relationship between the peptidergic identity of neurons and their roles in behavior remains unclear. Here, we address this issue by studying the function of multiple neuronal populations in the zebrafish hypothalamus during defensive responses to a variety of homeostatic threats. Cellular registration of large-scale neural activity imaging to multiplexed in situ gene expression revealed that neuronal populations encoding behavioral features encompass multiple overlapping sets of neuropeptidergic cell classes. Manipulations of different cell populations showed that multiple sets of peptidergic neurons play similar behavioral roles in this fast-timescale behavior through glutamate co-release and convergent output to spinal-projecting premotor neurons in the brainstem. Our findings demonstrate that homeostatic threats recruit neurons across multiple hypothalamic cell populations, which cooperatively drive robust defensive behaviors.
The vertebrate hypothalamus regulates a variety of behaviors and physiological states to promote survival1,2. The activation of different genetically specified populations of neurons within the hypothalamus can drive specific behaviors, including food-seeking3, water-seeking4, fighting5, thermoregulation6, parental behavior7 or defensive behavior8,9, among others. While these studies suggest that each genetically defined population of neurons in the hypothalamus plays a particular behavioral role2,10, this organization has not been confirmed by recording the natural activity of neurons from multiple cellular populations across multiple behaviors.
Recent studies have approached this problem by analyzing the gene expression of many single neurons after different experiences to match genetically defined populations of neurons with the expression of activity-dependent genes. These efforts have yielded seemingly conflicting results, with some observing a correspondence between cellular identity and behavioral activation11 and others observing limited correspondence12. However, gene expression analyses only identify neurons that are strongly active during a broad time period, which is a particular problem for studies of rapid defensive behaviors such as avoidance or escape. Therefore, determining the correspondence between molecularly defined populations of neurons and their behavioral roles requires simultaneous recording of fast-timescale neural activity from many molecularly defined populations across different behaviors.
Here, we examine these issues by recording and manipulating the activity of multiple populations of neurons in the neuroendocrine hypothalamus of zebrafish as these animals engage in avoidance behaviors in response to different homeostatic threats. Hypothalamic and neuroendocrine neuron classes are well conserved between zebrafish and mammals13, but the optical transparency of larval zebrafish permit noninvasive access to the entire hypothalamus with cellular-resolution calcium imaging techniques14-16.
Results
Rapid defensive responses to multiple homeostatic threats.
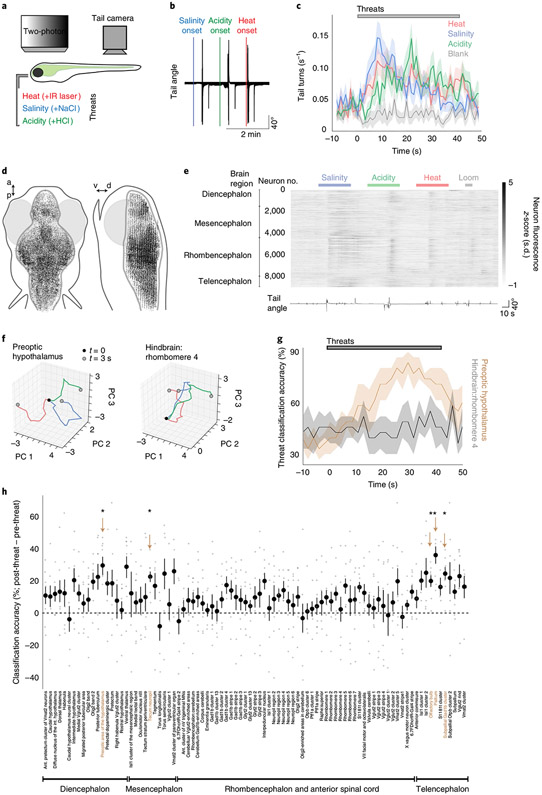
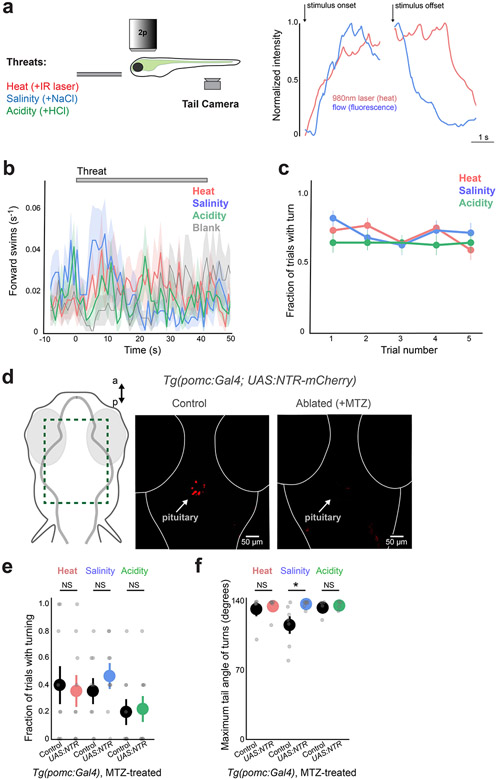
We focused on innate behaviors and neural responses to different types of stimuli that threaten the animal’s homeostasis. We exposed larval zebrafish to homeostatic threats using transient (40 s) increases in water salinity (+50 mM NaCl), acidity (+0.1 mM HCl to pH 4.8) or heat (+7°C). Fish were partially restrained in agarose so that we were able to monitor motor behavior in a configuration compatible with functional neural imaging (Fig. 1a; Extended Data Fig. 1a; Methods). Each threat increased the rate of turning behavior within 20 s of stimulus onset (Fig. 1b,c; salinity: 1.91 ± 0.28 movements; acidity: 1.47 ± 0.31 movements; heat: 1.55 ± 0.28 movements; blank or no stimulus: 0.58 ± 0.24 movements; mean ± s.e.m., N = 57 fish), but did not influence forward swimming (Extended Data Fig. 1b; salinity: 0.28 ± 0.10 movements; acidity: 0.25 ± 0.11 movements; heat: 0.26 ± 0.11 movements; blank or no stimulus: 0.25 ± 0.10 movements; mean ± s.e.m., N = 57 fish), which is consistent with avoidance responses observed in freely moving animals17,18. These responses did not habituate over multiple trials (Extended Data Fig. 1c; five trials per fish, P > 0.1, Wilcoxon signed-rank tests). The similarity between behavioral actions evoked by different threats suggested that zebrafish were executing a common or generic avoidance response. These responses were generally too fast to be caused by hormonal feedback from the hypothalamic–pituitary–adrenal/interrenal axis13, and chemogenetic ablation of corticotrophs in the anterior pituitary19,20—a necessary component of the hormonal stress response—did not disrupt fast behavioral responses to heat, salinity or acidity (Extended Data Fig. 1d-f; all P > 0.4, Mann–Whitney U-tests, corrected for multiple comparisons). We therefore searched for central brain regions that mediate rapid defensive behaviors to different threats.
Fig. 1 ∣. Hypothalamic population dynamics distinguish between avoidance-promoting threats.
a, Schematic of the experiment. Head-restrained larval zebrafish were presented with 40 s of threats (30 s of no-stimulus interval), while tail movements were recorded. b, Tail angle of an example fish during threat presentation, showing turn-like or escape-like movements to each threat type. c, Rate of turning movements evoked by each threat and by a blank stimulus (no change in environment). Data shown as the mean ± s.e.m., 1-s bins, N = 57 fish (average of 5 trials each). d, Top and side projections show location of analyzed neurons from all fish (N = 48,331 cells from 8 fish), registered to a common brain volume. a, anterior; d, dorsal; p, posterior; v, ventral. e, All active neurons recorded by two-photon Ca2+ imaging in an example Tg(elavl3:H2B-GCaMP6s) fish, with the times of threats (above) and tail angle (below) for an example trial (five such trials during imaging experiment). Broad anatomical regions are noted on the left. f, Trajectory of population activity in two anatomical regions of a single example fish. The z-scored and baseline-subtracted time series of the first three principal components (PC 1–3) is shown from the threat onset (black dot) to 3 s later (gray dots) (heat, red; salinity, blue; acidity, green). g, Accuracy of a threat classifier on held-out data, derived from the top ten principal components in two anatomical regions (N = 8 fish, 2-s bins, mean ± s.e.m.). h, Differences in the mean classifier accuracy between the time after threat onset compared with before threat onset across anatomical subregions (N = 8 fish). Arrows and beige text denote regions that are significantly different from zero (two-tailed one-sample t-tests, Benjamini–Hochberg false discovery rate correction for multiple comparisons across all brain regions). *P < 0.05. See Supplementary Table 2 for test statistics.
Hypothalamic populations distinguish between avoidance-promoting threats.
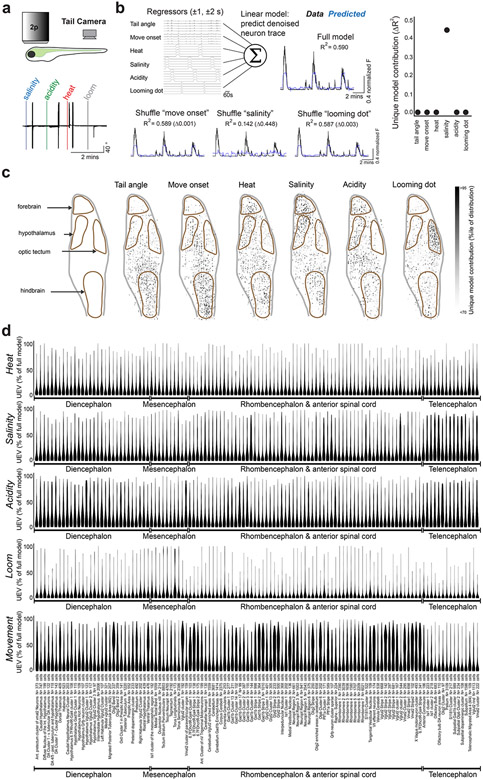
We performed brain-wide two-photon Ca2+ imaging in transgenic fish with pan-neuronal expression of GCaMP6s16 (Tg(elavl3:H2B-GCaMP6s)) as they responded to the onset of homeostatic threats (Fig. 1d,e; Extended Data Fig. 2a; Methods). To provide an avoidance-promoting stimulus that does not threaten homeostasis, we also included a visual looming stimulus21,22. We classified single-cell responses based on linear models of behavioral features and visualized the distribution of feature-encoding neurons by registering each brain volume to a common atlas (Extended Data Figs. 2b-d and 3a,b; N = 48,331 neurons in 8 fish; Methods). This approach reproduced patterns of activity documented in previous studies (Extended Data Fig. 3c,d), including midbrain and hindbrain neurons responsive to swimming movements14,16 and neurons in the optic tectum responsive to looming stimuli21,22. We also found that each homeostatic threat activated neurons in the hypothalamus in addition to neurons throughout the forebrain and hindbrain (Extended Data Fig. 3c,d).
To determine whether these threat-activated brain regions can distinguish between each threat type, we tested the performance of stimulus classifiers trained on the population activity of each brain region. We sorted neurons by anatomical location23 (Extended Data Figs. 2d and 3d) and trained classifiers to distinguish between stimulus types (heat, salinity, acidity and looming dot) based on the temporal principal components of population activity in each region (Fig. 1f,g; Methods). We found that a small number of brain regions showed improved classification during stimulus presentation, including sensory regions associated with the stimuli used in this behavior (olfactory bulb and the retinal-recipient regions of the optic tectum), as well as regions of the pallium/subpallium and preoptic hypothalamus (Fig. 1h; P < 0.05, one-sample t-tests, corrected for multiple comparisons across all brain regions). The zebrafish preoptic hypothalamus is a neurosecretory region homologous to the paraventricular nucleus in the mammalian hypothalamus13,24 and is composed of multiple different neuron populations, many of which are defined by neuropeptide transmitter expression24,25. We therefore asked whether the ability of this brain region to distinguish between threat types is due to specialized encoding of each threat type across different populations of peptidergic neurons.
Cellular registration of neural activity and multiplexed gene expression.
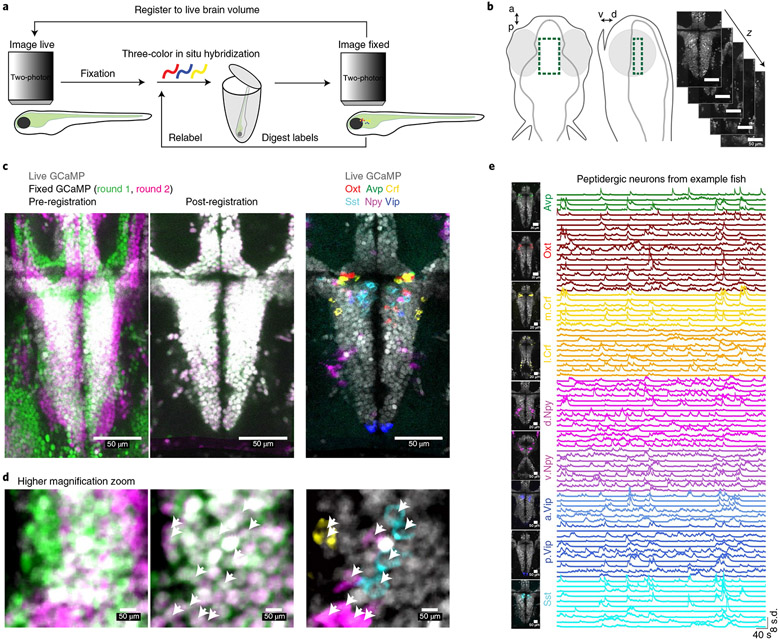
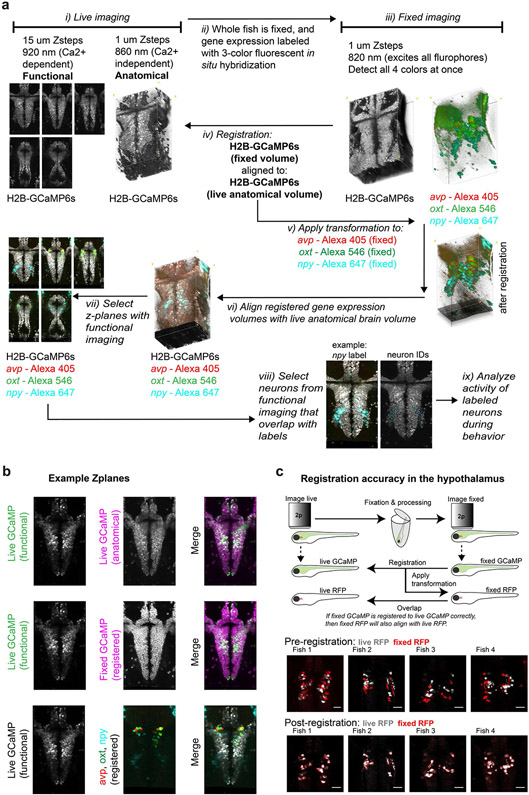
We developed methods to simultaneously image the activity of multiple genetically defined neuronal populations in the hypothalamus of behaving animals by expanding our MultiMAP approach26 to perform cellular-resolution registration of in vivo calcium imaging to in situ multiplexed gene expression (Fig. 2a,b; Extended Data Fig. 4; Methods). We focused on the following classes of neurons genetically defined by the expression of key neuropeptide transmitters common across both the zebrafish preoptic hypothalamus and the homologous mammalian paraventricular hypothalamus (Methods): isotocin/oxytocin (oxt), arginine vasotocin/vasopressin (avp), corticotrophin-releasing factor (crf), neuropeptide-Y (npy), vasoactive intestinal polypeptide (vip) and somatostatin (sst).
Fig. 2∣. Large-scale cellular registration of neural dynamics and neuropeptide gene expression across the hypothalamus.
a, Schematic of the process for registering multiple rounds of multicolor fluorescent in situ hybridization to cellular-resolution live-brain imaging during behavior. b, Location of volumetric two-photon functional imaging encompassing the preoptic hypothalamus (top and side views), and functional imaging z-planes from an example Tg(elavl3:H2B-GCaMP6s) fish. c, Select z-plane images from volumes in an example fish showing live functional imaging (gray GCaMP signal) overlapping with the GCaMP signal after fixation and both rounds of in situ hybridization (left, pre-registration; middle, post-registration) or with in situ hybridization markers of neuropeptides from both rounds (right). Similar results were obtained for N = 7 fish (Extended Data Fig. 5b). d, Same volume as shown in c, but higher magnification of a small area. Arrowheads indicate labeled cells. e, Location of analyzed neurons and fluorescence activity traces of simultaneously recorded labeled neurons in an example fish. Similar activity traces were observed for all N = 7 fish. Crf is split into medial (m.Crf) and lateral (l.Crf) populations. Npy is split into dorsal (d.Npy) and ventral (v.Npy) populations. Vip is split into anterior (a.Vip) and posterior (p.Vip) populations.
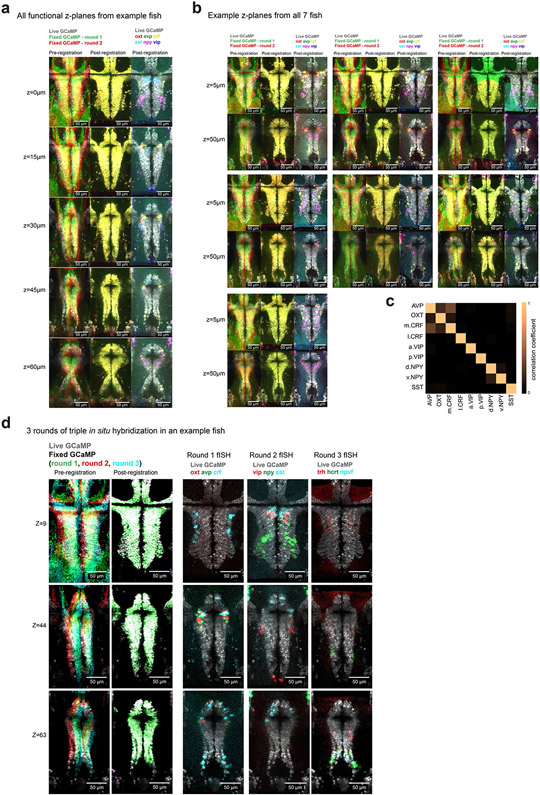
After imaging the hypothalamus of Tg(elavl3:H2B-GCaMP6s) fish during behavior, we fixed each fish and performed multiple rounds of whole-mount three-color fluorescent in situ hybridization27 (Supplementary Table 1). After each round of triple fluorescent in situ hybridization, we imaged the preoptic hypothalamus again to collect volumes of GCaMP+ neurons and in situ hybridization labels of neuropeptide gene expression. We then digested these labels and repeated this procedure (Methods). Our method ensured the preservation of endogenous GCaMP fluorescence throughout the brain after fixation, hybridization, label digestion and relabeling. This stable GCaMP signal—the common cellular label across live and fixed imaging conditions—allowed us to use iterative non-rigid volume registration26,28 to align the fixed brain volumes (and associated in situ hybridization labels) with the live brain volume (and associated neural activity patterns) at cellular resolution (Fig. 2c,d; Extended Data Fig. 4). We were able to overlay six to nine gene expression labels onto the live brain volume for each fish (Fig. 2c,d; Extended Data Fig. 5). We then grouped recorded neurons by their molecular identity and anatomical location within the preoptic hypothalamus and analyzed their activity during behavior (Fig. 2e). Confirming previous studies of larval zebrafish29, we found many co-labeled avp+crf+ neurons around the third ventricle (Extended Data Fig. 5c; 36.4% of avp+ cells were also crf+).
Behavior-specific neural ensembles span multiple hypothalamic cell classes.
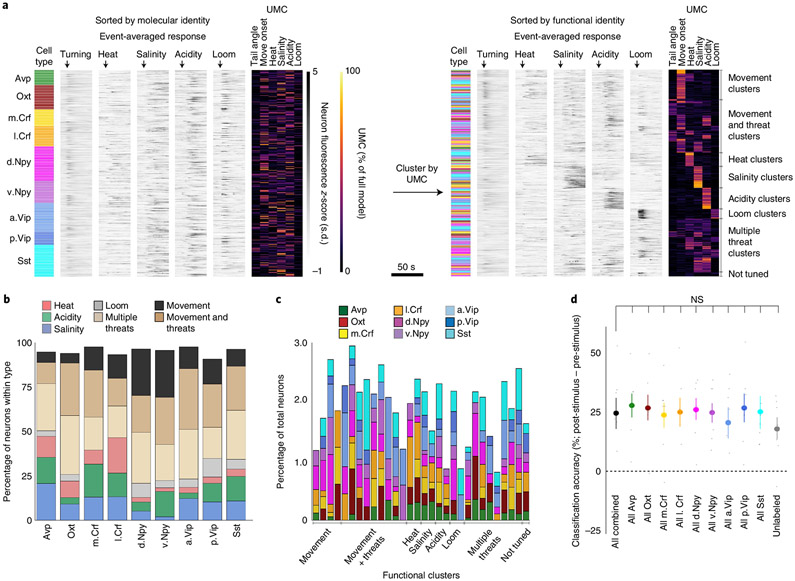
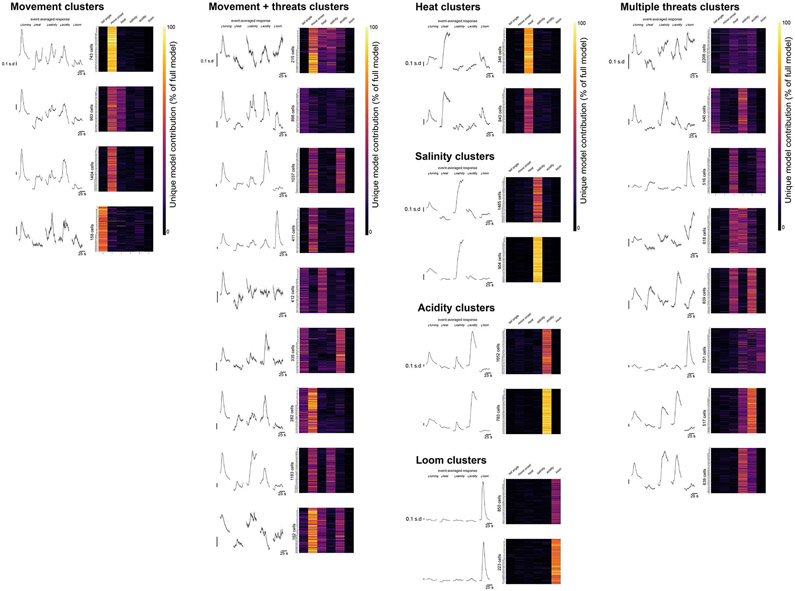
We analyzed the activity of individual molecularly defined neurons using linear models that establish the encoding preference of each neuron based on the unique model contributions (UMCs) of each task component30 (ΔR2; Extended Data Fig. 3b and Methods). We then clustered neurons by their UMC values (Methods) to examine the molecular identity of functionally similar neurons encoding heat, salinity, acidity, looming and/or movement parameters (Fig. 3a; Extended Data Fig. 6). We noted some differences in the distribution of neurons within each peptidergic population (Fig. 3b). A higher percentage of avp+ and crf+ neurons were responsive purely to heat, salinity or acidity (48.5% of avp+ neurons, 40.5% of medial crf+ neurons and 47.7% of lateral crf+ neurons), and many npy+ neurons were purely movement-responsive (26.7% of dorsal npy+ neurons and 27.1% of ventral npy+ neurons). Moreover, most oxt, vip and sst neurons showed mixed selectivity (67.9% of oxt+ neurons, 68.3% of anterior vip+ neurons and 59.2% of sst+ neurons).
Fig. 3 ∣. Behavior-specific neural ensembles span multiple neuropeptidergic hypothalamic populations.
a, All identified peptidergic neurons recorded (N = 452 peptidergic neurons from 28,211 total recorded cells in 7 fish), with the cell population denoted by color, event onset-averaged responses indicated by gray intensity and UMC values from the linear model fit displayed as a heatmap (percentage of full model). Left: neurons were sorted by molecular and anatomical identity. Right: after clustering UMC values, the same neurons were sorted by functional identity (cluster identity written on the right). b, Cluster identities for each molecular and anatomical cell population examined (N = 7 fish, number of neurons in each cell population (from left to right) = 33, 53, 37, 44, 75, 48, 63, 28 and 71). ‘Movement’ encompasses ‘tail angle’ and ‘move onset’ clusters. The ‘not tuned’ cluster is not displayed. c, The cell populations within each functional cluster, plotted as percentage of all neurons in the cluster (including unlabeled neurons). Details of each functional cluster is presented in Extended Data Fig. 6. d, Differences in the mean threat classifier accuracy between the time after threat onset compared with before threat onset across cell populations (N = 7 fish). Data shown for all peptidergic neurons together and with neurons from individual cell classes removed. Data are shown as the mean ± s.e.m., with points representing individual fish. All comparisons are two-tailed t-tests with the ‘All combined’ group (all recorded peptidergic neurons), Benjamini–Hochberg false discovery rate correction for multiple comparisons. NS, not significant, all P > 0.3. See Supplementary Table 2 for test statistics.
Despite these differences, we discovered that neurons responsive to each behavioral feature were distributed across multiple classes of peptidergic neurons. Each peptidergic population was composed of neurons with diverse functional properties (Fig. 3b), and each functionally defined cluster of cells included neurons from multiple peptidergic populations (Fig. 3c). This distributed organization suggests that behavioral features are represented across the total network of peptidergic neurons rather than via specialized encoding in individual cell classes. Indeed, we found that we could classify the threat type from the activity of the entire population of peptidergic neurons, and this was not affected by the removal of any individual population (Fig. 3d; P > 0.3, paired t-tests, corrected for multiple comparisons). By distributing task-encoding neurons across multiple cell classes, this organization may enable robust, reliable execution of defensive behaviors.
Multiple distinct hypothalamic populations have overlapping functional roles.
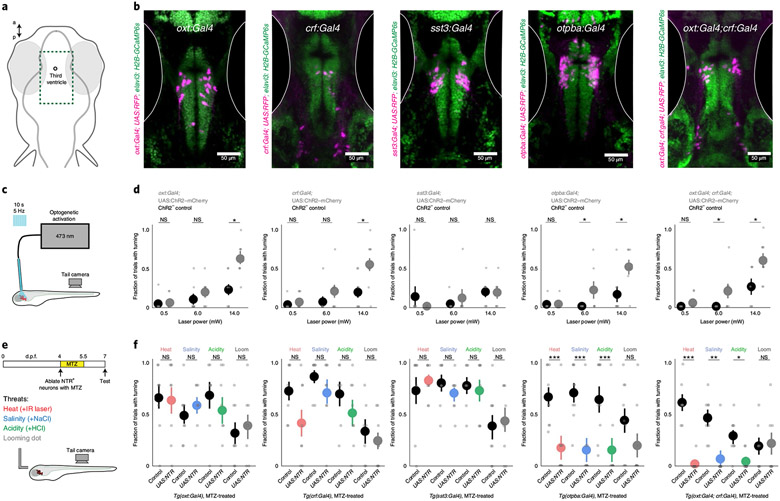
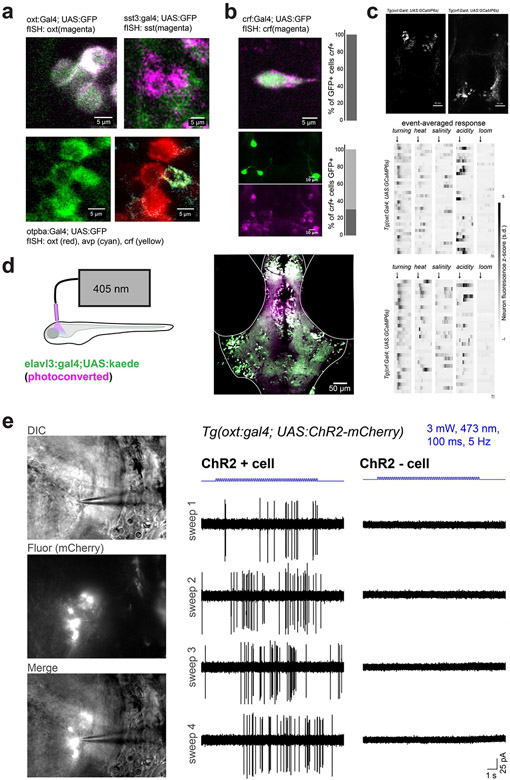
The observation that functional neural assemblies span multiple genetically defined cell classes prompted us to examine the behavioral consequences of manipulating each individual population of neurons. We used transgenic Gal4 lines to drive the expression of exogenous genes in the following specific neuropeptidergic cell populations (Fig. 4a,b; Extended Data Fig. 7a,b): Oxt neurons (Tg(oxt:Gal4)31), Crf neurons (Tg(crf:Gal4); Methods) and Sst neurons (Tg(sst3:Gal4)32). We also used a line for broad expression in hypothalamic Otpba neuroendocrine neurons (Tg(otpba:Gal4)24,33). Population-specific imaging in lines expressing cytosolic GCaMP6s recapitulated the diverse response properties we observed in the MultiMAP experiments (Extended Data Fig. 7c). We first activated neurons in the hypothalamus with focal light stimulation in fish expressing channelrhodopsin-2 (ChR2) in each Gal4 line (Fig. 4c; Extended Data Fig. 7d,e; Methods). Optogenetic activation of Oxt, Crf, Otpba or a combination of Oxt and Crf neurons, but not Sst neurons, produced light-power-dependent increases in the probability of tail-turning behavior (Fig. 4d; 0.5 mW: P > 0.2 for all lines; 6 mW: P < 0.05 for Otpba, and Oxt and Crf; 14 mW: P < 0.05 for Oxt, Crf, Otpba, and Oxt and Crf; Mann–Whitney U-tests, corrected for multiple comparisons).
Fig. 4 ∣. Overlapping functional properties of multiple populations of hypothalamic neurons.
a, Schematic of the location of images in b, encompassing the preoptic hypothalamus. b, The location of Gal4+ neurons in transgenic lines used to target peptidergic cell classes displayed in example fish. Gal4 drives ‘UAS:RFP’ (UAS:NTR–mCherry or UAS:ChR2–mCherry) in a background of Tg(elavl3:H2B-GCaMP6s). This expression pattern was confirmed in at least N = 3 fish per genotype. c, Schematic of the experiment measuring the behavioral response to focal optogenetic activation of the preoptic hypothalamus in the absence of other stimuli. d, Results of optogenetic activation in ChR2+ and ChR2− (control) fish for each Gal4 line. N ((ChR2+, ChR2−), left to right) = (8, 8), (10, 8), (7, 8), (7, 8) and (9, 8). e, Schematic and timeline of the experiment. We applied 10 mM metronidazole (MTZ) for 36 h to ablate NTR+ neurons before testing behavior in response to threats. f, Results of behavioral experiments in NTR+ and NTR− (control) fish for each transgenic line (all treated with MTZ). N ((NTR+, NTR−), left to right) = (8, 8), (8, 7), (8, 8), (9, 9) and (7, 7). For d and f, data are shown as the mean ± s.e.m., with points representing individual fish. One-tailed Mann–Whitney U-tests, Benjamini–Hochberg false discovery rate correction for multiple comparisons within genotype. NS, P > 0.2 (d) or P > 0.1 (f), *P < 0.05, **P < 0.01, ***P < 0.005. See Supplementary Table 2 for test statistics.
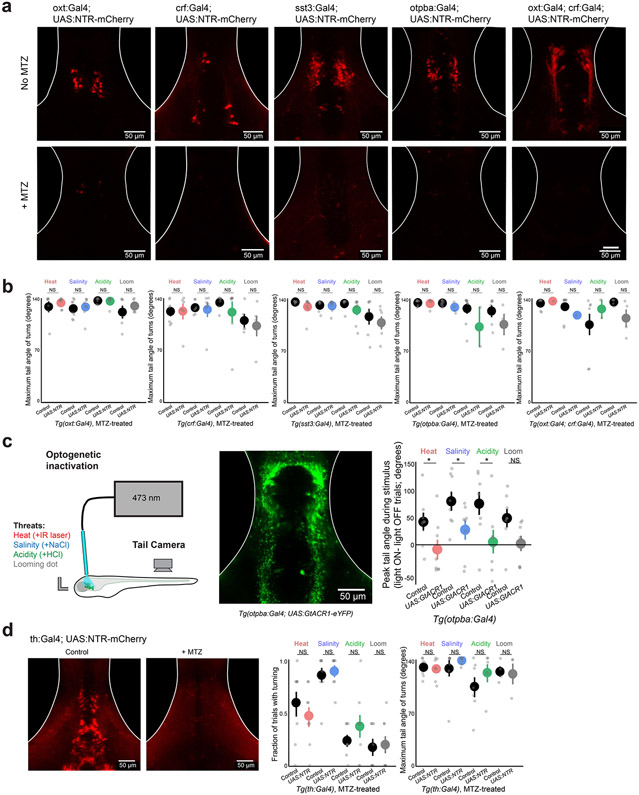
We next tested whether these populations of neurons are required for natural avoidance-like responses to threats. Using conditional chemogenetic ablation of each neuron population in fish expressing nitroreductase in different cell populations20 (Fig. 4e; Extended Data Fig. 8a), we found that behavioral responses to threats were unchanged after ablation of Oxt, Crf or Sst neurons (Fig. 4f; all P > 0.1, Mann–Whitney U-tests, corrected for multiple comparisons). However, ablation of broadly expressing Otpba neurons or a combination of Oxt and Crf neurons reduced the behavioral response to heat, salinity and acidity (all P < 0.05, Mann–Whitney U-tests, corrected for multiple comparisons), but not looming stimuli (Fig. 4f; P > 0.1). Across all conditions, ablation did not disrupt the ability of fish to physically execute large-angle tail movements (Extended Data Fig. 8b; all P > 0.1, Mann–Whitney U-tests, corrected for multiple comparisons). We also observed decreased responses after acute optogenetic inhibition of Otpba neurons expressing the anion-conducting opsin GtACR1 (Extended Data Fig. 8c), but not after ablation of a large population of hypothalamic dopamine neurons in the Tg(th:Gal4) line34 (Extended Data Fig. 8d). Together, these results demonstrate that Oxt and Crf neurons are capable of playing similar, complementary roles in defensive behavior—an organization that ensures a robust pathway for driving the rapid avoidance of homeostatic threats.
Hypothalamic projections to avoidance-promoting premotor neurons.
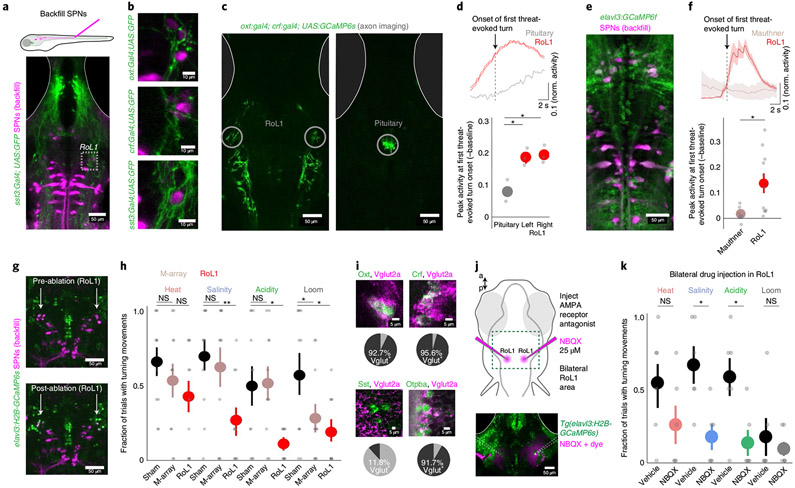
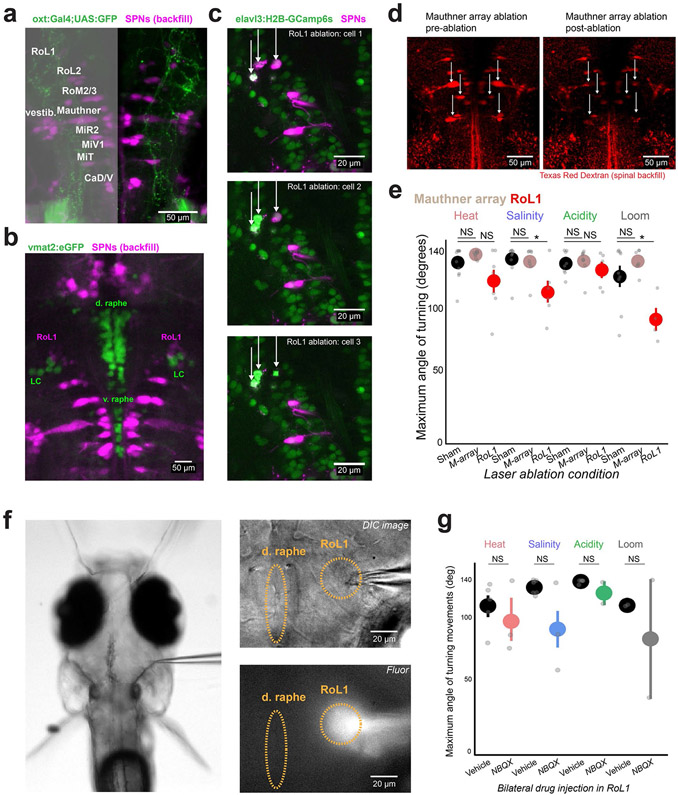
We next searched for shared features of Oxt and Crf neurons that permit their complementary behavioral roles. We looked for potential connections with premotor neurons that project to the spinal cord35,36 by examining green fluorescent protein (GFP)-labeled axons of Oxt, Crf and Sst neurons in relation to retrogradely labeled spinal-projecting neurons (SPNs) in the hindbrain and midbrain (Fig. 5a; Extended Data Fig. 9a). While axons from each set of neurons appeared to ramify throughout the hindbrain region (see also ref. 31), we found prominent convergent projections to a specific set of lateral SPNs known as rostral lateral interneuron 1 (RoL1) cells (Fig. 5b), which appose noradrenergic neurons of the locus coeruleus at their anterior and medial edge (Extended Data Fig. 9b). To assess the functional connection between threat-driven or avoidance-driven hypothalamic neurons and RoL1 cells, we imaged the activity of Oxt and Crf axons around RoL1 cells during behavior in Tg(oxt:Gal4; crf:Gal4; UAS:GCaMP6s) fish (Fig. 5c). We found that axons around RoL1 cells became active before threat-evoked tail turning, whereas ventral-projecting Oxt and Crf axons in the pituitary did not (Fig. 5d). By directly imaging retrogradely labeled SPNs in Tg(elavl3:GCaMP6f) fish16, we found that RoL1 neurons were active at the onset of threat-evoked tail turning, whereas classical escape neurons—the Mauthner cells37— were not (Fig. 5e,f).
Fig. 5 ∣. Hypothalamic outputs are glutamatergic and converge on brainstem neurons required for defensive behavior.
a, SPNs were backfilled with Texas Red dextran in fish expressing GFP in each cell population. A z-projection of an example Tg(sst3:Gal4; UAS:GFP) fish and the region of interest in RoL1 for b. b, Overlap of GFP+ axons with back-labeled RoL1 neurons in each Gal4 line. This expression pattern was observed in N = 3 fish per genotype. c, Two-photon imaging of axon terminals from Tg(oxt:Gal4; crf:Gal4; UAS:GCaMP6s) fish. These z-planes were imaged in N = 3 fish. d, The mean activity of axons in an example fish aligned to the onset of the first turn evoked by salinity, acidity or heat (top). Summary of peak activity in the 2 s around the stimulus onset, normalized (norm.) to the mean fluorescence 2 s before the onset (bottom). N = 3 fish. e, Two-photon imaging of SPNs in Tg(elavl3:GCaMP6f) fish. The volume was imaged in N = 4 fish. f, The mean activity of two SPN cell classes in an example fish aligned to the onset of the first turn evoked by salinity, acidity or heat (top). Summary of peak activity in the 2 s around the stimulus onset, normalized to the mean fluorescence 2 s before the onset (bottom). N = 4 fish, N = 7 and 11 cells. g, Example images from before (top) and after (bottom) bilateral two-photon ablation of backfilled RoL1 neurons (denoted by arrows). Similar results were observed in N = 11 fish (see also Extended Data Fig. 9c). h, Results of behavioral experiments in ablated (RoL1 neurons or Mauthner-array (M-array) neurons) or sham-ablated fish. N = 11 (sham), 11 (M-array) or 10 (RoL1) fish. i, Multicolor fluorescent in situ hybridization showing the overlap of neuropeptide expression (green) with Vglut2a (magenta). The bottom right image shows overlap of Vglut2a (magenta) with GFP expression in Tg(otpba:Gal4;UAS:GFP) fish. The pie charts below the images show the number of peptide+ neurons that are also Vglut2a+ (four sections from two fish each). j, Schematic of the experiment and location of NBQX injection around the RoL1 region (top). Image of drug spread in an example fish visualized by a red dye (bottom). Similar spread was observed for N = 6 injected fish. k, Results of behavioral experiments in RoL1-injected fish (NBQX or vehicle). N = 6 (vehicle) and 6 (NBQX) fish. For d, f, h and k, data are shown as the mean ± s.e.m., with points representing individual fish (d, h and k) or cells (f). Statistical tests were two-tailed paired-sample t-test (d and f) or one-tailed Mann–Whitney U-tests (h and k), all with Benjamini–Hochberg false discovery rate correction for multiple comparisons. NS, all P > 0.1. *P < 0.05, **P < 0.01. See Supplementary Table 2 for test statistics.
To determine whether RoL1 neurons are required for threat-evoked avoidance responses, we selectively removed these neurons (approximately three to five neurons per hemisphere) using two-photon single-cell ablation (Fig. 5g; Extended Data Fig. 9c; Methods). This manipulation reduced the behavioral response to salinity, acidity and looming stimuli (P < 0.05, Mann–Whitney U-tests, corrected for multiple comparisons), whereas ablation of Mauthner neurons and their segmental homologs (Extended Data Fig. 9d) only reduced the response to looming stimuli (Fig. 5h; Extended Data Fig. 9e; P < 0.05, Mann–Whitney U-tests, corrected for multiple comparisons), as previously described22. These data are consistent with recent work showing that Mauthner cell ablation does not disrupt pain-evoked locomotor behavior31, and demonstrates that spinal-projecting RoL1 neurons are an important link between the hypothalamus and the motor system.
Convergent hypothalamic innervation of premotor neurons is glutamatergic.
We next searched for the mechanisms linking the hypothalamus and RoL1 cell activation. While hypothalamic neurons can greatly vary in their production of specialized neuropeptides, these cells can also be more coarsely defined by the co-expression of classical amino acid transmitters such as glutamate or GABA10,11,38. Examining the preoptic hypothalamus around the third ventricle, we found that most oxt+ and crf+ neurons were also vglut2a+ (92.7% and 95.6% vglut2a+, respectively), which suggests that these neurons co-release glutamate, whereas the majority of sst+ neurons were not vglut2a+ (11.8% vglut2a+; Fig. 5i; Methods). We also observed that the majority of preoptic hypothalamus neurons labeled by the Tg(otpba:Gal4) line were glutamatergic (91.7% vglut2a+). Therefore, the peptidergic neuron populations that promoted turning behavior after optogenetic stimulation (Fig. 4d) are capable of co-releasing glutamate. To determine whether RoL1 neurons are driven by glutamatergic input, we tested the behavior of fish after locally applying an ionotropic glutamate receptor blocker bilaterally to the RoL1 region (Fig. 5j; Extended Data Fig. 9f; Methods). Indeed, we found that this manipulation reduced the behavioral response to salinity and acidity (Fig. 5k; Extended Data Fig. 9g; P < 0.05, Mann–Whitney U-test, corrected for multiple comparisons). The residual behavioral response to heat after RoL1 neuron ablation or glutamate receptor blockade may be due to alternative pathways supporting heat-induced movement, such as direct projections from the trigeminal ganglia to the posterior hindbrain39.
Discussion
In this study, we recorded and manipulated multiple populations of hypothalamic neurons to establish correspondence between different classes of peptidergic neurons in the neuroendocrine hypothalamus and their behavioral roles in the rapid avoidance of homeostatic threats. In contrast to elicitation of strict population-specific activity patterns, each individual homeostatic threat recruited broad sets of neurons spanning multiple genetically defined classes of peptidergic neurons.
The manipulation of genetically defined populations of neurons revealed that separate groups of Oxt-expressing and Crf-expressing cells work together to promote this defensive behavior, and that their combined ablation suppresses avoidance responses to each homeostatic threat. We found that distinct populations can implement such concerted behavioral roles because they are both largely glutamatergic and both project to brainstem SPNs that are required for avoidance. These results enrich our understanding of the hypothalamus, adding to studies that have reported specific behavioral roles for individual classes of neurons in different behavioral contexts2,11,13,25,31. Together, this suggests that the hypothalamus is inherently flexible and capable of supporting functional neural assemblies both within and across the boundaries of genetically specified neuron populations.
Several aspects of the functional circuits we describe here are consistent with the known organization of the mammalian hypothalamus. Oxt and Crf neurons in the rodent paraventricular nucleus rapidly respond to acute threats or stressors40,41 and are partially glutamatergic42,43. In addition, stimulation of glutamatergic neurons in the rodent paraventricular nucleus drives escape behaviors9, and rodent paraventricular neurons heavily innervate a brainstem region adjacent to the noradrenergic locus coeruleus44 (‘pre-LC’ region, similar to the location of RoL1 cells in fish). Therefore, the convergent hypothalamus–brainstem projections driving threat avoidance we describe here in zebrafish may be a conserved feature of vertebrate circuits supporting survival behaviors. Future studies using fish and rodents will be important to detail the structure and function of these hypothalamus–brainstem synapses by examining connectivity, vesicular content and neurotransmitter release dynamics through electron microscopy, intracellular recordings and cell-specific transmitter depletion.
When investigating single populations of hypothalamic neurons, both zebrafish and rodent experiments have reported mixed functional properties of cells within these populations18,31,41,45. For instance, studies of Crf18 or Oxt31 neurons in the zebrafish hypothalamus revealed cells with diverse responses to various aversive stimuli and movements; however, these studies also noted similar responses in unlabeled neurons surrounding their cells of interest. By simultaneously recording from multiple populations of peptidergic neurons, our results suggest that the mixed responses observed within individual cellular populations reflect a broader organizing principle in the hypothalamus, whereby behaviorally relevant functional subassemblies of neurons are linked across multiple genetically distinct populations. Future work is required to determine whether these principles extend to a still-greater diversity of hypothalamic regions, neuron classes and behavioral circumstances.
Our brain-wide and hypothalamic-population-specific imaging data both revealed that neural activity patterns are widely distributed across cellular populations and brain areas, even during simple behaviors. While it is unlikely that every neuron active during a given behavior is required for its execution, it is not known whether such distributed activity is an incidental consequence of dense connectivity or reflects an important functional role (for example, enforcing the reliability of common behaviors46 or updating broad networks on current environmental and behavioral information). We found that threat-evoked avoidance behaviors recruit neurons spanning multiple peptidergic populations and that activating some of these populations produces avoidance-like behavior. Moreover, no individual population studied plays an essential role; instead, ablation of multiple hypothalamic cell populations is required to hinder behavioral performance. Thus, only a subset of neural populations active during a given behavior are capable of inducing this behavior, but subpopulations can synergistically act to robustly generate the behavior.
While our results revealed that the activation of hypothalamic neurons across cell classes promotes rapid adaptive behaviors via peptide-independent glutamate release onto brainstem neurons, it is important to note that we observed these phenomena in the context of stimuli that threaten homeostasis, but were relatively simple, short and mild. However, different behavioral contexts might more readily evoke neuropeptide release and thus elicit behavioral responses more dependent on specific peptides and peptide-releasing cells2,11,13,25,31,47. For instance, we hypothesize that changes to salinity, acidity or temperature that are longer, more intense, delivered in a more complex environment or in the context of ongoing stressors may evoke specific behavioral and endocrine adaptations that are supported by neuropeptides.
The existence of multiple context-dependent roles for hypothalamic neurons, and their outputs, suggests that hypothalamic populations are functionally flexible and not organized as dedicated labeled lines. Such multifunctional properties may reflect the evolutionary history of the vertebrate hypothalamus, since ancestral neurosecretory cells in primitive bilaterian nervous systems contribute to sensory detection and motor behavior through both peptide secretion and synaptic transmission48,49. The flexibility of hypothalamic circuits suggests that descriptions of neuron ‘types’ based on static gene expression measurements cannot fully describe the dynamic nature of functional neural groups.
Methods
Zebrafish.
All procedures were approved by the Stanford University Institutional Animal Care and Use Committee. We used larval zebrafish for all experiments in this study, tested at 6–8 days post fertilization (d.p.f.). Animals were group-housed in a standard 14–10-h light–dark cycle, temperature-controlled room and raised according to Zebrafish International Resource Center guidelines. All experiments were conducted during the light period (9:00–18:00). At these stages of development, the sex of zebrafish is not yet defined. Larvae were fed with paramecia (Paramecia Vap) daily from 5 d.p.f. onward. GCaMP imaging was performed with homozygous fish, but otherwise fish were heterozygous for each transgene. We used the following published lines: Tg(elavl3:H2B-GCaMP6s)16, Tg(elavl3:GCaMP6f)16, Tg(elavl3:Gal4)50, Tg(oxt:Gal4)31, Tg(sst3:Gal4)32, Tg(otpba:Gal4)33, Tg(th:p2A-Gal4)34, Tg(UAS:GFP)51, Tg(UAS:ChR2-mCherry)52, Tg(UAS:GtACR1-eYFP)53, Tg(UAS:NTR-mCherry)54, Tg(UAS:Kaede)55 and Tg(vmat2:eGFP)56. For the Tg(crf:Gal4) line, upstream regulatory regions along with first intron of the crhb locus was used to drive the expression of Gal4. F1 generation larvae with hypothalamic expression overlapping endogenous crf were raised to establish the line. The Tg(pomc:Gal4) line was generated using promoter elements described elsewhere19.
Behavioral experiments.
Zebrafish were mounted dorsal side up in a thin layer of 2.5% low-melting-point agarose (Invitrogen) in the lid of a 3-mm petri dish (Fisher), using a sewing needle to position the fish under a stereomicroscope (Leica M80). After agarose solidified (10–15 min), agarose was removed from around the tail posterior to the pectoral fins and around the nose and mouth with a fine scalpel. Fish were then habituated next to the experimental apparatus for at least 20 min in E3 solution (5 mM NaCl, 174 μM KCl, 396 μM CaCl2, 673 μM MgSO4, 1 mM HEPES, with 1 M KOH added to pH 7.2) at room temperature before beginning behavioral testing. During behavioral testing, fish were exposed to a constant flow of E3 solution at 1.5 ml min−1 through a 200-μm opening at the end of a pipette tip, positioned at 20–30° in front of the fish (pointed at the nose and mouth) with a micromanipulator (WPI, M3301L). Flow switched between E3 solution, increased salinity (50 mM NaCl added to E3), increased acidity (HCl (~0.1 mM) or citric acid added to E3 to pH 4.8) or blank (E3), using solenoid pinch valves (Cole Palmer, P/N98302-02) controlled by a digital I/O device (National Instruments, USB-6525). Heat stimuli were delivered using a 980-nm DPSS laser (Changchun New Industries Optoelectronics Technology, MDL-III-980) through a 400-μm 0.48 NA fiber (Doric Lenses) threaded through the flow pipette tip and positioned 1 mm from the nose. This laser was controlled with the analog output of a multifunctional I/O device (National Instruments, USB-6003 or SCB-68A). Heat stimuli were 16 mW when measured from the fiber tip, and were measured as an increase of 7 °C on a thermocouple (Warner Instrument, TC-344B) in E3. Looming stimuli were projected at 60 Hz to a diffusive screen under the fish as three consecutive presentations of expanding black dots on a red background (9 s total) using a Laser Pico Projector (MicroVision) surrounded by three Red Wratten filters (Kodak). Stimuli expanded with the size increasing at a constant approach velocity (0.05 mm to 3 mm over 3 s, using equations from ref. 22). The tail of the fish was illuminated by infrared (IR) lights from above and behind the fish, and tail movements were filmed at 60 frames per s from below with an AVT Manta G031 camera (Allied Vision) through a AF-S DX Micro Nikkor 85 mm f/3.5G ED VR macro lens (Nikon). Stimulus generation and behavioral recording were coordinated via custom Python software. This configuration was used for standalone behavioral experiments and for experiments under the two-photon microscope. Each fish was exposed to five trials. Each trial was 5 min in duration, with constant flow at 1.5 ml min−1, as follows: 60 s of baseline, 40 s of salinity, 30 s of baseline, 40 s of acidity, 30 s of baseline, 40 s of heat, 30 s of baseline, 9 s of looming stimuli, 21 s of baseline.
For ChR2 stimulation experiments, fish were embedded as described above, but without the agarose removed from around the nose. Neurons were stimulated with a 473-nm DPSS laser (OEM laser system, BL-473-00100-CWM-SD-05-LED-0) through a 105-μm 0.22 NA fiber (Doric Lenses) positioned between the eyes at ~80–90° with a micromanipulator (WPI, M3301L), making slight contact with the agarose overlaying the fish. Light was delivered as 100-ms pulses at 5 Hz for 10 s (30–40-s inter-trial interval). For optogenetic inhibition experiments, the same five-trial behavior set up was used as above, and constant blue light (8 mW measured from fiber tip) was delivered between the eyes on trials two and four (out of five) for the entire duration of each stimulus. Optogenetic localization was estimated via the photoconversion of kaede from green to red using 405-nm light (Thorlabs, M405FP1) directed through the optical stimulation fiber between the eyes of a Tg(elavl3:Gal4; UAS:Kaede) fish.
For drug-injection experiments, Tg(elavl3:H2B-GCaMP6s) fish were embedded in agarose with the nose and tail free to move. Fish were transiently anesthetized by cooling and visualized with an upright microscope (Olympus BX51WI) equipped with DIC optics and filter sets for visualizing Texas Red and GCaMP. Glass pipettes were used to make a small incision at the fissure between the optic tectum and lateral cerebellum, approached from the side between the ear and eye on both sides of the fish. A glass pipette with a ~5–10-μm diameter was filled with either NBQX (Tocris, 25 μM in PBS, 1:2,000 dimethylsulfoxide (DMSO), Texas Red dye for visualization) or vehicle (PBS, 1:2,000 DMSO, Texas Red dye for visualization) and inserted into the brain, starting in the fissure between the tectum and lateral cerebellum. We used a fresh pipette for each fish to minimize clogging. Under visual guidance, the pipette tip was placed around the RoL1 cell bodies, lateral to the raphe nucleus (visualized with a H2B-GCaMP label), and drug was pressure ejected. Injection extent was monitored by observing Texas Red fluorescence, and the pipette was removed once the RoL1 region was covered in fluorescence. The fish was then rotated and injected on the other side. Fish were allowed to recover for 5–10 min before the behavior experiment was initiated. All fish were confirmed to be capable of movement by checking for tap-evoked startle.
Two-photon Ca2+ imaging.
Two-photon Ca2+ imaging was performed with an Olympus FVMPE multiphoton microscope (Olympus), with a resonant scanner in bidirectional scanning mode. For brain-wide live imaging at 920 nm, we used a ×16 objective (0.8 NA; Nikon) at ×1.1 zoom in 14 z-planes, cropped to 512 × 305 pixels, separated by 15 μm, at 2 volumes per s (2,800 volumes). After completion of behavior and functional brain imaging, a structural stack was obtained at 820 nm, with 1-μm spacing and ×16 frame averaging, starting 15 μm above the first z-plane, ending 15 μm below the last z-plane, and repeated twice. For hypothalamus imaging at 920 nm, we used a ×25 objective (1.05 NA; Olympus) at ×2 zoom in 5 z-planes, cropped to 512 × 305 pixels, separated by 15 μm, at 4 volumes per s (6,500 volumes). After completion of behavior and functional brain imaging, a structural stack was obtained at 820 nm, with 1-μm spacing and ×16 frame averaging, starting 15 μm above the first z-plane, ending 15 μm below the last z-plane, and repeated twice. For SPN imaging, we used a ×25 objective (1.05 NA; Olympus) at ×1.2 zoom in 6 z-planes, cropped to 512 × 305 pixels, separated by 20 μm, at 4 volumes per s (5,500 volumes). For imaging somatic cytosolic GCaMP6s, we used a ×16 objective (0.8 NA; Nikon) at ×3 zoom in 2 z-planes, cropped to 512 × 307 pixels, separated by 10 μm, at 5 volumes per s (8,500 volumes). For imaging axonal cytosolic GCaMP6s, we used a ×25 objective (1.05 NA; Olympus) at ×1.5 zoom in 2 z-planes, cropped to 512 × 375 pixels, separated by ~80–100 μm, at 4 volumes per s (6,500 volumes).
Fluorescent in situ hybridization.
To eliminate the need for probe optimization and to suppress background signal, we designed hybridization probes according to the split initiator approach of third-generation in situ hybridization chain reaction HCR v.3.0 (ref. 27). Even and odd 22–25-nucleotide DNA antisense oligonucleotide pairs carrying split B1, B3 or B5 initiation sequences were tiled across the length of the mRNA transcript, synthesized by Integrated DNA Technologies and used without further purification. Dye-conjugated hairpins (B1-647, B3-546 and B5-405) were purchased from Molecular Technologies. Zebrafish were fixed overnight in 4% paraformaldehyde in 1× PBST at 4 °C. After washing (3 times in 1× PBST, 5 min each), larvae were permeabilized for 10 min in 100% (v/v) methanol at −20 °C and then rehydrated (50% (v/v) methanol, 25% (v/v) methanol, then in 2× SSCT; 5 min each). Hybridization with split probes was performed overnight in 2× SSCT, 10% (v/v) dextran sulfate, 10% (v/v) formamide at a probe concentration of 4 nM. The next day, larvae were washed (3 times in 2× SSCT, 30% (v/v) formamide at 37 °C then 2 times in 2× SSCT at room temperature; 20 min each) then incubated in amplification buffer (5× SSCT, 10% (v/v) dextran sulfate). During this time, dye-conjugated hairpins were heated to 95 °C for 1 min then snap-cooled on ice. Hairpin amplification was performed by incubating individual zebrafish in 50 μl of amplification buffer with B1, B3 and B5 probes at concentrations of 240 nM overnight in the dark. Samples were washed 3 times with 5× SSCT for 20 min each, then samples were mounted in 2–3% low-melting-point agarose, covered in 2× SSCT or PBS, and immediately imaged under the two-photon microscope. All four channels were simultaneously imaged in unidirectional resonant scanning mode (16× line average) at 820 nm.
To perform multiple-round HCR v.3.0, after imaging larvae were excised and kept in agarose blocks and digested overnight in DNase I (0.2 units per μl) at room temperature. Following 3 rounds of washing with 2× SSCT for 1 h each, hybridization and amplification were performed with the same protocol as the first step. We performed multiple-round HCR fluorescent in situ hybridization with the following combination of probe sets: (round 1) AVP-B1/CRH-B3/OXT-B5; (round 2) NPY-B1/VIP-B3/SST-B5; (round 3) HCRT-B1/NPVF-B3/TRH-B5. The list of probes (avp, oxt, crf, sst, npy, vip, hcrt, npvf, trh and vglut2a) is presented in Supplementary Table 1. For counting neurons that are dual vglut2a+ and peptide+, four images of the preoptic hypothalamus were collected from two animals in each group, from top-down two-photon scans at 820 nm. Neurons were counted from 100 μm × 100 μm areas around the third ventricle. Neuron counts for each sample are as follows (number of vglut2a+ peptide+/number of peptide+): Tg(otopba:Gal4; UAS:GFP)): 25/27 cells, 12/13 cells, 5/7 cells, 13/13 cells (total = 55/60 cells); oxt: 5/8 cells, 20/20 cells, 16/17 cells, 10/10 cells (total = 51/55 cells); crf: 10/11 cells, 18/19 cells, 7/7 cells, 9/9 cells (total = 44/46 cells); sst: 0/4 cells, 1/11 cells, 2/12 cells, 1/7 cells (total = 4/34 cells).
Volume registration.
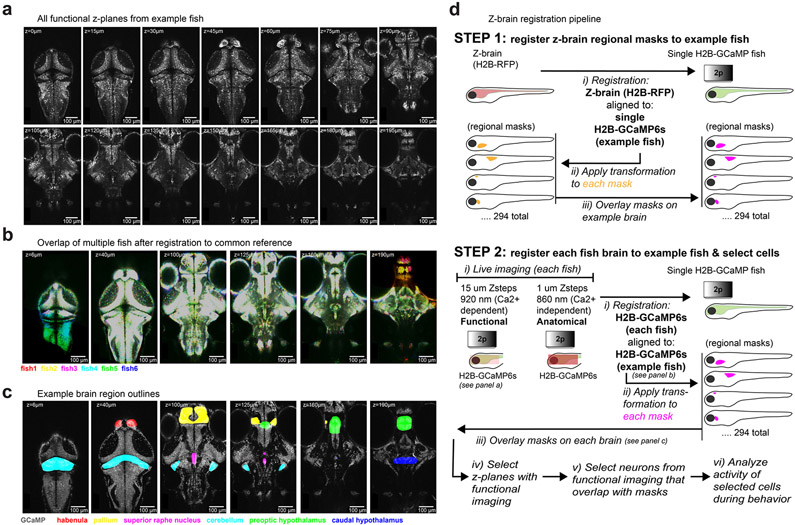
All volume registrations were performed in bright Tg(elavl3:H2B-GCaMP6s) fish. Image volumes were saved as .nrrd files in a mm scale. For brain-wide imaging experiments, all anatomical brain volumes were registered to a common ‘bridge brain’ volume from an exemplar fish. Using the Z-Brain Atlas23, the Tg(elavl3:H2B-RFP) volume and each Z-brain mask (294 in total) were registered to the bridge brain. By moving all neuron coordinates to the same common volume, the identity of neurons in each region could be established with Z-brain mask overlap (Extended Data Fig. 2d). For MultiMAP experiments, volumes of endogenous GCaMP fluorescence from each round of fluorescent in situ hybridization were registered to the live GCaMP anatomical volume in the same fish to match the same cells in both volumes (Extended Data Fig. 4).
Registration was achieved using the Computational Morphometry Toolkit (CMTK)28, using initial affine, affine and b-splines registration steps26. Volumes were registered using CMTK installed on Amazon Web Service’s cloud computing environment (c3.8xlarge instances). Once the final transformation was determined, the transformation coordinates were applied to the fixed GCaMP volume and each of the associated fluorescent in situ hybridization volumes. From each of these volumes now aligned to the live GCaMP volume, z-planes were extracted that corresponded to the z-planes with activity recorded (every 15 μm, from 15-μm below the dorsal extent and 15-μm above the ventral extent). Each z-plane in each fish was manually inspected to ensure cellular-resolution registration before selection of labeled neurons in these planes (Extended Data Fig. 4).
Neurons were selected using custom software in Python, using Bokeh for interactive image processing in a Jupyter notebook. The total number of peptidergic neurons (ordered as (avp, oxt, crf-medial, crf-lateral, npy-dorsal, npy-ventral, vip-anterior, vip-posterior, sst)) identified for each of the 7 fish were: (4, 6, 8, 4, 7, 17, 7, 12, 5), (3, 10, 2, 7, 16, 5, 3, 8, 6), (5, 6, 3, 4, 5, 4, 5, 10, 12), (8, 7, 5, 7, 13, 4, 3, 12, 11), (4, 5, 7, 9, 10, 6, 3, 7, 11), (4, 16, 7, 10, 14, 9, 6, 11, 10) and (5, 3, 5, 3,10, 3, 1, 11, 8). Some avp+ neurons were also crh+, as has been previously reported29.
Chemogenetic neuron ablation.
Fish were sorted for NTR–mCherry expression using an upright fluorescence dissecting microscope (Leica, M165 FC). mCherry+ fish and an equal number of pigment-matched mCherry− clutch mate controls were collected and placed into dishes with E3 containing 10 mM metronidazole (MP Biomedicals, 02155710) at 4 d.p.f., and provided with a drop of paramecia. Dishes were covered in tin foil and removed 36 h later at 5.5 d.p.f. Fish were then inspected to ensure decreased or absent mCherry fluorescence before continuation of experiment. Fish were transferred to standard E3, provided with paramecia and allowed to recover until testing at 7 or 8 d.p.f. (interleaving control and NTR+ fish over the experimental session). Subsets of fish were preserved in paraformaldehyde for subsequent anatomical imaging. Some Tg(otpba:Gal4; UAS:NTR-mCherry) fish showed a distended swim bladder after ablation, as has been previously noted57. However, these fish were still capable of spontaneous locomotion and large-angle turns during agarose fixation (Extended Data Fig. 8b), unlike the locomotor phenotypes observed after ablation of these neurons at earlier stages—a consequence of decreased descending dopaminergic signaling during development57.
Two-photon neuron ablation.
For SPN labeling, Texas Red dextran (10,000 mW, lysine fixable; Invitrogen, D1863) was injected into the spinal cord of 5 d.p.f. Tg(elavl3:H2B-GCaMP6s) fish anesthetized with 0.1% MS-222 (Sigma) and fully embedded in agarose. Fish were cut out of agarose and placed in normal fish system water to recover for 24 h. At 6 d.p.f., successfully labeled fish were mounted in agarose and placed under the two-photon microscope. Relevant Texas Red+ neurons were identified based on morphological properties and were ablated using galvo scanning to focus 780 nm to a small excitation volume around the nucleus. Power was manually increased while monitoring GCaMP and Texas Red fluorescence. Ablation was halted once GCaMP fluorescence sharply increased and Texas Red fluorescence decreased (typically 2–8 s). After each cell was ablated, an anatomical image was taken to monitor the localization and extent of the ablation. If the cell remained, this procedure was repeated until the cell was ablated. If the damage exceeded the extent of the single cell targeted, the fish was not used for subsequent experiments. Sham ablation fish were treated to the same procedure, but imaged at 780 nm without sufficient power to ablate neurons. Successfully ablated and sham ablation fish were cut out of agarose and returned to a petri dish with E3 and provided with paramecia. Fish were tested 24 h later at 7 d.p.f.
In vivo patch-clamp electrophysiology.
Neurons were recorded from 6 d.p.f. Tg(oxt:Gal4; UAS:ChR2-mCherry) fish. Larvae were anesthetized in 0.1% MS-222 (Sigma) and paralyzed with 15 g ml−1 tubocurarine (Sigma-Aldrich T2379) diluted in extracellular recording solution (134 mM NaCl, 2.9 mM KCl, 2.1 mM CaCl2, 1.2 mM MgCl2, 10 mM glucose, 10 mM HEPES, pH 7.8). Fish were then bilaterally enucleated and mounted on the side in 3% low-melting-point agarose to present the preoptic hypothalamus for DIC illumination. A scalpel was used to remove agarose overlaying the diencephalon, and a sharp tungsten needle (Fine Science Tools 10130-20) was used to peel back tissue over the lateral edge of the preoptic area. mCherry+ or mCherry− neurons were visually identified for patching using an upright microscope (Olympus BX51WI) equipped with DIC optics, filter sets for visualizing mCherry and a CCD camera (Q-Imaging RoleraXR). Recording electrodes were glass pipettes with 9–12-MΩ tip resistance and filled with external solution. After reaching a ≥1-GΩ seal, the internal membrane was not ruptured to maintain the cell attached configuration (voltage clamp, no holding voltage). For ChR2–mCherry+ and ChR2–mCherry− neurons, light stimuli were applied with a Spectra X LED light engine (Lumencor) via a 475/35-nm filter and ×40/0.8 NA water-immersion objective (3 mW power measured from objective). Stimuli consisted of two 10-ms pulses separated by 1 s, a 3-s pause, a 10-s light train to match our behavioral stimulation conditions (100-ms pulses at 5 Hz) and another 3-s pause. We only included neurons that showed spontaneous spiking.
Behavioral analysis.
The pixels containing the fish tail were determined in each frame of the tail-monitoring videos using adaptive thresholding and blob detection algorithms in Scikit-image26,58. Tail movements were identified by analyzing the number of tail-containing pixels that did not overlap between adjacent frames. The mean and standard deviation of this value when the tail was motionless was estimated as the median of these statistics within all 300-ms time bins. Tail movements were identified as frames when this value remained 4 standard deviations above baseline for at least 40 ms. Tail movements that were separated by less than 50 ms were merged. To classify movement types, the orientation of the tail was computed for every frame as the angle between a neutral tail position and the major axis of the ellipse fit to second moment of the pixels containing the tail. Movements were then classified as turns or escapes if the maximum angle of deflection exceeded 30° and the maximum velocity of deflection exceeded 1.5° ms−1. These movements were also classified in terms of their peak tail angle (95th percentile of all measured angles within movement). Further analyses were conducted on a binary array that spanned the entire behavioral session, with the times of turn or escape onsets or forward swimming onsets noted as ones. For display purposes in Fig. 1c and Extended Data Fig. 1b, arrays were converted to 1-s bins of movement rate, spanning 10 s before stimulus onset to 10 s after stimulus offset (60 s in total).
Stimulus-driven movement was defined as any turn or escape movement with an onset time within 40 s of threat or stimulus (heat, salinity, acidity or loom) onset. For each fish, the fraction of trials with movement was determined for each stimulus (five trials of each), as well as the peak tail angle of any successful movements to each stimulus. For drug-injection experiments, we used the first four trials because we observed drug washout by the fifth trial. The same metrics were also determined for light-induced movement in ChR2 experiments, but the time frame analyzed was 2 s after light onset until 2 s after light offset (10 s in total). For experiments using optogenetic inhibition of neurons during behavior, we used the difference in the peak tail angle during the first 20 s of the stimulus (mean of light on trials – mean of light off trials).
Two-photon Ca2+ imaging data processing.
Ca2+ imaging data were processed using the CaImAn pipeline59. We performed piecewise motion correction in 128 × 128 pixel patches with a 48 × 48 pixel overlap. Source extraction was performed with an expected neuron size of 4 × 4 pixels (zoomed imaging) or 3 × 3 pixels (whole-brain imaging) using the ‘greedy_roi’ method and patches of 50 × 50 pixels (initialized as 10 components per patch in zoomed imaging and 20 components per patch in whole-brain imaging, merge threshold of 85%). The minimum signal-to-noise for accepting a component was 2.0, with a 90% pixel correlation. Deconvolved fluorescence traces (GCaMP decay of 3.0 s for nuclear-localized indicator, 1.0 s for cytosolic indicator) were then z-scored for further analysis. All behavioral and neural time series were aligned based on the synchronized sampling of camera and microscope frame times and resampled to a common 10 Hz sampling rate.
Linear models of single neuron activity.
Regressors were composed of boxcar functions matching behavioral features and smoothed by an exponentially weighted moving average with a decay of 3 s (approximate decay of fluorescence from H2B-GCaMP6s). The following regressors were used: array of turning and escape movement onsets, salinity stimulus (40 s), acidity stimulus (40 s), heat stimulus (40 s) and looming dot (9 s). In addition, the unsmoothed tail angle was used as a regressor. Five versions of each regressor were produced: the native timing as well as shifted forward and backwards in time by 1 and 2 s. These 30 regressors (6 behavioral features × 5 time permutations) were used in the linear model.
The fluorescence time series for each neuron was fit with a linear model of the regressors using Elastic Net Regression in Scikit-learn (L1 ratio = 0.1, 5 iterations, 5 alpha values and 10× cross-validation), trained on 90% of the data and tested on 10% held-out data. The L1 ratio is a scaling between L1 and L2 penalties (1.0 corresponding to the Lasso regression) and the alpha value is a constant to multiply penalties. After determining the fit of the full model (R2), each set of regressors (all time permutations) were shuffled in time, and this partial model was fit again. Unique model contributions (UMCs) for each task component were defined as the decrease in R2 from the full model to each partial model30, and plotted as the percentage of the full model60. Neurons with improvements in fits after shuffling and/or neurons with very low R2 from the full model were excluded from further analysis. Neurons were clustered by this UMC array using spectral clustering in Scikit-learn (30 clusters, 50 nearest neighbors, k-means label assignment).
Stimulus classification from population activity.
In each fish, populations of neurons in each brain region were defined by molecular identity (MultiMAP experiments) or overlap with a Z-brain region, excluding sensory ganglia, overview regions (“Diencephalon –“, “Mesencephalon –“, “Rhombencephalon –“ and “Telencephalon –“) and regions with fewer than 20 neurons. A low-dimensional representation of each of these populations was obtained by principal components analysis (ten components). For each trial, z-scored temporal components were binned at 2 s, and each time bin of 2 s (10 components) was used to predict trial category (heat, salinity, acidity or loom) using a one-versus-rest classifier (linear support vector classification) trained on 80% of the trials and tested on 20% held-out trials. Brain regions were ranked as the difference in the mean classification accuracy during the time of stimulus onset (the 40 s from stimulus onset to stimulus offset) minus the classification accuracy 10 s before stimulus onset. This same analysis was performed for behavior classification from peptidergic neuron populations, except that the traces of individual neurons were used instead of temporal principal components.
Statistics and software.
No statistical methods were used to predetermine sample sizes, but our sample sizes were similar to those reported in previous publications26,31,58. Experiments were repeated across multiple cohorts of fish, and attempts at replication were successful. Fish within a genotype were randomly assigned to experimental groups for behavioral studies. For different genotypes within a heterogenous clutch of larvae, fish were randomly selected for fluorescence screening then split into groups by genotype as determined by their fluorescence. Experimenters were not blinded to experimental condition, but analyses did not require manual scoring of behavior.
Statistics were obtained using parametric tests if the samples were normally distributed. The normality of each distribution was tested with the Shapiro–Wilk test, and if any distribution tested showed P < 0.05, nonparametric tests were used for all comparisons in the same dataset. The exact test type is reported when used in the main text and/or figure legends, and details (test statistics, sample sizes, P values and corrected P values) are provided in Supplementary Table 2. These tests were performed using Scipy in Python. P values were corrected for multiple comparisons with the Benjamini–Hochberg false discovery rate correction using the Statsmodels package in Python. All analyses and visualizations were performed with custom code written in Python, using NumPy, Scipy, Matplotlib, Jupyter, Seaborn, Statsmodels, Pandas, Scikit-image and Scikit-learn libraries61-68.
Reporting summary.
Further information on research design is available in the Nature Research Reporting Summary linked to this article.
Extended Data
Extended Data Fig. 1 ∣. Responses to rapid environmental changes do not influence forward swimming, do not habituate over trials, and are not influenced by ablation of pomc+ cells in the pituitary.
a, Schematic of behavior (left), and measurement of threat onset/offset kinetics using a thermocouple (heat) or two-photon imaging of fluorescence in flow solution (flow - salinity, acidity) (right). b, Threat onset does not influence forward swimming (mean ± s.e.m., 1 s bins, N = 57 fish (5 trials each), same fish as shown in Fig. 1c). c, Fraction of trials with turning movements during threat presentation, across all 5 trials (mean ± s.e.m., N = 57 fish). Comparison of first two trials vs last two trials. All p > 0.1, Two-sided Wilcoxon signed-rank test. d, Ventral sections of Tg(pomc:Gal4;UAS:NTR-mCherry) fish, showing ablation of pomc+ cells in the pituitary (red) upon treatment with metronidazole (MTZ; right). Similar ablation observed in N = 3 fish examined. e, Summary data from control and ablated fish. N = 9 fish per group, mean ± s.e.m., individual fish are points. One-tailed Mann-Whitney U tests, Benjamini-Hochberg false discovery rate correction for multiple comparisons. NS = ‘not significant’, all p > 0.4. f, Maximum tail angle of responsive movements - summary data from control and ablated fish. Note that control fish have lower response magnitude on salinity trials. N = 9 fish per group, mean ± s.e.m., individual fish are points. One-tailed Mann-Whitney U tests, Benjamini-Hochberg false discovery rate correction for multiple comparisons. *p < 0.05. NS = ‘not significant’, all p > 0.4. See Supplementary Table 2 for test statistics.
Extended Data Fig. 2 ∣. Coverage, registration, and anatomical segregation of brain-wide imaging data.
a, All z-planes functionally imaged in a single Tg(elavl3:H2B-GCaMP6s) fish - 14 z-planes, 15 μm separation, 2 volumes/second. All N = 8 fish were imaged with the same x/y/z-sampling. b, Example z-planes from N = 6 fish, after registration to a common volume. Fish were registered to a common ‘bridge’ brain; the standard Tg(elavl3:H2B-RFP) brain from the Z-Brain atlas (along with atlas masks) were registered to this bridge brain, to allow for anatomical region analysis. c, Example z-planes from a single fish, with a subset of overlaid anatomical regions from the registered Z-Brain atlas. The same regions were aligned to each of the N = 8 fish. d, Step-by-step protocol for registering each recorded brain to a common volume, and assigning recorded neurons to brain regions in the Z-brain atlas.
Extended Data Fig. 3 ∣. Brain-wide imaging and linear models of single neurons reveal feature-selective neurons across brain regions.
a, Schematic of experiment, and example tail angle over threat presentation. b, Schematic of single-neuron analyses, and data from an example neuron. A linear model of each cell’s denoised fluorescence time series is composed from behavioral events (convolved with calcium indicator decay), and the importance of each event is determined by the change in model performance (ΔR2) upon shuffling of each event time-series (unique model contributions, UMC). UMC plot for the example neuron (right). This example neuron preferentially encodes salinity. c, Spatial distribution of UMC for each variable, shown in side projection of the medial 40 μm of whole-brain volume. Values are displayed as the percentile within the distribution of UMC for that task component across all cells. Brain regions are outlined in brown. d, Violin plots showing the distribution of unique model contributions (UMC, ΔR2) for brain regions denoted by the Z-brain atlas. Density does not extend beyond the minima and maxima of the data (0-100th percentile). Quartiles are not shown. The number of neurons in each group are noted at bottom, along with the region name.
Extended Data Fig. 4 ∣. Details of MultiMAP experimental protocol for registration of live functional imaging to multi-color fluorescent in situ hybridization.
a, Step-by-step protocol for performing MultiMAP procedure, and assigning recorded neurons to molecularly-defined populations. b, Overlay of single live-imaging z-plane (mean of all time-points in motion-corrected plane) with the associated z-plane from registered volumes. Similar results were obtained from all N = 7 fish. c, Validation of registration in the hypothalamus, using the red fluorescent protein (RFP, mCherry in this case) as a “held out” marker in both live and fixed volumes to assess accuracy of fixed-to-live registration of H2B-GCaMP (in Tg(oxt:Gal4; UAS:NTR-mCherry; elavl3:H2B-GCaMP6s) fish (N = 4). Note that after registration, the held-out RFP signals precisely overlap. Scale bar = 10 μm.
Extended Data Fig. 5 ∣. Cellular-resolution registration of live functional imaging with up to three rounds of triple fluorescent in situ hybridization.
a, All z-planes functionally imaged in a single Tg(elavl3:H2B-GCaMP6s) fish - 5 z-planes, 15 μm separation, 4 volumes/second. Showing live GCaMP z-plane (grey), and fixed GCaMP z-planes from round 1 and round 2 of in situ hybridization (green and red, respectively), before (left) and after (middle) volume registration. Overlap of live GCaMP and the six registered in situ hybridization labels from two rounds of multicolor fluorescent in situ hybridization (right). b, Example z-planes from all N = 7 fish used in Figs. 2 and 3. c, Overlap of molecular labels in cell types identified (N = 7 fish, Pearson’s R). Note the co-expression of avp with the medial crf population. d, Example z-planes functionally imaged in a single Tg(elavl3:H2B-GCaMP6s) fish, showing live GCaMP z-plane (grey), and fixed GCaMP z-planes from round 1, 2, and 3 of fluorescent in situ hybridization (green, red, and cyan, respectively), before and after volume registration. Overlap of live GCaMP and the nine registered in situ hybridization labels from three rounds of triple fluorescent in situ hybridization (right). Similar expression patterns are obtained from each of the N =3 fish tested.
Extended Data Fig. 6 ∣. Functional clusters of hypothalamic neurons.
Stimulus-aligned activity averaged across all recorded neurons and trials, and unique model contribution (UMC) values, for all functional clusters identified in Fig. 3c. These plots include all recorded neurons in Tg(elavl3:H2B-GCaMP6s) fish, rather than just the identified peptidergic neurons.
Extended Data Fig. 7 ∣. Characterization of Gal4 lines, optical excitation, and electrophysiological validation of ChR2 expression.
a, Overlap of GFP expression in the preoptic area of Tg(oxt:Gal4; UAS:GFP) and Tg(sst3:Gal4; UAS:GFP) with in situ hybridization labels, and overlap of GFP expression in Tg(otpba:Gal4;UAS:GFP) line with fluorescent in situ hybridization for oxt, crf, and avp. Similar expression for N = 3 fish per genotype. Crf and avp are co-localized in the same cells. b, Co-localization of GFP and crf in Tg(crf:Gal4; UAS:GFP) fish. Note that GFP expression is specific to crf+ neurons, but that only 29% of crf+ neurons are GFP+ (n = 2 fish). c, Imaging oxt+ and crf+ neurons in transgenic lines. Image of GCaMP expressing neurons and event-averaged responses of neurons recorded from Tg(oxt:Gal4; UAS:GCaMP6s) and Tg(crf:Gal4; UAS:GCaMP6s) fish (top and bottom, respectively). Neurons pooled from N = 2 fish per genotype. d, Localization of optical stimulation for optogenetics experiments. 405 nm light was delivered through the same optic fiber used for ChR2 or GtACR1 stimulation, and converts kaede from green to red. The increased green-to-red (pseudocolored magenta) change in the preoptic area demonstrates limited spatial extent of optogenetic stimulation. Similar results obtained for N =3 fish tested. e, in vivo cell-attached recordings from single ChR2-mCherry+ and neighboring ChR2-mCherry-negative neurons in the preoptic hypothalamus of a Tg(oxt:Gal4; UAS:ChR2-mCherry) fish, during stimulation with the same parameters used for behavioral experiments. 5 Hz blue light trains evoke spiking in the opsin-expressing neuron. Similar results were obtained from 2 other neurons.
Extended Data Fig. 8 ∣. Controls related to cellular ablation.
a, Expression of UAS:NTR-mCherry in the preoptic hypothalamus of each Gal4 line, and neuronal ablation upon treatment with MTZ (related to Fig. 4e, f). A similar extent of ablation was observed in all fish examined. b, Maximum tail angle of responsive movements - summary data from control and ablated fish. Same fish as Fig. 4f. Mean ± s.e.m., individual fish are points. One-tailed Mann-Whitney U tests, Benjamini-Hochberg false discovery rate correction for multiple comparisons within genotype. NS = “not significant”, all p > 0.1. c, Inactivation of preoptic neurons in Tg(otpba:Gal4; UAS:GtACR1-eYFP) fish. Schematic of experiment (left), image of GtACR1-eYFP expression (middle; similar expression observed in all N = 8 fish.), and behavioral results (right). N = 8 fish per group, mean ± s.e.m., individual fish are points. One-tailed Mann-Whitney U tests, Benjamini-Hochberg false discovery rate correction for multiple comparisons. NS = “not significant”, all p >0.1. *p < 0.05. While light ON trials increases total movement in control and opsin fish, GtACR1-expressing fish move less under these conditions. d, Ablation of neurons in Tg(th:Gal4) line, including the dopaminergic posterior tuberculum neurons also labeled in the Tg(otpba:Gal4) line, does not influence behavior in this assay. A similar extent of ablation was observed in all fish examined. N = 8 fish per group, mean ± s.e.m., individual fish are points. One-tailed Mann-Whitney U test, Benjamini-Hochberg false discovery rate correction for multiple comparisons. NS = “not significant”, all p > 0.4. See Supplementary Table 2 for test statistics.
Extended Data Fig. 9 ∣. Details of RoL1 location, two-photon single-cell ablation of spinal projection neurons, and local injection of NBQX.
a, Location of spinal projection neurons (SPNs), with cell names, and axonal projections in Tg(oxt:Gal4; UAS:GFP) fish. b, Location of SPNs relative to monoaminergic cells, labeled with spinal backfill in a Tg(vmat2:eGFP) line. RoL1 neurons reside slightly anterior and medial to the noradrenergic neurons of the locus coeruleus. c, Example images showing sequential two-photon single-cell ablation of three RoL1 neurons in a Tg(elavl3:H2B-GCaMP6s) fish backfilled with Texas red dextran. This specificity and extent of ablation was confirmed across all N = 10 fish. d, Images of an example fish, backfilled with Texas red dextran, before and after bilateral ablation of the Mauthner neurons and segmental homologues (“M-array” ablation). This specificity and extent of ablation was confirmed across all N = 11 fish. e, Maximum tail angle of responsive movements - summary data from control and ablated fish. Mean ± s.e.m., individual fish are points. N = (11,11,10) - (sham, M-array, RoL1), left to right. Note that RoL1 neuron ablation reduced the maximum tail angle in response to some stimuli. One-tailed Mann-Whitney U tests, Benjamini-Hochberg false discovery rate correction for multiple comparisons. Same fish as Fig. 5h. NS = “not significant”, all p > 0.2. *p < 0.05. f, DIC image of embedded fish (agar around nose removed), with location of injection pipette entering from the fissure between the optic tectum and lateral cerebellum (left). Close-up image of injection area in DIC and fluorescence imaging to visualize drug/dye flow (right). Localized dye spread was confirmed across all injected fish. g, Maximum tail angle of responsive movements - summary data from in RoL1-injected fish (NBQX or vehicle). Mean ± s.e.m., individual fish are points. N = (6,6) - (vehicle, NBQX). One-tailed Mann-Whitney U tests, Benjamini-Hochberg false discovery rate correction for multiple comparisons. Same fish as Fig. 5k. NS = “not significant”, all p > 0.1. See Supplementary Table 2 for test statistics.
Supplementary Material
Acknowledgements
We thank our colleagues for generously sharing transgenic zebrafish lines: A. Douglass, H. Baier, M. Ahrens, S. Jesuthasan, J. Bonkowsky and J.-l. Du. We thank C. Constantinople, F. Gore, T. Machado, W. Allen, R. Nath and C. Bedbrook for feedback on an earlier version of the manuscript, and the entire Deisseroth Lab for advice and discussions. This research was supported by Helen Hay Whitney Foundation Postdoctoral Fellowships (to M.L.-B. and A.S.A.), Brain and Behavior Research Foundation NARSAD Young Investigator Awards (to M.L.-B. and A.S.A.), the NIMH (to M.L.-B.: K99MH11284002), the NIDA (to S.G.: R01DA035680 and R21DA038447), and grants from the NIH, NSF, Gatsby, Fresenius, and NOMIS Foundations (to K.D.).
Footnotes
Competing interests
The authors declare no competing interests.
Online content
Any methods, additional references, Nature Research reporting summaries, source data, extended data, supplementary information, acknowledgements, peer review information; details of author contributions and competing interests; and statements of data and code availability are available at https://doi.org/10.1038/s41593-020-0655-1.
Extended data is available for this paper at https://doi.org/10.1038/s41593-020-0655-1.
Supplementary information is available for this paper at https://doi.org/10.1038/s41593-020-0655-1.
Peer review information Nature Neuroscience thanks Florian Engert and the other, anonymous, reviewer(s) for their contribution to the peer review of this work.
Publisher’s note Springer Nature remains neutral with regard to jurisdictional claims in published maps and institutional affiliations.
Code availability
The analysis code will be made available from the corresponding author upon reasonable request.
Data availability
Data will be made available from the corresponding author upon reasonable request.
References
- 1.Saper CB & Lowell BB The hypothalamus. Curr. Biol 24, R1111–R1116 (2014). [DOI] [PubMed] [Google Scholar]
- 2.Sternson SM Hypothalamic survival circuits: blueprints for purposive behaviors. Neuron 77, 810–824 (2013). [DOI] [PMC free article] [PubMed] [Google Scholar]
- 3.Aponte Y, Atasoy D & Sternson SM AGRP neurons are sufficient to orchestrate feeding behavior rapidly and without training. Nat. Neurosci 14, 351–355 (2011). [DOI] [PMC free article] [PubMed] [Google Scholar]
- 4.Allen WE et al. Thirst-associated preoptic neurons encode an aversive motivational drive. Science 357, 1149–1155 (2017). [DOI] [PMC free article] [PubMed] [Google Scholar]
- 5.Lee H et al. Scalable control of mounting and attack by Esr1+ neurons in the ventromedial hypothalamus. Nature 509, 627–632 (2014). [DOI] [PMC free article] [PubMed] [Google Scholar]
- 6.Tan CL et al. Warm-sensitive neurons that control body temperature. Cell 167, 47–59 (2016). [DOI] [PMC free article] [PubMed] [Google Scholar]
- 7.Wu Z, Autry AE, Bergan JF, Watabe-Uchida M & Dulac CG Galanin neurons in the medial preoptic area govern parental behaviour. Nature 509, 325–330 (2014). [DOI] [PMC free article] [PubMed] [Google Scholar]
- 8.Kunwar PS et al. Ventromedial hypothalamic neurons control a defensive emotion state. eLife 4, e06633 (2015). [DOI] [PMC free article] [PubMed] [Google Scholar]
- 9.Mangieri LR et al. Defensive behaviors driven by a hypothalamic–ventral midbrain circuit. eNeuro 6, ENEURO.0156-19.2019 (2019). [DOI] [PMC free article] [PubMed] [Google Scholar]
- 10.Romanov RA, Alpár A, Hökfelt T & Harkany T Unified classification of molecular, network, and endocrine features of hypothalamic neurons. Annu. Rev. Neurosci 42, 1–26 (2019). [DOI] [PubMed] [Google Scholar]
- 11.Moffitt JR et al. Molecular, spatial, and functional single-cell profiling of the hypothalamic preoptic region. Science 362, eaau5324 (2018). [DOI] [PMC free article] [PubMed] [Google Scholar]
- 12.Kim DW et al. Multimodal analysis of cell types in a hypothalamic node controlling social behavior. Cell 179, 713–728 (2019). [DOI] [PMC free article] [PubMed] [Google Scholar]
- 13.Biran J, Blechman J, Wircer E, & Levkowitz G In Model Animals in Neuroendocrinology: From Worm to Mouse to Man (eds Ludwig M & Levkowitz G) 101–131 (Wiley–Blackwell, 2018). [Google Scholar]
- 14.Ahrens MB et al. Brain-wide neuronal dynamics during motor adaptation in zebrafish. Nature 485, 471–477 (2012). [DOI] [PMC free article] [PubMed] [Google Scholar]
- 15.Ahrens MB & Engert F Large-scale imaging in small brains. Curr. Opin. Neurobiol 32, 78–86 (2015). [DOI] [PMC free article] [PubMed] [Google Scholar]
- 16.Vladimirov N et al. Light-sheet functional imaging in fictively behaving zebrafish. Nat. Methods 11, 883–884 (2014). [DOI] [PubMed] [Google Scholar]
- 17.De Marco RJ, Groneberg AH, Yeh CM, Treviño M & Ryu S The behavior of larval zebrafish reveals stressor-mediated anorexia during early vertebrate development. Front. Behav. Neurosci 8, 367 (2014). [DOI] [PMC free article] [PubMed] [Google Scholar]
- 18.vom Berg-Maurer CM, Trivedi CA, Bollmann JH, De Marco RJ & Ryu S The severity of acute stress is represented by increased synchronous activity and recruitment of hypothalamic CRH neurons. J. Neurosci 36, 3350–3362 (2016). [DOI] [PMC free article] [PubMed] [Google Scholar]
- 19.Liu NA et al. Pituitary corticotroph ontogeny and regulation in transgenic zebrafish. Mol. Endocrinol 17, 959–966 (2003). [DOI] [PubMed] [Google Scholar]
- 20.Curado S, Stainier DY & Anderson RM Nitroreductase-mediated cell/tissue ablation in zebrafish: a spatially and temporally controlled ablation method with applications in developmental and regeneration studies. Nat. Protoc 3, 948–954 (2008). [DOI] [PMC free article] [PubMed] [Google Scholar]
- 21.Temizer I, Donovan JC, Baier H & Semmelhack JL A visual pathway for looming-evoked escape in larval zebrafish. Curr. Biol 25, 1823–1834 (2015). [DOI] [PubMed] [Google Scholar]
- 22.Dunn TW et al. Neural circuits underlying visually evoked escapes in larval zebrafish. Neuron 89, 613–628 (2016). [DOI] [PMC free article] [PubMed] [Google Scholar]
- 23.Randlett O et al. Whole-brain activity mapping onto a zebrafish brain atlas. Nat. Methods 12, 1039–1046 (2015). [DOI] [PMC free article] [PubMed] [Google Scholar]
- 24.Herget U, Wolf A, Wullimann MF & Ryu S Molecular neuroanatomy and chemoarchitecture of the neurosecretory preoptic-hypothalamic area in zebrafish larvae. J. Comp. Neurol 522, 1542–1564 (2014). [DOI] [PubMed] [Google Scholar]
- 25.Joëls M & Baram TZ The neuro-symphony of stress. Nat. Rev. Neurosci 10, 459–466 (2009). [DOI] [PMC free article] [PubMed] [Google Scholar]
- 26.Lovett-Barron M et al. Ancestral circuits for the coordinated modulation of brain state. Cell 171, 1411–1423 (2017). [DOI] [PMC free article] [PubMed] [Google Scholar]
- 27.Choi HM et al. Third-generation in situ hybridization chain reaction: multiplexed, quantitative, sensitive, versatile, robust. Development 145, dev165753 (2018). [DOI] [PMC free article] [PubMed] [Google Scholar]
- 28.Rohlfing T & Maurer CR Nonrigid image registration in shared-memory multiprocessor environments with application to brains, breasts, and bees. IEEE Trans. Inf. Technol. Biomed 7, 16–25 (2003). [DOI] [PubMed] [Google Scholar]
- 29.Herget U & Ryu S Coexpression analysis of nine neuropeptides in the neurosecretory preoptic area of larval zebrafish. Front. Neuroanat 9, 2 (2015). [DOI] [PMC free article] [PubMed] [Google Scholar]
- 30.Musall S, Kaufman MT, Juavinett AL, Gluf S & Churchland AK Movement-related activity dominates cortex during sensory-guided decision making. Nat. Neurosci 22, 1677–1686 (2019). [DOI] [PMC free article] [PubMed] [Google Scholar]
- 31.Wee CL et al. Zebrafish oxytocin neurons drive nocifensive behavior via brainstem premotor targets. Nat. Neurosci 22, 1477–1492 (2019). [DOI] [PMC free article] [PubMed] [Google Scholar]
- 32.Förster D et al. Genetic targeting and anatomical registration of neuronal populations in the zebrafish brain with a new set of BAC transgenic tools. Sci. Rep 7, 5230 (2017). [DOI] [PMC free article] [PubMed] [Google Scholar]
- 33.Fujimoto E, Stevenson TJ, Chien CB & Bonkowsky JL Identification of a dopaminergic enhancer indicates complexity in vertebrate dopamine neuron phenotype specification. Dev. Biol 352, 393–404 (2011). [DOI] [PMC free article] [PubMed] [Google Scholar]
- 34.Li J et al. Intron targeting-mediated and endogenous gene integrity-maintaining knockin in zebrafish using the CRISPR/Cas9 system. Cell Res. 25, 634–637 (2015). [DOI] [PMC free article] [PubMed] [Google Scholar]
- 35.Kimmel CB, Powell SL & Metcalfe WK Brain neurons which project to the spinal cord in young larvae of the zebrafish. J. Comp. Neurol 205, 112–127 (1982). [DOI] [PubMed] [Google Scholar]
- 36.Orger MB, Kampff AR, Severi KE, Bollmann JH & Engert F Control of visually guided behavior by distinct populations of spinal projection neurons. Nat. Neurosci 11, 327–333 (2008). [DOI] [PMC free article] [PubMed] [Google Scholar]
- 37.Korn H & Faber DS The Mauthner cell half a century later: a neurobiological model for decision-making? Neuron 47, 13–28 (2005). [DOI] [PubMed] [Google Scholar]
- 38.Schöne C & Burdakov D Glutamate and GABA as rapid effectors of hypothalamic “peptidergic” neurons. Front. Behav. Neurosci 6, 81 (2012). [DOI] [PMC free article] [PubMed] [Google Scholar]
- 39.Haesemeyer M, Robson DN, Li JM, Schier AF & Engert F A brain-wide circuit model of heat-evoked swimming behavior in larval zebrafish. Neuron 98, 817–831 (2018). [DOI] [PMC free article] [PubMed] [Google Scholar]
- 40.Condés-Lara M, Rojas-Piloni G, Martínez-Lorenzana G & Rodríguez-Jiménez J Paraventricular hypothalamic oxytocinergic cells responding to noxious stimulation and projecting to the spinal dorsal horn represent a homeostatic analgesic mechanism. Eur. J. Neurosci 30, 1056–1063 (2009). [DOI] [PubMed] [Google Scholar]
- 41.Kim J et al. Rapid, biphasic CRF neuronal responses encode positive and negative valence. Nat. Neurosci 22, 576–585 (2019). [DOI] [PMC free article] [PubMed] [Google Scholar]
- 42.Ziegler DR, Cullinan WE & Herman JP Distribution of vesicular glutamate transporter mRNA in rat hypothalamus. J. Comp. Neurol 448, 217–229 (2002). [DOI] [PubMed] [Google Scholar]
- 43.Ponzio TA, Ni Y, Montana V, Parpura V & Hatton GI Vesicular glutamate transporter expression in supraoptic neurones suggests a glutamatergic phenotype. J. Neuroendocrinol 18, 253–265 (2006). [DOI] [PMC free article] [PubMed] [Google Scholar]
- 44.Geerling JC, Shin JW, Chimenti PC & Loewy AD Paraventricular hypothalamic nucleus: axonal projections to the brainstem. J. Comp. Neurol 518, 1460–1499 (2010). [DOI] [PMC free article] [PubMed] [Google Scholar]
- 45.Remedios R et al. Social behaviour shapes hypothalamic neural ensemble representations of conspecific sex. Nature 550, 388–392 (2017). [DOI] [PMC free article] [PubMed] [Google Scholar]
- 46.Edelman GM & Gally JA Degeneracy and complexity in biological systems. Proc. Natl Acad. Sci USA 98, 13763–13768 (2001). [DOI] [PMC free article] [PubMed] [Google Scholar]
- 47.Palmiter RD The parabrachial nucleus: CGRP neurons function as a general alarm. Trends Neurosci. 41, 280–293 (2018). [DOI] [PMC free article] [PubMed] [Google Scholar]
- 48.Hartenstein V The neuroendocrine system of invertebrates: a developmental and evolutionary perspective. J. Endocrinol 190, 555–570 (2006). [DOI] [PubMed] [Google Scholar]
- 49.Tessmar-Raible K et al. Conserved sensory-neurosecretory cell types in annelid and fish forebrain: insights into hypothalamus evolution. Cell 129, 1389–1400 (2007). [DOI] [PubMed] [Google Scholar]
- 50.Kimura Y, Satou C & Higashijima SI V2a and V2b neurons are generated by the final divisions of pair-producing progenitors in the zebrafish spinal cord. Development 135, 3001–3005 (2008). [DOI] [PubMed] [Google Scholar]
- 51.Kimura Y et al. Hindbrain V2a neurons in the excitation of spinal locomotor circuits during zebrafish swimming. Curr. Biol 23, 843–849 (2013). [DOI] [PubMed] [Google Scholar]
- 52.Dal Maschio M, Donovan JC, Helmbrecht TO & Baier H Linking neurons to network function and behavior by two-photon holographic optogenetics and volumetric imaging. Neuron 94, 774–789 (2017). [DOI] [PubMed] [Google Scholar]
- 53.Mohamed GA et al. Optical inhibition of larval zebrafish behaviour with anion channelrhodopsins. BMC Biol. 15, 103 (2017). [DOI] [PMC free article] [PubMed] [Google Scholar]
- 54.Davison JM et al. Transactivation from Gal4-VP16 transgenic insertions for tissue-specific cell labeling and ablation in zebrafish. Dev. Biol 304, 811–824 (2007). [DOI] [PMC free article] [PubMed] [Google Scholar]
- 55.Hatta K, Tsujii H & Omura T Cell tracking using a photoconvertible fluorescent protein. Nat. Protoc 1, 960–967 (2006). [DOI] [PubMed] [Google Scholar]
- 56.Wen L et al. Visualization of monoaminergic neurons and neurotoxicity of MPTP in live transgenic zebrafish. Dev. Biol 314, 84–92 (2008). [DOI] [PubMed] [Google Scholar]
- 57.Lambert AM, Bonkowsky JL & Masino MA The conserved dopaminergic diencephalospinal tract mediates vertebrate locomotor development in zebrafish larvae. J. Neurosci 32, 13488–13500 (2012). [DOI] [PMC free article] [PubMed] [Google Scholar]
- 58.Andalman AS et al. Neuronal dynamics regulating brain and behavioral state transitions. Cell 177, 970–985 (2019). [DOI] [PMC free article] [PubMed] [Google Scholar]
- 59.Giovannucci A et al. CaImAn an open source tool for scalable calcium imaging data analysis. eLife 8, e38173 (2019). [DOI] [PMC free article] [PubMed] [Google Scholar]
- 60.Engelhard B et al. Specialized coding of sensory, motor and cognitive variables in VTA dopamine neurons. Nature 570, 509–513 (2019). [DOI] [PMC free article] [PubMed] [Google Scholar]
- 61.Jones E, Oliphant T, & Peterson P SciPy: Open Source Scientific Tools for Python (2001). [Google Scholar]
- 62.Hunter JD Matplotlib: a 2D graphics environment. Comput. Sci. Eng 9, 90–95 (2007). [Google Scholar]
- 63.McKinney W Data structures for statistical computing in Python. In Proc. 9th Python in Science Conference (eds van der Walt S & Millman J) 56–61 (SCIPY, 2010). [Google Scholar]
- 64.Kluyver T et al. Jupyter Notebooks—a publishing format for reproducible computational workflows. In Proc. 20th International Conference on Electronic Publishing (eds Loizides F & Schmidt B) 87–90 (IOS Press, 2016). [Google Scholar]
- 65.Seabold S & Perktold J Statsmodels: econometric and statistical modeling with Python. In Proc. 9th Python in Science Conference (eds van der Walt S & Millman J) 92–96 (SCIPY, 2010). [Google Scholar]
- 66.Pedregosa F et al. Scikit-learn: machine learning in Python. J. Mach. Learn. Res 12, 2825–2830 (2011). [Google Scholar]
- 67.Van Der Walt S, Colbert SC & Varoquaux G The NumPy array: a structure for efficient numerical computation. Comput. Sci. Eng 13, 22–30 (2011). [Google Scholar]
- 68.Van der Walt S et al. Scikit-image: image processing in Python. PeerJ 2, e453 (2014). [DOI] [PMC free article] [PubMed] [Google Scholar]
Associated Data
This section collects any data citations, data availability statements, or supplementary materials included in this article.
Supplementary Materials
Data Availability Statement
Data will be made available from the corresponding author upon reasonable request.


