

Abstract
Here, a 3D printed multiplexed competitive migration assay is reported for characterizing a chemotactic response in the presence of multiple spatially distributed chemoattractants. The utility of the assay is demonstrated by examining the chemotactic response of human glioblastoma cells to spatially opposing chemotactic gradients of epidermal growth factor (EGF) and bradykinin (BK). Competitive migration assays involving spatially opposing gradients of EGF and BK that are optimized in the absence of the second chemoattractant show that 46% more glioblastoma cells migrate toward EGF sources. The migration velocities of human glioblastoma cells toward EGF and BK sources are reduced by 7.6 ± 2.2% and 11.6 ± 6.3% relative to those found in the absence of the spatially opposing chemoattractant. This work provides new insight to the chemotactic response associated with glioblastoma-vasculature interactions and a versatile, user-friendly platform for characterizing the chemotactic response of cells in the presence of multiple spatially distributed chemoattractants.
Keywords: gradients, microextrusion 3D printing, microphysiological neural systems, neural system-on-a-chip, organ-on-a-chip
1. Introduction
Chemotaxis is the net movement of cells in response to an extracellular chemical gradient. This driving force for cell transport is essential to many critical biological processes.[1,2] In multi-cellular organisms, chemotaxis plays a central role in various physiological processes, such as embryogenesis, angiogenesis, host immune responses, and brain development. Additionally, chemotaxis is highly important in wound healing. Fibroblasts play a central role in wound healing through the production of collagen and other extracellular matrix proteins. This process requires the rapid movement of cells to the site of injury—making fibroblasts highly motile and responsive to various chemoattractants. For example, fibroblast growth factor (FGF) and the consequential activation of FGF receptors drive multiple cellular processes of fibroblasts, including chemotaxis.[3,4]
In addition to driving regenerative processes, chemotaxis is a contributing factor to the progression of many diseases. For example, the unregulated chemotaxis of immune cells contributes to inflammatory conditions, such as asthma and arthritis.[2,5] Chemotaxis has also been implicated in cancer, specifically the migration of malignant cells within the primary organ site, or hematologenously in the case of metastasis.[6] For example, glioblastoma cells are drawn from the primary tumor to secondary structures in the brain via chemotaxis, making them highly invasive Grade IV brain tumors.[7] Glioblastomas are the most common malignant primary brain tumors in humans. In the United States, approximately 13 000 people are annually diagnosed with a glioblastoma, and unfortunately, approximately 85% of these patients lose their lives within two years.[8] This limited survival time can largely be associated with the extensive migration of tumor cells away from the primary tumor site, where therapeutic interventions have limited efficacy.
Among the secondary structures involved in glioblastoma migration, the influence of chemical signals from vascular structures is not yet fully understood. Several molecules that originate from blood vessels or other vascular structures are known to induce glioblastoma migration. One such molecule is bradykinin (BK), a peptide important in blood pressure regulation and inflammatory reactions, which chemotactically stimulates the movement of glioblastoma cells to the vascular network.[9,10] Another chemoattractant provided by the vascular network that is believed to play an important role in glioblastoma migration is epidermal growth factor (EGF).[11,12] EGF plays a significant role in glioblastoma biology, largely due to disease-associated alterations in the EGF receptor (EGFR) via mutation or amplification that lead to constitutive activation of EGFR.[13,14] EGF is present in blood serum, is able to cross the blood-brain barrier, and has been associated with enhanced glioblastoma proliferation, invasion, and chemotactic responses.[15,16]
While various migration assays exist, they can be broadly classified as chamber- or microfluidic-based assays. Chamber-based migration assays, such as the commonly utilized Boyden chamber, involve the imaging of migrating cells from a cell-containing chamber through a porous material into a chemoattractant-containing chamber.[17,18] Similar designs include the Zigmond and Dunn chambers, which yield improved cell counting and imaging resolution capabilities, but exhibit time-dependent gradients with relatively short transients (i.e., time over which the gradient is present).[19–21] Additionally, while under-agarose assays have been used to study the effect of opposing chemotactic gradients on neutrophil migration,[22] under-agarose and micropipette migration assays also exhibit time-dependent gradients with relatively short transients.[17,23] Ultimately, while chamber-based methods are user-friendly and pose limited technical challenges to use, they constrain the type and duration of gradients that can be studied. Alternatively, while chamber-based assays typically create time-dependent gradients, microfluidic-based assays offer the ability to examine time-independent gradients (i.e., non-uniform steady-state concentration profiles), which are sustained by convective flow of chemoattractant-containing aqueous solutions.[17,19,23,24] For example, a 3D multilayered hydrogel-based microfluidic device was designed to characterize chemotaxis in a biomimetic 3D environment.[25] In addition to creating time-independent gradients, microfluidic-based migration assays offer the ability to examine the effect of multiple spatially opposing gradients of chemoattractants on cell migration response. For example, a microfluidic-based migration assay with multiple chemoattractant sources was recently established for studying the migration of mesenchymal stem cells toward cytokines present in arthritis.[26] Additionally, micro fluidic-based migration assays have also been established based on actively controlled concentration gradients.[27,28] For example, a microfluidic system was recently developed that enabled the study of chemotactic response to single-pulse or periodic chemical gradient signals.[27] While not yet leveraged for the study of cell migration, it should also be noted that 3D printing has also been used to create drug release technology for active gradient control in bioprinted tissue constructs based on stimuli-responsive materials,[29] suggesting that active concentration control is not limited to microfluidic systems and 2D migration processes. However, while these devices can generate steady, non-uniform concentration profiles (i.e., gradients) over long time periods, technical barriers posed by the use of traditional microfabrication processes, microscale fluid handling, and actuator integration impede widespread implementation outside of engineering groups.[30] Thus, a migration assay that combines the advantages of chamber- and micro fluidic-based designs (i.e., user-friendliness, robustness, and gradient design flexibility) could provide a novel high-throughput approach for studying the effect of competing chemotactic signals on cell migration, such as spatially opposing gradients of multiple chemoattractants (i.e., multiple chemoattractants with spatially distributed sources).
Additive manufacturing, commonly referred to as 3D printing, has recently emerged as a promising biofabrication approach for creating artificial axons,[31] neural and glial tissues,[32] brain tumor models,[32] conduits for nerve regeneration,[33–35] cuffs for neural modulation and neural interface,[36] and neural systems-on-a-chip.[37] 3D printing now also offers a complementary manufacturing process to soft lithography for fabricating microfluidic devices. For example, 3D printing has been used to fabricate 3D microfluidics,[38] microfluidic-based microelectromechanical systems (MEMS),[39] organ-conforming microfluidics,[40] and tissue chip systems.[41] Microextrusion 3D printing recently enabled a breakthrough in the fabrication of chamber-based neural systems on a chip that contained 3D printed microchannels for studying the role of Schwann cells on uptake of pseudorabies virus in the nervous system.[41] In addition to neural engineering and microfluidics, 3D printing has been used to construct spatially distributed controlled-release systems that contain chemoattractants as well as other biologics (e.g., enzymes) and molecular species (e.g., drugs).[34,42,43] The use of microextrusion 3D printing to construct nerve guidance conduits for the regeneration of bifurcating mixed nerve injuries that contained path-specific chemoattractants of nerve growth factor (NGF) and glial-derived neurotrophic factor (GDNF) provides a recent example.[34] Therefore, 3D printing could facilitate the fabrication of user-friendly migration assays for studying competing chemoattractants with spatially distributed sources.
Here, we leverage 3D printing to construct a user-friendly, multiplexed migration assay for studying the effect of spatially opposing chemotactic gradients on glioblastoma migration to provide new insights into the chemical signaling underlying glioblastoma migration toward vasculature. The platform was first validated using single-source migration assays with a well-documented fibroblast-FGF (cell-chemoattractant) system. 3D finite element analysis (FEA) simulations of chemoattractant mass transport were performed to characterize the spatiotemporal concentration profile throughout the two-day assay under varied source loading conditions and chemoattractant transport properties. Multiplexed migration assays with on-chip controls were leveraged to better understand the roles of EGF and BK in migration of glioblastoma toward vasculature. We found that spatially opposing gradients of BK have a significant effect on the migration velocity and trajectory of human glioblastoma cells toward EGF-containing sources, which differed from that observed in the presence of uniform BK distributions. This work provides new insight into the chemical signaling that attracts glioblastoma to vasculature and the migration response of glial cells in the presence of spatially distributed chemoattractants. These insights are useful for a variety of healthcare applications, including cancer treatment and regenerative medicine.
2. Results
2.1. Fabrication and Characterization of the 3D Printed Migration Assays for Spatially Distributed Sources of Multiple Chemoattractants
As shown in Figure 1a, microextrusion 3D printing enables the fabrication of a migration assay platform for analysis of competing chemotactic signals that consists of chambers for cell seeding and chemoattractant loading separated by microchannels in which cell migration and chemoattractant transport occur. Following the addition of cell culture medium to the device, chemoattractant diffusion establishes a gradient in the microchannel via passive release from a crosslinked hydrogel, which served as the chemoattractant source (see Figure 1b). This fabrication approach and design facilitates rapid prototyping (i.e., study of alternative signaling networks) and multiplexing within a single petri dish. The schematic associated with a design for spatially opposing chemoattractants is shown in Figure 1c.
Figure 1.
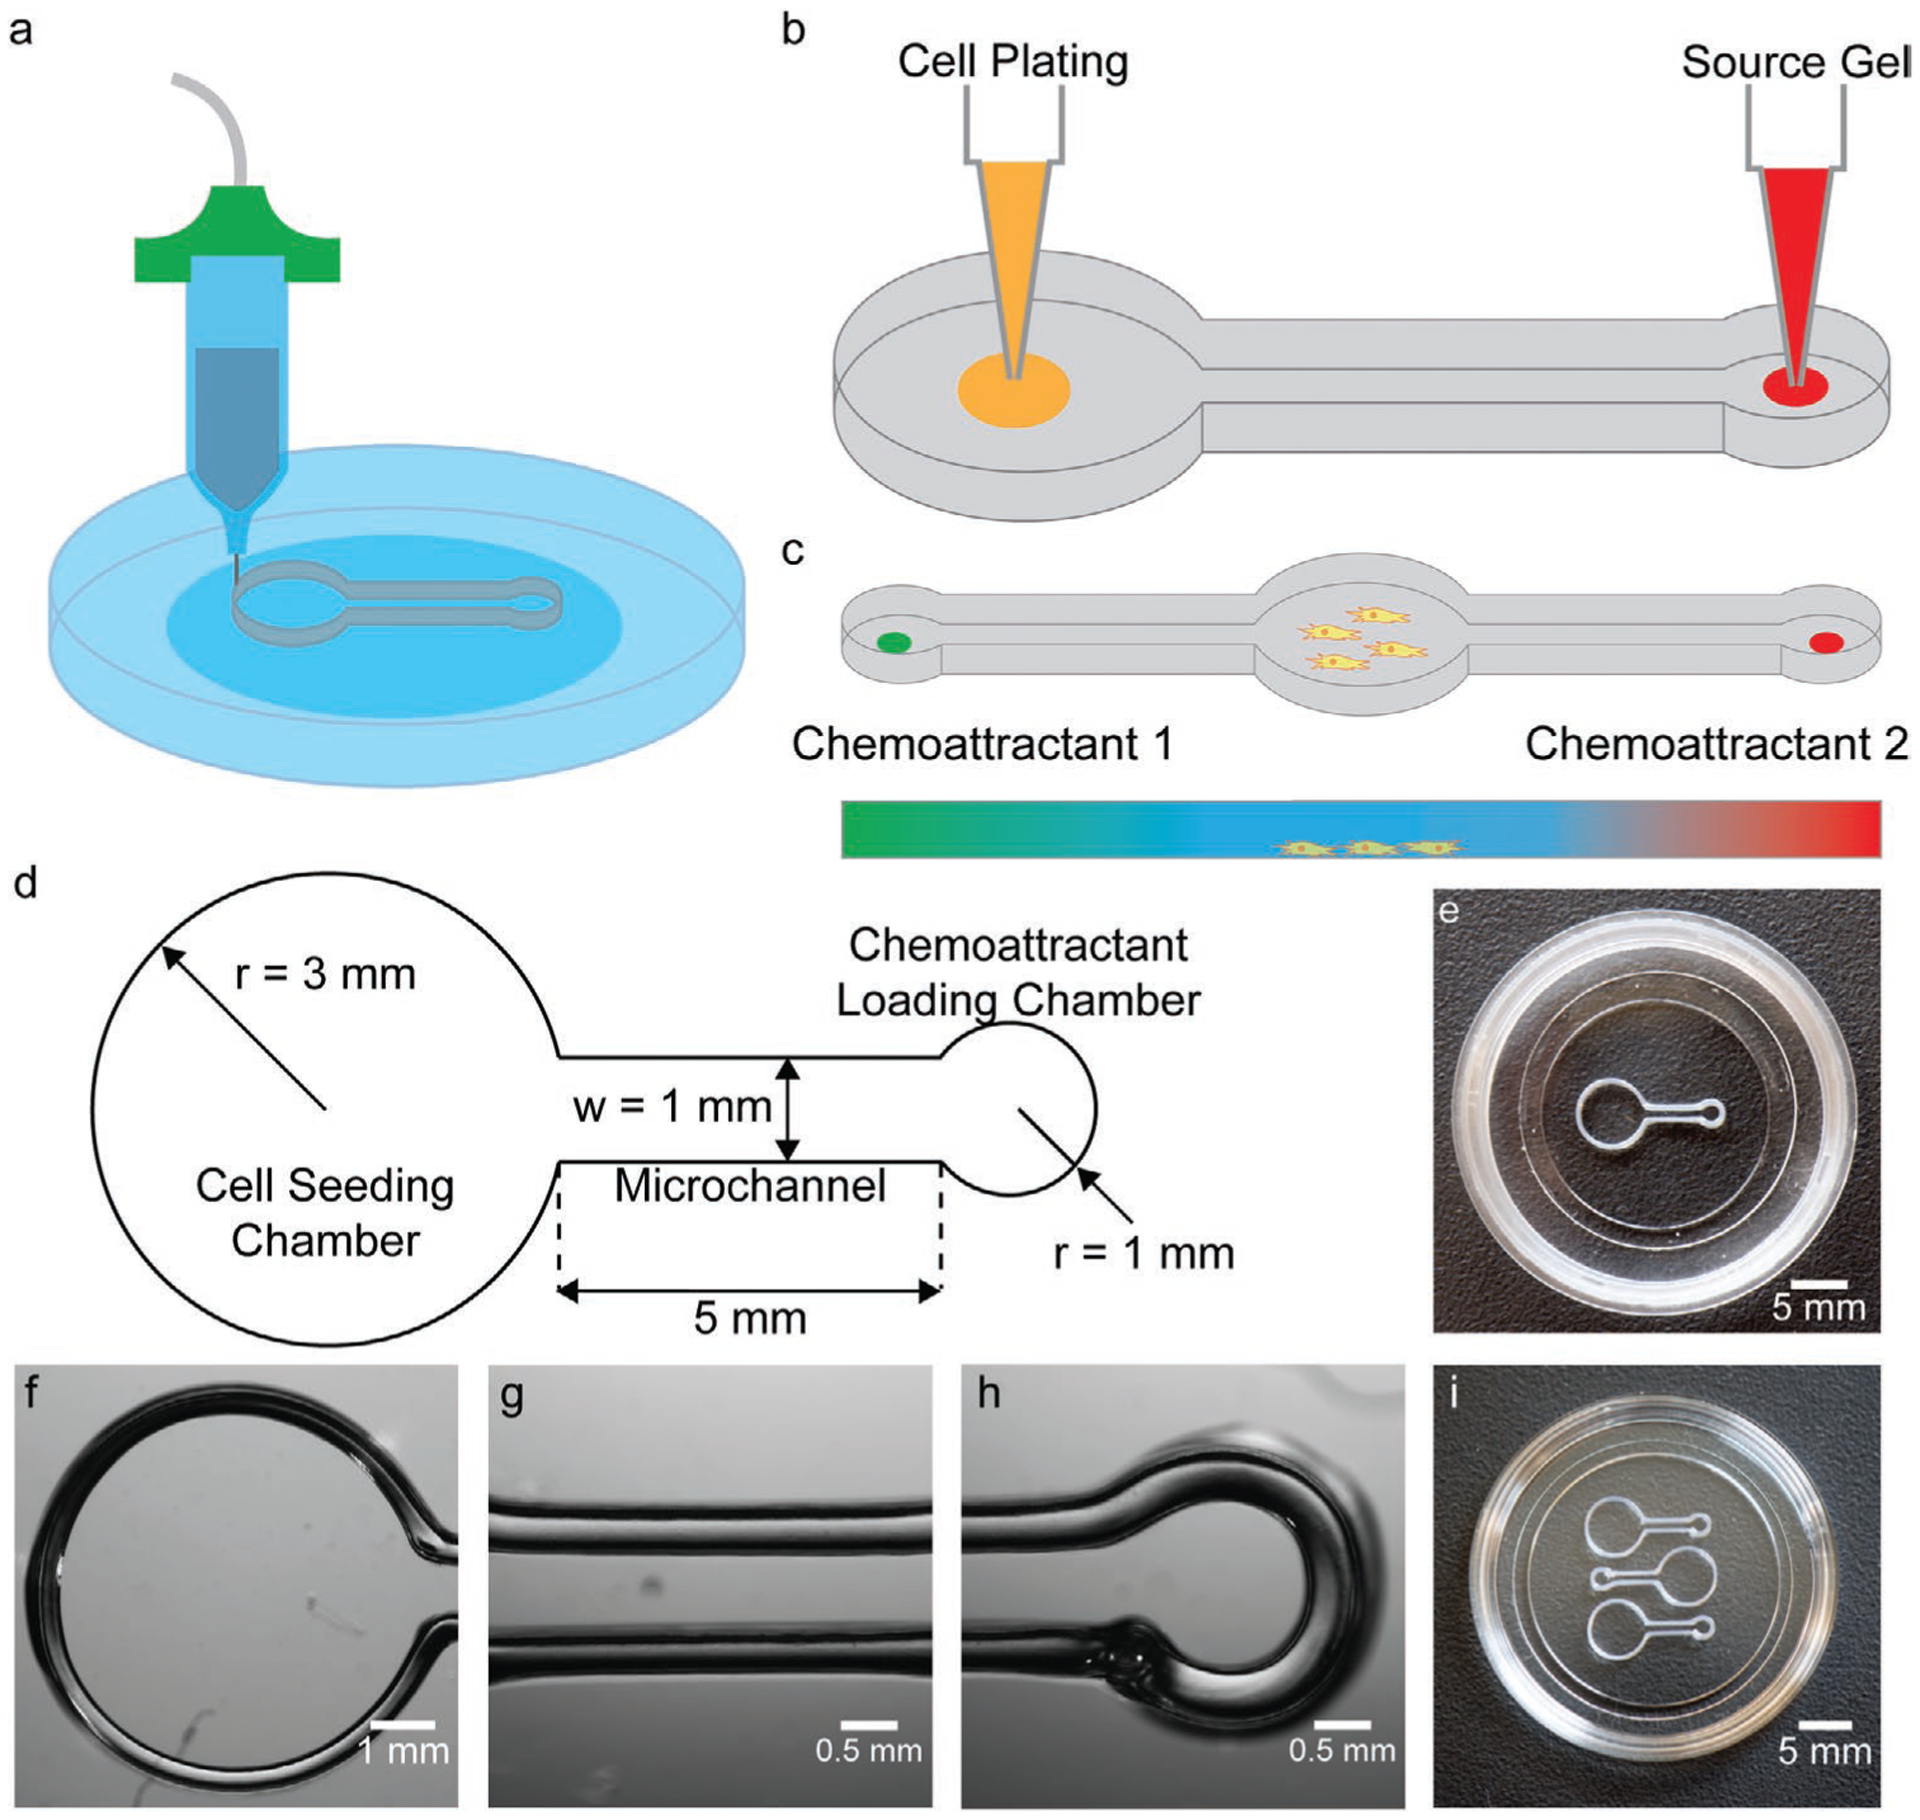
3D printed migration assays for high-throughput study of spatially distributed chemotactic signals (e.g., spatially opposing sources). a) Schematic of fabrication via 3D printing into 35 mm petri dishes. b) Schematic of cell seeding and chemoattractant loading steps via manual pipetting. c) Schematic of a migration assay design with multiple spatially distributed sources for studying the effect of spatially opposing chemotactic signals on glioblastoma migration. d) Dimensions of the device highlighting the cell-seeding chamber (radius = 3 mm), microchannel (5-mm long), and chemoattractant-loading chamber (radius = 1 mm). e) Photograph of a device printed in a 35 mm petri dish. Micrographs of the cell-seeding chamber (f), microchannel (g), and chemoattractant-loading chamber (h). i) Photograph demonstrating the potential for multiplexing, showing the integration of three devices in a 35 mm dish (all single-source designs).
As shown in Figure 1d, the cell-seeding chamber was 6 mm in diameter, which enabled the manual deposition of a 10 μL droplet of cell suspension in the center of the chamber that remained free of contact with the walls. Micrographs showing cell seeding and initial movement are provided in Figure S1, Supporting Information. The cell-seeding chamber was connected to the chemoattractant-loading chamber by a 1 mm wide and 5 mm long microchannel. The chamber’s dimensions were chosen to synergize with the length scales associated with the anatomy of neural tissues in small animals and humans (e.g., peripheral nerves). Thus, the millimeter-scale dimensions were selected to demonstrate that the assay could be broadly applied to fundamental and translational research, such as that involving 3D bioprinted tissues. The diameter of the chemoattractant-loading chamber was 2 mm, which facilitated manual deposition of the chemoattractant-containing hydrogel solution and prevented the hydrogel solution from flowing into the microchannel prior to crosslinking. The chamber and microchannel walls were 2 mm high to provide a sufficient volume of cell culture medium to support cell migration throughout the two-day assay. Based on the resolution of microextrusion 3D printing processes, this 3D printing approach could also enable the fabrication of microscale chamber-based migration assays, which could potentially create larger driving forces (i.e., larger gradients) for eliciting chemotactic response. Micrographs of the cell-seeding chamber, microchannel, and chemoattractant-loading chamber are shown in Figure 1e–h. A micrograph showing a side-profile of the device wall has been provided in Figure S2, Supporting Information to highlight the height uniformity of the device. The micrographs show that the microextrusion 3D printing process produced watertight walls that enabled medium isolation within the structure (see Figure S3, Supporting Information). The artifact in the chemoattractant-loading chamber wall thickness observed in Figure 1h was consistent across all devices and resulted from lifting of the extrusion nozzle at the end of the printing process. However, this printing artifact did not affect the watertight seal. As shown in Figure 1i, the approach enabled multiplexing in single petri dishes for integration of on-chip negative controls as well as improving the assay throughput via simultaneous testing of multiple chemoattractant loading concentrations (we remind the reader that 3D printing is a rapid prototyping process[44]). As shown in Figure 1i, we found that up to three devices could be integrated into a 35 mm dish using the single-source design.
2.2. Characterization of Chemoattractant Spatiotemporal Concentration Profiles during Migration via Finite Element Analysis
Having designed a user-friendly, multiplexed migration assay that accommodates repeatable manual cell seeding and chemoattractant loading, we next carried out finite element simulations of the chemoattractant release and transport processes to obtain the spatiotemporal concentration profiles associated with a given chemoattractant loading condition (i.e., initial concentration of chemoattractant in the hydrogel). It was of interest to calculate both the concentration and gradient of the concentration profile at the location of migrating cell front, as these values are fundamental parameters associated with chemotactic-driven migration flux.[45] Figure 2a shows 3D and top-down schematics of a single-source migration assay. Figure 2b schematically represents the temporal evolution of the chemoattractant concentration profile in the microchannel. As shown in Figure 2c,d, passive release of chemoattractant from the hydrogel source established a gradient across the microchannel.
Figure 2.
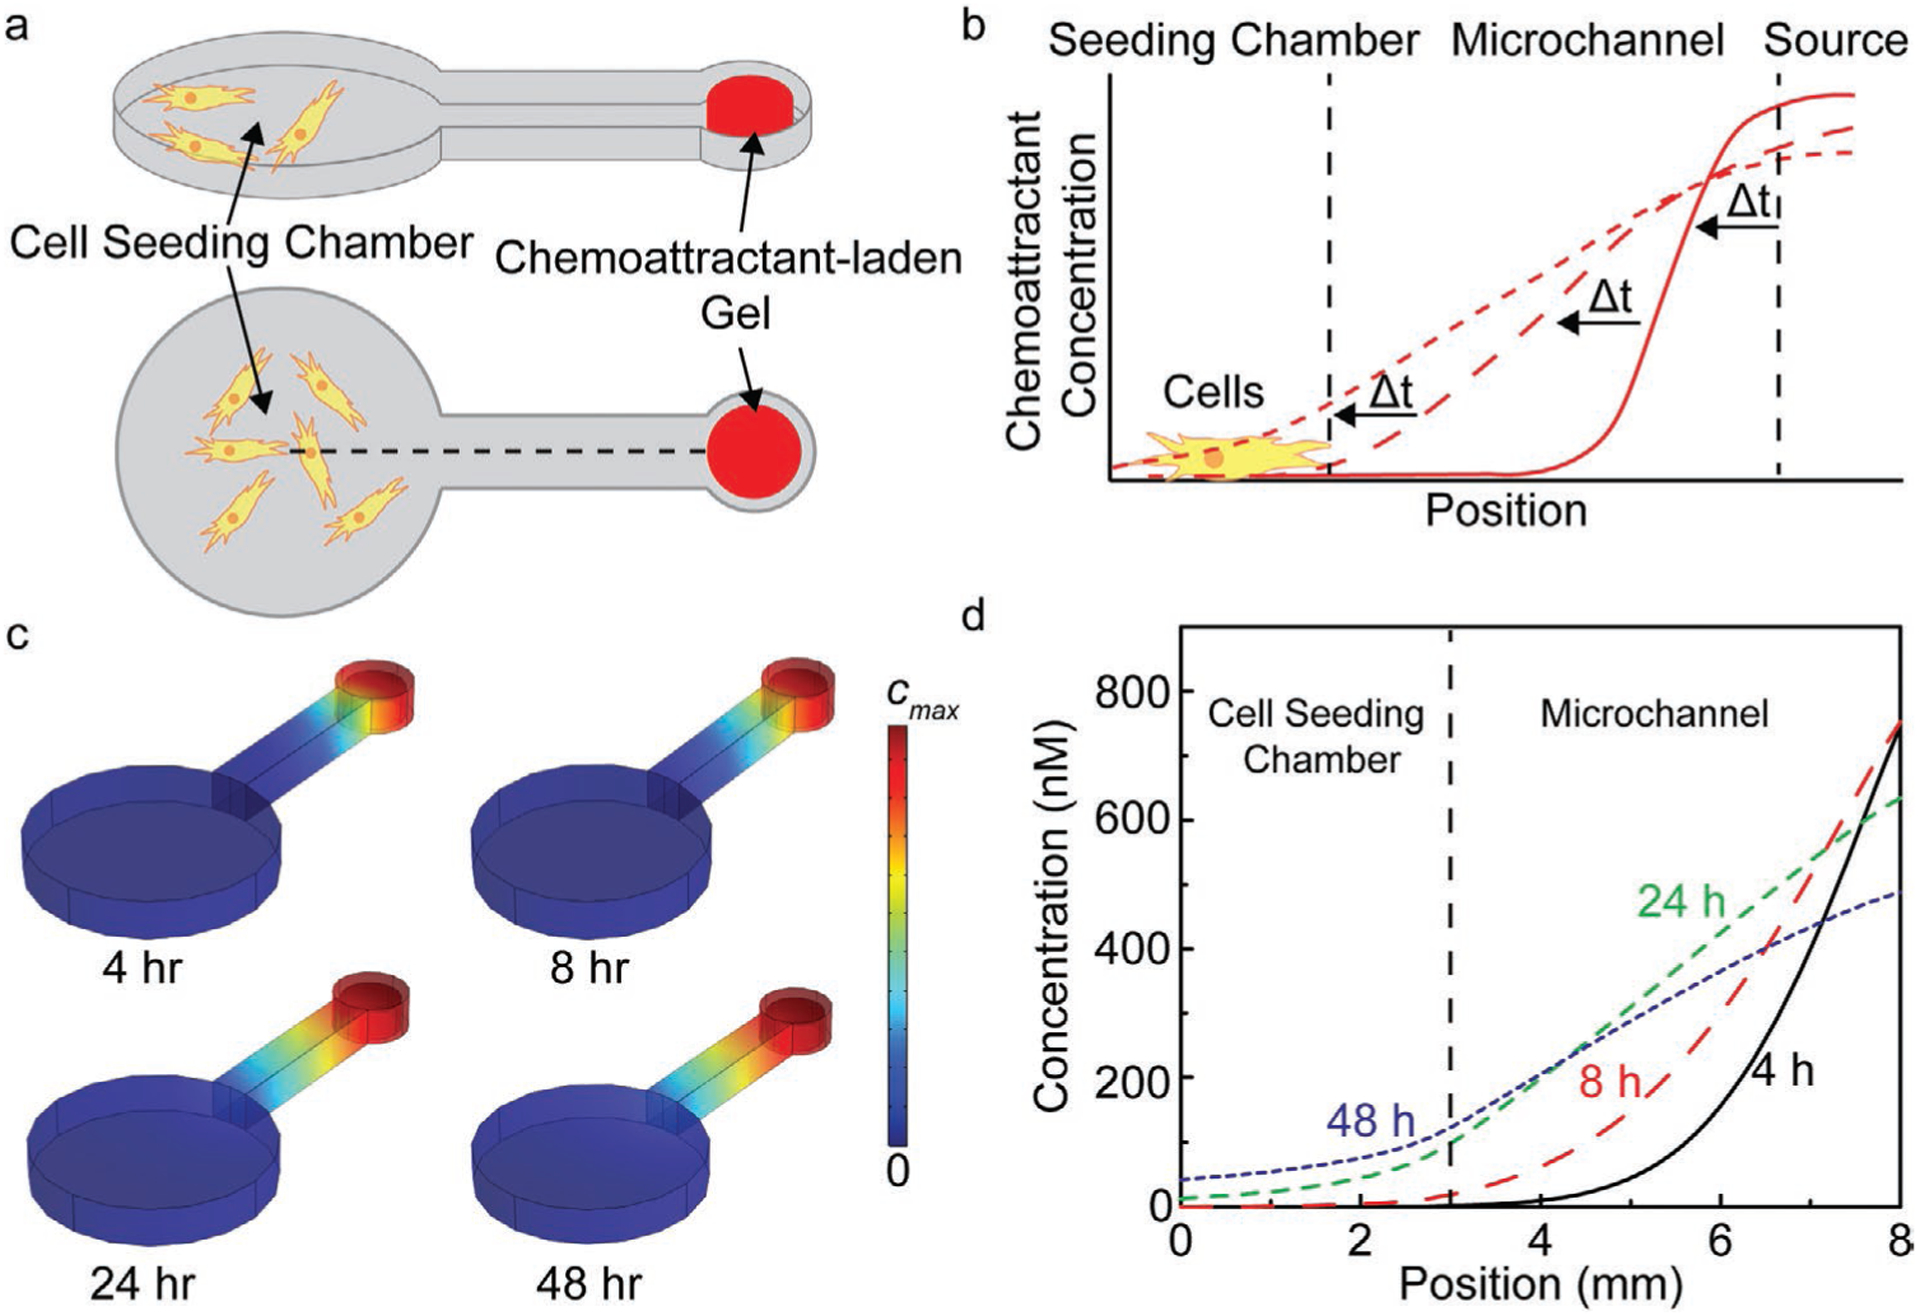
Sensitivity analysis of chemoattractant gradient characteristics using FEA simulations, including the magnitude of the concentration gradient at the migrating cell front and the chemoattractant penetration time. a) 3D and top-down schematics showing the simulation domain, including the cell-seeding chamber, microchannel, and chemoattractant-loading chamber (8 mm dashed line indicates line plot location corresponding to data in panel (d). b) Schematic showing the temporal evolution of the concentration profile. c) Surface plots of FEA simulations using a basis of 50 ng mL−1 fibroblast growth factor (FGF) loaded in a 1.5% w/v alginate hydrogel at t = 4, 8, 24, and 48 h (cmax = 1.3 μm (4 h), 1.1 μm (8 h), 740 nm (24 h), and 540 nm (48 h)). d) Line plots corresponding to panels a and c showing the concentration profiles in the device at 4, 8, 24, and 48 h. The center of the cell-seeding chamber and the entrance to the chemoattractant-loading chamber correspond to the positions of x = 0 and 8 mm, respectively.
Surface plots of the chemoattractant concentration in the device over time are shown in Figure 2c (chemoattractant loading of 50 ng mL−1). Under these conditions, the FGF concentration in the source decreased from 43 to 28 ng mL−1 from 4 to 48 h. As shown in Figure 2d, as the concentration in the chemoattractant source decreased, the concentration at the migrating cell front increased. However, it is important to note that this did not occur immediately upon addition of cell culture medium to the device, but required temporal evolution of the gradient. We found that the temporal evolution of the concentration profile in the microchannel was dependent on the chemoattractant loading concentration. As shown in Figure S4, Supporting Information, the chemoattractant penetration time, defined here as the time at which the concentration of the chemoattractant at the entrance of the cell-seeding chamber exceeded 1 pM, ranged from 7 to 4 h for FGF loading concentrations that ranged from 5 to 100 ng mL−1, respectively. This suggests that modeling of the chemoattractant spatiotemporal concentration profile, such as the magnitude of the gradient at the migrating cell front and chemoattractant penetration time, are needed to correctly compare results from single-source migration studies with different chemoattractants as well as interpret migration responses involving multiple chemoattractants (e.g., spatially opposing chemoattractants).
We next examined the dependence of the gradient characteristics (e.g., penetration time, concentration at the migrating cell front, and concentration gradient at the migrating cell front) on the chemoattractant transport properties. As shown in Figure 2, we found that the temporal evolution of the concentration profile was also dependent on the transport properties of the chemoattractant. This is an important consideration in this study, given EGF and BK differ in size, as EGF is a globular protein and BK is a peptide (6.2 versus 1.1 kDa, respectively). Thus, they exhibit different diffusivities in hydrogel and cell culture medium (see the Experimental Section). We found that the penetration times for EGF and BK ranged from 2.8 to 2.5 h over a loading range of 25–100 ng EGF mL−1 and 0.5–0.2 h over a loading range of 50–400 μm BK, respectively. The model was validated experimentally using fluorescently-labeled dextran with similar diffusivity to BK.[46] The experimentally measured penetration time compared within 10% of the penetration time associated with BK (0.22 versus 0.2 h, respectively). The 10% variation is attributed to potential differences between the experimental diffusivity and the reported value and 2D effects that may be present in the well plate-based measurement format used for experimental validation. The penetration time for FGF, EGF, and BK at all tested loading conditions is shown in Figure S4, Supporting Information. We found that the hydrogel density had a relatively small effect on chemoattractant release based on a 1.8% change in penetration time observed between 2 and 4 wt% alginate (see Figure S5, Supporting Information).
2.3. Effect of EGF and BK Loading Concentration on Glioblastoma Migration Response in the Absence of Competing Chemoattractants
Prior to studying glioblastoma migration toward spatially distributed EGF and BK sources, we first validated the migration assay using a well-established fibroblast-FGF (cell-chemoattractant) system, an important aspect of wound healing processes as shown in Figure 3a. Migration studies repeated at various FGF source loading concentrations ranging from 0 to 100 ng mL−1 showed three important features (see Figure 3b): 1) the onset of chemotactic response; 2) a maximum in chemotactic response; and 3) a saturation effect. As shown in Figure 3b, the minimum FGF loading concentration for which a chemotactic response occurred was 15 ng mL−1. The FGF loading concentration that resulted in a maximum fibroblast migration velocity was 50 ng mL−1 (see Video S1, Supporting Information), at which the velocity was increased by a factor of 1.51 ± 0.40 relative to the negative control in which the chemoattractant was absent. A saturation effect was observed above 50 ng mL−1, at which the migration velocity was increased relative to the negative control by 1.33 ± 0.37. FEA simulations enabled calculation of the temporal FGF concentration profile at the location of the migrating cell front, here taken as the entrance of the cell-seeding chamber, for the range of FGF loading concentrations examined (see Figure 3c). These results compared well with previously reported values,[47] as discussed further in the Discussion Section, suggesting that this platform could provide meaningful data regarding chemotactic response of other cell-chemoattractant systems, such as the chemical signals that drive glioblastoma migration toward vasculature.
Figure 3.
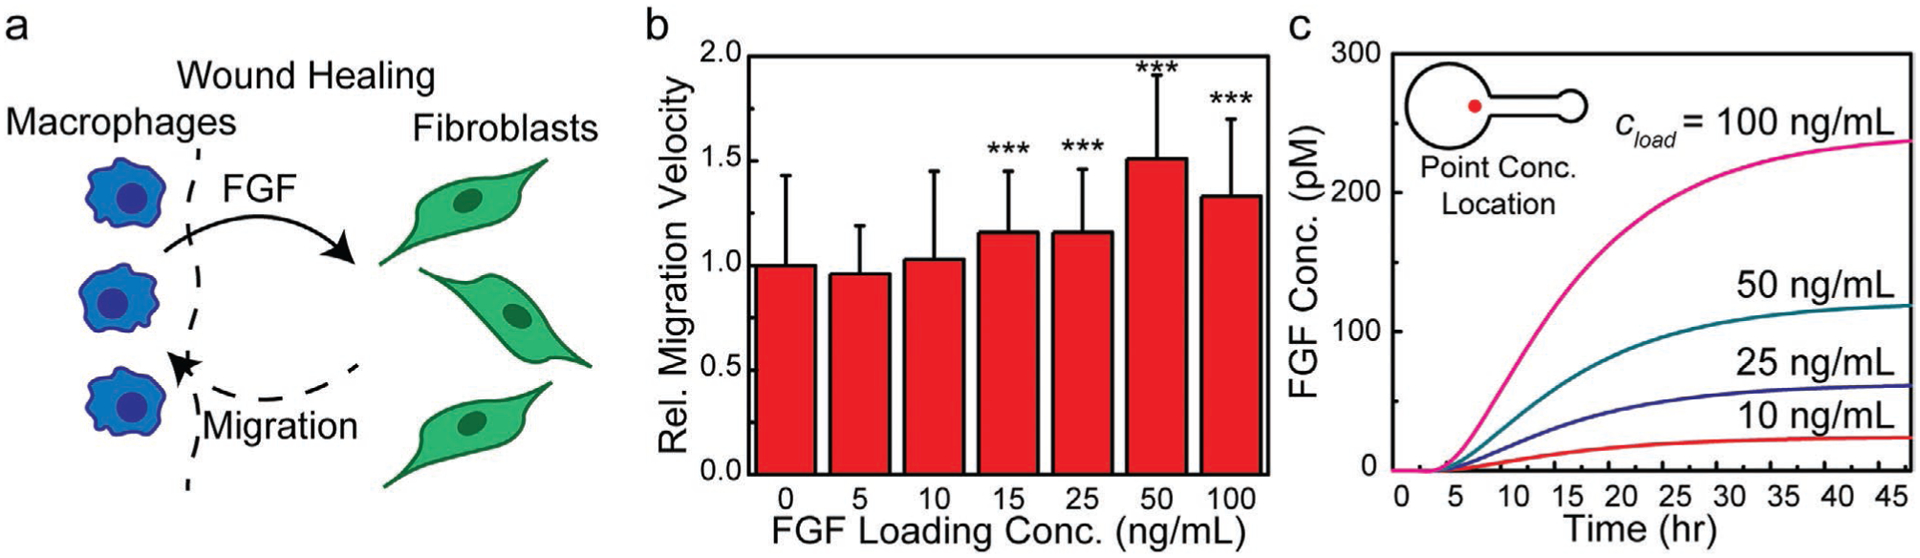
Fibroblast migratory response to a FGF gradient. a) Schematic of fibroblast chemotaxis due to FGF gradients during wound healing. b) Migration velocity relative to the negative control for FGF loading concentrations (cload) of 5, 10, 15, 25, 50, and 100 ng mL−1 showing an optimal concentration at 50 ng mL−1. c) FEA results showing the temporal evolution of the FGF concentration in the cell-seeding chamber (location indicated by the red dot) for FGF loading concentrations of 10, 25, 50, and 100 ng mL−1 (n = 3, Student’s t-test, p-value notation: * = p ≤ 0.05, ** = p ≤ 0.01, *** = p ≤ 0.001).
Having validated the migration assay using the well-established fibroblast-FGF system, we next examined the glioblastoma-EGF and -BK systems using a single-source assay configuration, as such serve as control studies for the subsequent experiments involving competing EGF and BK gradients generated by spatially opposing sources (see Figure 4a). As shown in Figure 4b–e, similar features in the migration response were observed over the range of tested chemoattractant loading concentrations for both the glioblastoma-EGF and -BK systems. EGF loading concentrations of 25, 50, 75, and 100 ng mL−1 were investigated. The concentration at the onset of chemotactic response and the concentration that produced the maximum migration velocity were 50 and 75 ng mL−1, respectively. As shown in Figure 4b, the migration velocity at an EGF loading concentration of 75 ng mL−1 was increased by a factor of 1.44 ± 0.26 relative to the velocity obtained in the control studies in which the chemoattractant was absent (see Video S2, Supporting Information). The migration velocity was relatively decreased above this optimal concentration (i.e., at 100 ng mL−1). The corresponding EGF temporal concentration profile at the entrance to the cell-seeding chamber as obtained via FEA simulations is shown in Figure 4c. BK loading concentrations of 50, 100, 200, and 400 μm were investigated (see Figure 4d). The concentration at the onset of chemotactic response and the concentration that produced the maximum migration velocity were 50 and 100 μm, respectively. As shown in Figure 4d, the migration velocity at a BK loading concentration of 100 μm was increased by a factor of 1.30 ± 0.43 relative to the negative control (see Video S3, Supporting Information). The migration velocity was relatively decreased above this optimal concentration (i.e., at 200 and 400 μm). The FEA data shown in Figure 4e associated with the temporal concentration profile of BK at the entrance to the cell-seeding chamber was validated experimentally using a 10 kDa FITC-dextran at 100 μm. As shown in Figure S6, Supporting Information, the FEA data agreed reasonably with the experimental results regarding the release time delay and duration of the transient period. As shown in Figure S7, Supporting Information, image processing also facilitated the analysis of the trajectory (i.e., direction) associated with the migrating glioblastoma cells. For example, 26% of imaged cells migrated toward the EGF source, defined as the octant at 0° (i.e., consisting of a ± 22.5° region found in a rose plot’s first and fourth quadrants). We note that analysis of migration trajectory becomes a critical aspect of understanding the migration response of glioblastoma cells toward spatially opposing EGF and BK gradients, and is discussed further in the following section.
Figure 4.
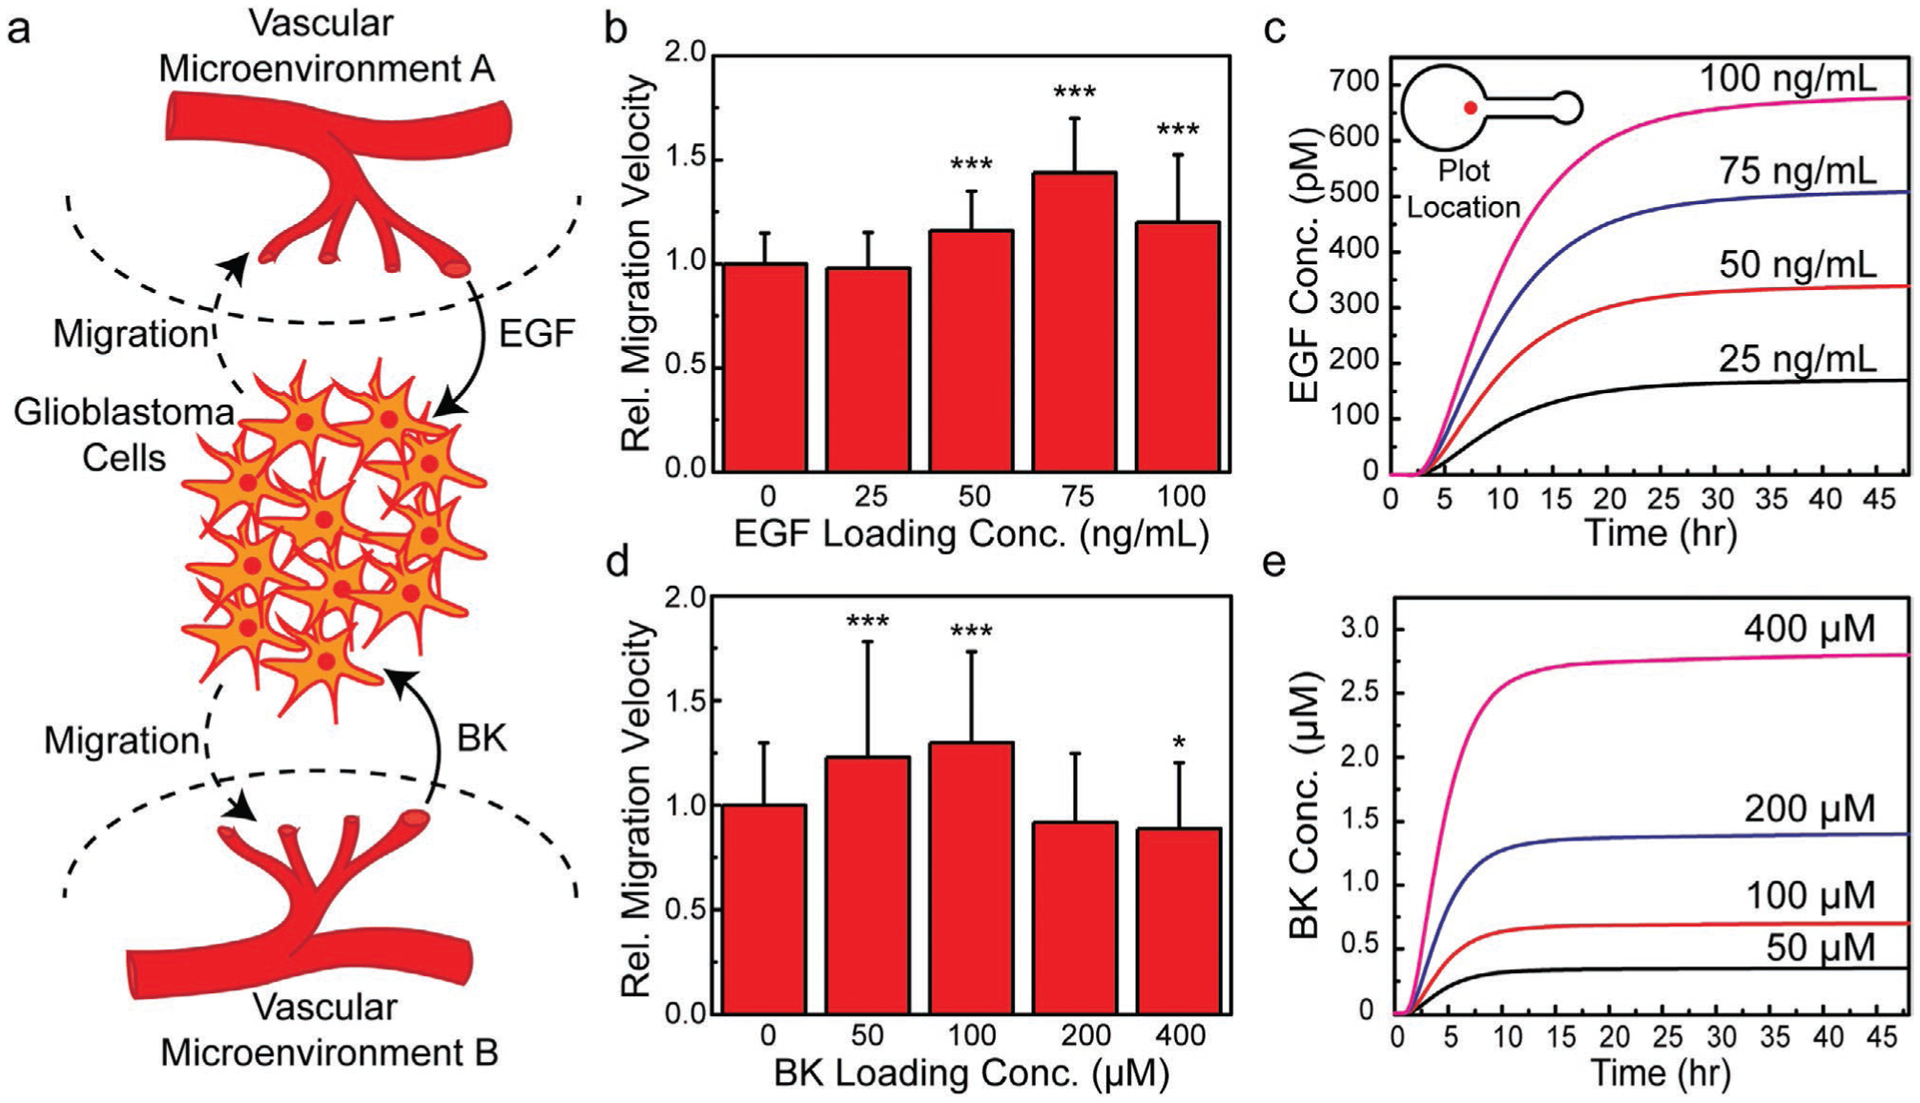
Glioblastoma migratory response toward single sources of chemoattractants in the absence of competing gradients. a) Schematic describing the spatially opposing chemotactic signals that glioblastoma cells encounter in vivo through exposure to spatially varying vascular microenvironments. b) Migration velocity relative to a negative control in which EGF was absent for loading concentrations of 25, 50, 75, and 100 ng mL−1 showing an optimal EGF loading concentration of 75 ng mL−1. c) FEA results showing the temporal evolution of the EGF concentration in the cell plating area for loading concentrations of 25, 50, 75, and 100 ng mL−1. d) Migration velocity relative to a negative control in which BK was absent for loading concentrations of 50, 100, 200, and 400 μm showing an optimal BK loading concentration of 100 μm. e) FEA results showing the temporal evolution of the BK concentration in the cell plating area for loading concentrations of 50, 100, 200, and 400 μm (n = 3, Student’s t-test, p-value notation: * = p ≤ 0.05, ** = p ≤ 0.01, *** = p ≤ 0.001).
2.4. Effect of Spatially Opposing BK Gradients on Chemotactic Response toward EGF Sources
The chemotactic response of glioblastoma cells toward EGF and BK sources in the absence of the other chemoattractant identified the loading concentrations that produced the highest migration velocities (75 ng mL−1 EGF and 100 μm BK, respectively; see Figure 4). We next examined the effect of spatially opposing EGF and BK gradients on the migration response of glioblastoma cells using a multi-source assay configuration (see Figure 5a). The loading concentrations that produced the maximum relative migration velocity in the single-source experiments, also referred to as the “optimal” loading levels, were selected as the basis concentration for the competitive migration assay with spatially distributed sources (i.e., cloading = 75 ng mL−1 and 100 μm for the EGF and BK sources, respectively).
Figure 5.
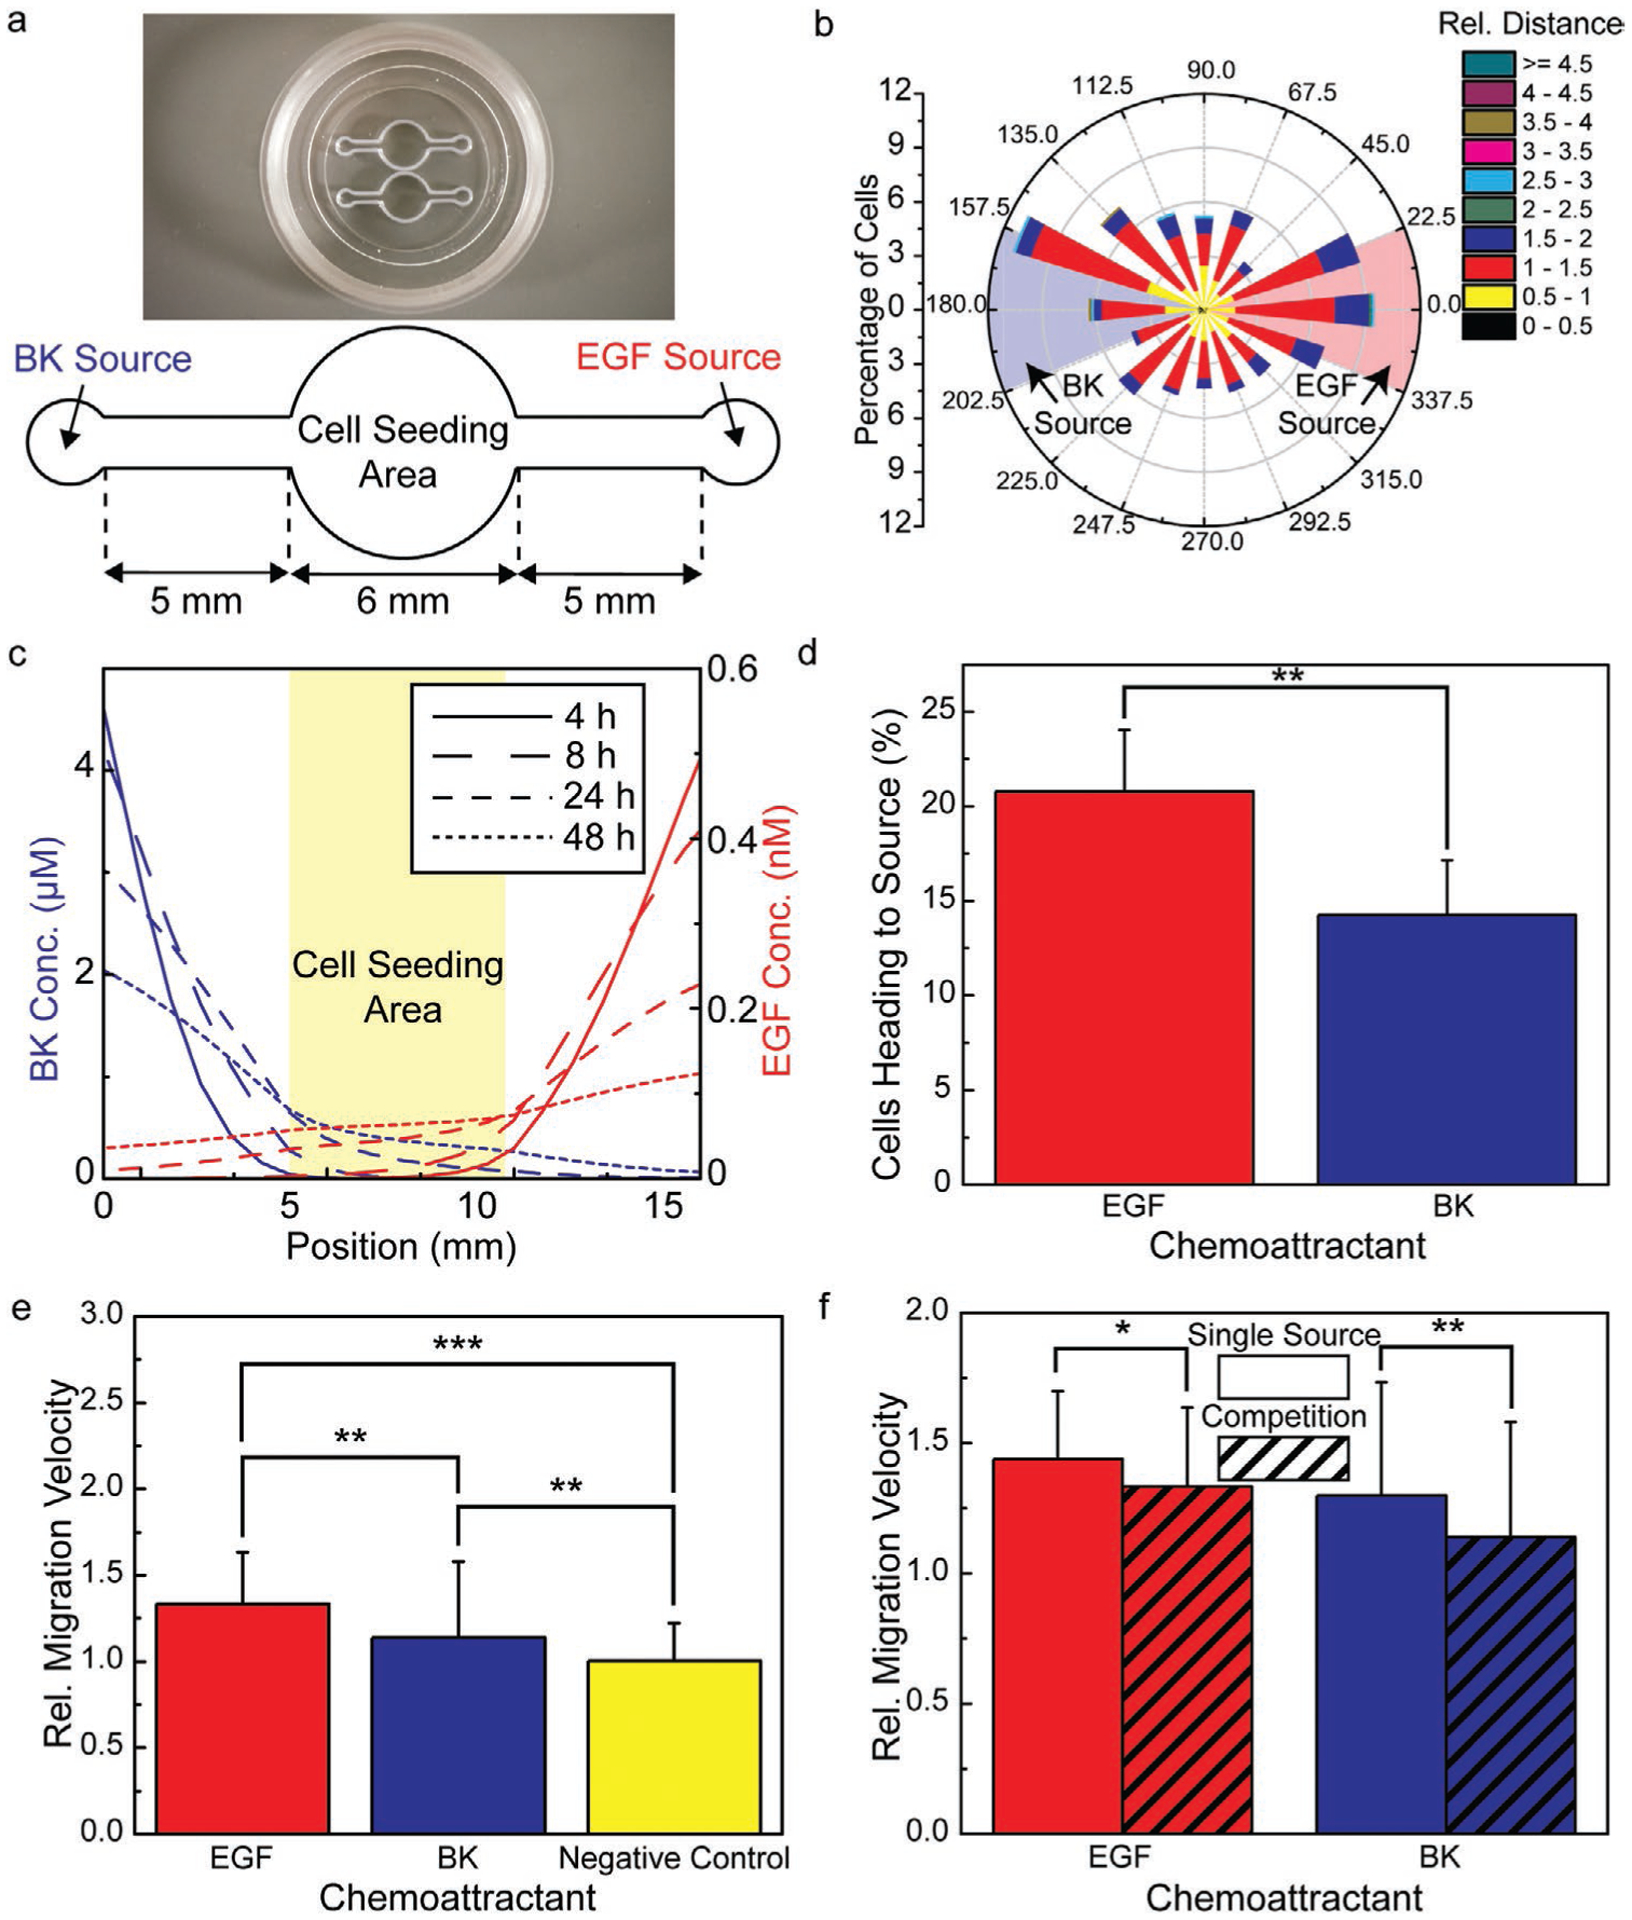
Competitive migration assay results associated with glioblastoma migratory response to spatially opposing gradients of EGF and BK. a) Photograph and schematic of a 3D printed migration assay with spatially opposing chemoattractant sources. b) Rose plot showing the direction and magnitude of cell migration (the EGF and BK sources located at 0 and 180°, respectively). Highlighted regions indicate octants around each source location. c) FEA results showing the temporal evolution of the spatial concentration profile at t = 4, 8, 24, and 48 h. d) Analysis of the rose plot shown in panel b in terms of the percentage of cells heading toward the EGF and BK octants. e) Relative migration velocity of cells heading toward the EGF and BK sources compared to that measured in the absence of EGF or BK, which served as the negative control. f) Relative migration velocity toward the EGF and BK sources in an experiment with competing chemoattractant sources compared to those measured with a single chemoattractant source (n = 3, z-test (d), Student’s t-test (e and f), p-value notation: * = p ≤ 0.05, ** = p ≤ 0.01, *** = p ≤ 0.001).
Given the migration rate toward a chemoattractant source depends on both the concentration of the chemoattractant and gradient of the chemoattractant’s concentration profile,[45] it was of interest to examine their temporal response at the location of the migrating cells (the entrance to the cell-seeding chamber). The migration trajectory is shown in Figure 5b in terms of a rose plot. As shown in Figure 5c, while the concentration at the entrance of the cell seeding area increased throughout the entire experiment, the concentration gradient reached a maximum during the 4–8 h interval, suggesting that the cells would experience a relatively strong driving force associated with cell migration during this period. Cells found in the region of 0 ± 22.5° were classified as migrating toward the EGF source, while those in the region of 180 ± 22.5° were classified as migrating toward the BK source (see Figure 5b). As shown in Figure 5d, 46% more cells migrated toward the EGF source than the BK source based on the ratio of cells migrating toward each source (20.7 ± 3.2% versus 14.2 ± 2.9%, respectively; n = 3 repeated experiments). As shown in Figure 5e, the relative migration velocity toward the EGF source was also higher than toward the spatially opposing BK source, which was consistent with the single-source studies shown in Figure 4. However, the relative migration velocity toward both sources was decreased compared to the measured value in the absence of the other chemoattractant (see Figure 5f). We note that while the presence of a spatially opposing BK gradient decreased the migration velocity toward the EGF source relative to that observed in the absence of BK, the observed effect differed from that caused by uniformly distributed BK (i.e., BK that was added to the cell culture medium). For example, we found that studies involving an EGF gradient established by a source loading concentration of 75 ng mL−1 that contained 700 nm BK in the cell culture medium decreased the migration velocity toward the EGF source to a greater extent than the spatially opposing BK gradient (see Figure S8, Supporting Information). We note that the bulk BK concentration of 700 nm was selected because it was the associated concentration at the migrating cell front at t = 48 h caused by the optimal BK gradient loading conditions. The cells migrated toward the EGF source at a relative velocity of 1.10 ± 0.29 in the presence of bulk BK, which was lower than the migration velocity toward the EGF source both in the absence of BK and in the presence of a spatially opposing gradient of BK (see Figure S8, Supporting Information).
3. Discussion
Various assay formats exist for studying chemotaxis of adherent mammalian cells, such as glial cells, which can be classified in terms of biomimicry, type of gradient (e.g., time-dependent or -independent), and technical complexity. Chamber-based assays, such as Boyden, Zigmond, and Dunn chambers are user-friendly and compatible with manual pipetting techniques. However, they typically only allow for single-source experiments with short gradient timescales. Alternatively, microfluidic-based assays can establish time-independent gradients and be used for competitive migration assays, but they require relatively increased manual fabrication and assembly steps, technical complexity associated with their use, and cost because of the use of relatively larger fluid volumes (e.g., of chemoattractant-containing solutions). Thus, while it is the opinion of the authors that chamber- and microfluidic-based migration assays offer unique advantages, a comparison of results obtained from each platform should consider the spatiotemporal concentration profile and the substrate on which migration is occurring.
The 3D printed migration assay examined here incorporates advantages from each design to facilitate the study of multiple chemoattractants with spatially distributed sources that exhibit gradients that can persist longer than 24 h. This device also allows for in situ spatiotemporal cell tracking to provide trajectory information beyond that of traditional chamber-based devices, which typically rely on cell-counting to quantify the chemotactic response. Additionally, the device was designed for compatibility with manual plating techniques to facilitate user-friendliness and high-throughput studies, a challenge that was recently identified in the migration assay literature.[48] The use of a biofabrication approach here, 3D printing, as opposed to traditional microfabrication processes has further implications in on-chip multiplexing, which can offer improved throughput and measurement confidence, rapid prototyping, and interface with bioprinted tissues, an additional challenge that has been identified in the 3D bioprinting literature.[49] As shown in Figure S9, Supporting Information, we demonstrate that it is possible to easily alter the spatial distribution of the chemoattractant release sources and increase the number of potential competitive chemoattractants. We also show that this approach could potentially be used to study chemotaxis in bioprinted tissue constructs using a one-pot fabrication approach.
The features of the chemotactic response over the range of loading concentrations examined, specifically, the onset, maximum, and saturation of chemotactic response, are consistent with those observed in previous studies using other migration assays.[50,51] The results shown in Figures 3 and 4 associated with the FEA simulations of chemoattractant release and transport provide insight into the effect of assay parameters, such as the loading concentration and chemoattractant transport properties, on resultant gradient characteristics (e.g., the concentration or the magnitude of the concentration gradient at the migrating cell front as well as the time for the chemoattractant to reach the migrating cell front, referred to here as the chemoattractant penetration time).
The results obtained using the fibroblast-FGF cell-chemoattractant system agreed reasonably with the results of previous in vivo studies. For example, the highest migration velocity of fibroblasts occurred using an FGF loading concentration of 50 ng mL−1, which corresponded to a concentration of 120 pM FGF at the migrating cell front at t = 48 h based on our FEA simulations. This value is within the FGF concentration range found in fluid around actively healing wounds (80–130 pM FGF).[47]
The glioblastoma cells exhibited the highest migration velocity to BK loading concentrations that were higher than physiological levels. For example, we found that the BK loading concentration that caused the largest migration velocity was 100 μm, which corresponded to a concentration of 700 nm BK at the migrating cell front at t = 48 h. However, the physiological levels of BK in plasma range from 2 to 4 pM.[52] The EGF loading concentration that caused the highest migration velocity was 75 ng mL−1, which corresponded to a concentration at the migrating cell front of 500 pM at t = 48 h. This value is slightly higher than the physiological plasma levels of EGF, which range from 94 to 122 pM.[15] However, as shown in Figure 4b, we also observed chemotactic response of glioblastoma cells to EGF loading concentrations of 50 ng mL−1, which corresponded to concentrations of EGF at the migrating cell front that were within the physiological plasma EGF levels (see Figure 4c).
Given the experimentally measured migration velocity could be affected by cell proliferation, it was of interest to consider the doubling times of the cells used in comparison to the time over which the cell migration was monitored. For example, previous studies have imposed cell selection criteria for purposes of measuring cell migration velocity in cases when a substantial fraction of cells were either proliferating or blebbing during the cell-tracking interval (e.g., ≈20% of total cells).[53] While the doubling time of the cells used in this study were comparable to the duration of the cell-tracking interval (for example, the doubling time of 3T3 cells has been reported near 24 h,[54] and the doubling time for the D54 glioma cell line has been reported as 46 h in serum-free medium)[55] proliferation artifacts were not observed in this study, which is attributed to the use of a low-nutrient migration buffer. Thus, no cell selection criteria were imposed in this study.
These experimental results and the information regarding physiological levels of EGF suggest the chemotactic response that occurs in vivo under physiological conditions is below the saturation limit of the glioblastoma-EGF and -BK chemotactic response. The χ parameter is a fundamental parameter relating chemotactic flux to the characteristics of the chemoattractant’s concentration profile.[45] Using the normalized migration velocity data from the migration assays and the concentration gradient obtained from the FEA simulations shown in Figure 4b,c, respectively, an effective χ parameter of χe = 5.2 μm4 nmol−1 was obtained for the glioblastoma-EGF system (supporting analysis provided in Figure S10, Supporting Information). While χe was estimated here assuming that the concentration and gradient were constant throughout the migration interval for the sake of demonstrating the value of integrating the results of finite element simulations and experimentation (i.e., measured migration velocities), this approach could potentially enable calculation of a time-dependent χ parameter. However, such a calculation would require use of an instantaneous migration velocity as opposed to a time-averaged migration velocity that was used for calculation of χe and is beyond the scope of this study. Overall, these experimental and computational results obtained from the single-source chemotactic assays provide useful data for understanding the chemotactic responses of glial cells[45] and creating devices for chemotactically-driven tumor cell isolation.[56]
The results from the competitive migration assays with spatially opposing EGF and BK gradients provide new insight into the chemical signaling that drives glioblastoma toward vasculature. While EGF appeared to elicit a “stronger” chemotactic response based on migration velocity, 14% of cells still migrated toward the BK source, which differed from the value observed in control studies (10%; p < 0.01). This result demonstrates the challenges associated with preferentially guiding cells in vivo using a chemotactic signal—that is, random migration and chemotaxis toward other chemoattractant sources. Thus, these results are potentially useful for understanding a variety of higher-order physiological and pathophysiological processes as well as tissue engineering applications associated with chemotaxis. For example, tissue scaffolds often contain gradients of multiple chemoattractants to facilitate the regeneration of complex tissues.[34,57,58] Understanding and designing spatiotemporal concentration profiles of chemoattractants, such as growth factors, has been identified as a major challenge for tissue engineering and regenerative medicine.[49] For example, it has been suggested that mass transport processes in bioprinted tissue constructs must be studied to create optimally engineered tissue systems that mimic native tissue, facilitate cellular ingrowth, and control complex heterogeneous tissues.[49]
4. Conclusions
We report on new insights to the chemotactic response of glioblastoma cells toward vasculature. Specifically, a user-friendly, multiplexed migration assay enabled a study of the effect of spatially opposing gradients of the peptide BK on the migration response of glioblastoma cells toward EGF sources. Competitive migration assays involving spatially opposing gradients of EGF and BK at their respective optimal levels determined from single-source and -chemoattractant assays showed that glioblastoma cells exhibited a relatively increased migration velocity and extent of migration toward EGF sources. However, a substantial fraction of cells migrated toward the BK source, which was the relatively “weaker” chemoattractant. The migration velocities toward spatially distributed sources in the presence of spatially opposing EGF and BK gradients were reduced relative to those found in the absence of the competing chemoattractant. This work provides new insight to the chemical signaling that attracts glioblastoma to vasculature and valuable information for improving the efficacy of 3D printed scaffolds that contain multiple spatially distributed chemoattractants.
5. Experimental Section
Materials:
Silicone (SI 595 CL) was purchased from Ellsworth Adhesives. Alginic acid sodium salt from brown algae, calcium carbonate, hexadimethrine bromide, bradykinin acetate salt (BK; MW = 1.1 kDa), flourescein isothiocyanate (FITC)-labeled dextran (MW = 10 kDa), and glucono-δ-lactone (GDL) were purchased from Sigma-Aldrich. Dulbecco’s modified Eagle’s medium/F12 (DMEM/F12), bovine serum albumin (BSA), penicillin-streptomycin (10 000 U mL−1), recombinant human basic fibroblast growth factor (FGF; AA 1–15; MW = 17.2 kDa), recombinant human epidermal growth factor (EGF; MW = 6.2 kDa), and antibiotic-antimycotic (Anti-Anti, 100X) were purchased from Thermo-Fisher. Fetal bovine serum (FBS) was from Aleken Biologicals.
3D Printing:
A custom microextrusion 3D printer comprised of a desktop computer, a gantry robot (F5200N.1, Fisnar), and a digital dispenser (Nordson EFD, Ultimus V) was used for fabrication of the migration assays. Silicone was loaded into a 5 cc syringe with a 27 ga tapered nozzle. A print speed of 2 mm s−1 was implemented with a dispensing pressure of 18 psi. Three migration chambers were printed per cell culture imaging dish (35 mm; μ-dish glass bottom; Ibidi) using a single g-code program via vendor provided software (RoboEdit, Fisnar). A 2D DXF file stacked in the z direction with a 300 μm step for a final height of 2.0 mm was imported for the path data. Following 3D printing, the devices were cured at room temperature prior to use.
Finite Element Simulations:
A commercially available FEA software (COMSOL Multiphysics, version 5.3a) was used to model the mass transport of the chemoattractants in the device. A transient, 3D simulation using the transport of diluted species physics module was executed over a 3D domain comprised of hydrogel and water subdomains, which solved the following set of equations:
| (1) |
| (2) |
where ci is the concentration of ith chemoattractant, t is time, Ji is diffusive flux, and Di is the diffusion coefficient, subject to a set of boundary and initial conditions specified by the assay design (e.g., the chemoattractant loading concentration). As shown in Equation (1), the model was solved assuming Fickian diffusion of the chemoattractant in both sub-domains and neglecting hydrogel swelling effects. Diffusion coefficients of peptides with similar MW to BK were implemented in the model. The following diffusion coefficients were used in the hydrogel domain: DFGF/Gel = 3.5 × 10⁻⁷ cm2 s−1,[59] DEGF/Gel = 5.2 × 10⁻⁷ cm2 s−1,[60] and DBK/Gel = 2.2 × 10⁻⁸ cm2 s−1.[61] In the water domain the diffusion coefficients were: DFGF/Water = 1 × 10⁻⁶ cm2 s−1,[62] DEGF/Water = 1.6 × 10⁻⁶ cm2 s−1,[60] and DBK/Water = 3.5 × 10⁻⁶ cm2 s−1.[63] The initial concentration of the hydrogel domain were defined by the experimental values (5, 10, 25, 50, and 100 ng mL−1 FGF; 25, 50, and 100 ng mL−1 EGF; and 50, 100, 200, and 400 μm BK). The initial concentration in the water domain was zero. The concentration was calculated in terms of molarity using the following vendor-provided molecular weights. A flux continuity condition was implemented between the hydrogel and water domain, and a no flux condition was applied on all other boundaries. The model was discretized using a fine physics-controlled mesh resulting in 2081 elements and solved with a 0.1 h time step for 48 h. The output of the simulation was the 3D spatiotemporal concentration profile of the chemoattractant in the device (i.e., each computational domain).
Experimental Measurement of Passive Drug Release from a Hydrogel Source:
The method for measuring passive temporal drug release from the hydrogel system was adapted from our previous report.[34] Alginate solutions were prepared at 1.5% w/v in a 100 μm FITC-dextran solution. A droplet (5 μL) was then deposited at the edge of a well in a 96-well plate and allowed to cure. 100 μL of DI water was then added to the well. The fluorescence signal of the well was subsequently recorded every 15 min using a fluorescence well-plate reader (Biotek Synergy H1, 488 nm excitation 525 nm emission). The measurement was repeated in triplicate. Concentration was interpreted as the normalized fluoresence intensity defined as the change in fluoresence divided by the total change in fluoresence.
Cell Culture:
Human glioblastoma cells (D54-MG, WHO Grade IV; Dr. D. Bigner, Duke University, Durham, NC), which had previously been made into a stably expressing eGFP cell line,[64] were maintained in DMEM/F12 supplemented with 7% FBS in a 37 °C 10%-CO2 incubator. Mouse embryonic fibroblasts (NIH/3T3, ATCC) were obtained and a stable eGFP expressing cell line was generated as follows. Lentivirus particles (CSCGW2-eGFP-IG, MGH Vector Core) were applied at a multiplicity of infection (MOI) of 20.0 with 8 μg μL−1 hexadimethrine bromide to 3T3 cells for 24 h. Approximately 72–96 h after viral transduction, the cells were sorted into eGFP positive and negative populations using fluorescence-activated cell sorting (FACS, Sony SH800). The resulting 3T3-eGFP cells were maintained in DMEM/F12 supplemented with 100 U mL−1 penicillin-100 μg mL−1 streptomycin and 10% FBS in a 37°C 5%-CO2 incubator.
Hydrogel Preparation:
Sterile alginate hydrogel solutions were prepared immediately prior to use. GDL (0.2% w/v) was added to 5 mL of 1.5% w/v alginate solution and vortexed for 30 s. Calcium carbonate (0.3% w/v) was then added and vortexed for 1 min to homogenize the mixture. This resulted in a hydrogel solution that cured in approximately 2 h.
Migration Assay:
Following 3D printing, the devices were sterilized with 70% ethanol, triple-rinsed with sterile DPBS, and allowed to dry in a biosafety cabinet with 30 min of UV exposure. 3T3-eGFP cells were plated by depositing 10 μL of cell suspension that contained 500 cells μL−1 at the center of the cell seeding chamber. D54-eGFP cells were plated by depositing 10 μL of cell suspension that contained 1000 cells μL−1 (single-chemoattractant experiments) or 500 cells μL−1 (competitive-chemoattractant experiments) at the center of the cell-seeding chamber. To maintain a constant contact area between the droplet and the petri dish, the 10 μL droplet of cell suspension was supplemented with 1 μL of culture medium approximately every hour until the start of the time-lapse migration experiment. Two hours after cells were plated in the migration chamber, the hydrogel solution was prepared and the chemoattractant was added at the specified concentration (FGF for 3T3 cells; EGF and BK for D54eGFP cells). The resulting solutions were then pipetted into the migration chamber and allowed to crosslink for approximately 2 h. At 4 h following cell plating in the cell-seeding chamber, the initial plating medium was removed by the addition of a second droplet of cell culture medium (≈30 μL) to the initial droplet, followed by aspiration of all the medium. Subsequently, a low-nutrient migration buffer (DMEM/F12 + 0.025–0.1% BSA + 1X Anti-Anti) was added to fill the entire device (70 μL total volume). The migration chamber dish was then placed in a closed-system imaging chamber (Micro-Incubator Platform, Warner, DH-40iL) within an environmental incubator (Weather Station) on an inverted Olympus IX81 microscope outfitted with a Hamamatsu ORCA-ER digital camera, which afforded localized control of atmospheric CO2 concentrations (5%-CO2 3T3, 10%-CO2 D54; Okolab DCTC02BX) and thermal regulation (Weather Station). Multipoint time-lapse images were acquired every 20 min for 48 h with differential interference contrast (DIC) and fluorescent imaging using Slidebook 6 software and an encoded Prior Stage. In the non-competitive migration assays, the image data associated with the cell-tracking analysis were acquired at the entrance of the cell-seeding chamber for each time point. In the competitive migration assays, the image data associated with the cell-tracking analyses were acquired at three locations for each time-point (the center of the cell-seeding chamber and both entrances of the cell-seeding chamber). These areas were selected to mitigate any potential bias in the migration analyses that could be caused by an imbalance in the imaging locations. In all cases, the imaging field was fixed.
Data Analysis:
Time-lapse data were analyzed using the NIS-Elements 2D Tracking Module (v5.0) in combination with the Spot Detection and Binary applications, which provided a migration velocity for each cell. The relative migration velocity was then obtained as the ratio of the migration velocity in the presence of the chemoattractant to that observed in negative control studies in which the chemoattractant was absent that were conducted in the same petri dish (i.e., with a multiplexed configuration). Only cells that were present throughout the entire time-lapse period (48 h) were analyzed and no additional cells were excluded. In fibroblast and glioma tracking studies, the number of tracked cells ranged from 14–73 to 54–124, respectively.
Statistical Analysis:
Experiments were performed in triplicate. Statistical analysis was performed using OriginPro (version 8.0). Error bars and ± symbol indicate standard deviation. A Student’s t-test was used to determine significance among the relative migration velocity datasets. A two-proportion z-test was used to determine significance in the chemoattractant trajectory data acquired from the competitive experiments. Statistical calculations were executed with 95% confidence intervals and two tailed distributions. Error bars indicated standard deviation.
Supplementary Material
Acknowledgements
A.P.H and E.G.T. contributed equally to this work. B.N.J. is grateful for the generous support of the National Science Foundation (CMMI-173198), which provided partial funding for the reported work. H.S. and E.G.T. were supported by NIH 1R01CA227149-01.
Footnotes
Supporting Information
Supporting Information is available from the Wiley Online Library or from the author.
Conflict of Interest
The authors declare no conflict of interest.
Contributor Information
Alexander P. Haring, Department of Industrial and Systems Engineering, Virginia Tech, Blacksburg, VA 24061, USA
Sahil Laheri, Department of Industrial and Systems Engineering, Virginia Tech, Blacksburg, VA 24061, USA.
Harald Sontheimer, Glial Biology in Health, Disease and Cancer Center, Carillion Fralin Biomedical Research Institute, Roanoke, VA 24016, USA; School of Neuroscience, Virginia Tech, Blacksburg, VA 24061, USA.
Blake N. Johnson, Department of Industrial and Systems Engineering, Virginia Tech, Blacksburg, VA 24061, USA School of Neuroscience, Virginia Tech, Blacksburg, VA 24061, USA.
References
- [1].Van Haastert PJ, Devreotes PN, Nat. Rev. Mol. Cell Biol 2004, 5, 626. [DOI] [PubMed] [Google Scholar]
- [2].Jin T, Xu X, Hereld D, Cytokine 2008, 44, 1. [DOI] [PMC free article] [PubMed] [Google Scholar]
- [3].Eswarakumar VP, Lax I, Schlessinger J, Cytokine Growth Factor Rev. 2005, 16, 139. [DOI] [PubMed] [Google Scholar]
- [4].Yun YR, Won JE, Jeon E, Lee S, Kang W, Jo H, Jang JH, Shin US, Kim HW, J. Tissue Eng 2010, 1, 218142. [DOI] [PMC free article] [PubMed] [Google Scholar]
- [5].Volin MV, Shah MR, Tokuhira M, Haines GK, Woods JM, Koch AE, Clin. Immunol. Immunopathol 1998, 89, 44. [DOI] [PubMed] [Google Scholar]
- [6].Roussos ET, Condeelis JS, Patsialou A, Nat. Rev. Cancer 2011, 11, 573. [DOI] [PMC free article] [PubMed] [Google Scholar]
- [7].Cuddapah VA, Robel S, Watkins S, Sontheimer H, Nat. Rev. Neurosci 2014, 15, 455. [DOI] [PMC free article] [PubMed] [Google Scholar]
- [8].Ostrom QT, Gittleman H, Truitt G, Boscia A, Kruchko C, Barnholtz-Sloan JS, Neuro-Oncology 2018, 20, iv1. [DOI] [PMC free article] [PubMed] [Google Scholar]
- [9].Seifert S, Sontheimer H, J. Physiol 2014, 592, 5109. [DOI] [PMC free article] [PubMed] [Google Scholar]
- [10].Cuddapah VA, Turner KL, Seifert S, Sontheimer H, J. Neurosci 2013, 33, 1427. [DOI] [PMC free article] [PubMed] [Google Scholar]
- [11].Lund-Johansen M, Bjerkvig R, Humphrey PA, Bigner SH, Bigner DD, Laerum OD, Cancer Res 1990, 50, 6039. [PubMed] [Google Scholar]
- [12].Bomben VC, Turner KL, Barclay TT, Sontheimer H, J. Cell. Physiol 2011, 226, 1879. [DOI] [PMC free article] [PubMed] [Google Scholar]
- [13].C. G. A. R. Network, Nature 2008, 455, 1061.18772890 [Google Scholar]
- [14].Libermann TA, Nusbaum HR, Razon N, Kris R, Lax I, Soreq H, Whittle N, Waterfield MD, Ullrich A, Schlessinger J, Nature 1985, 313, 144. [DOI] [PubMed] [Google Scholar]
- [15].Joh T, Itoh M, Katsumi K, Yokoyama Y, Takeuchi T, Kato T, Wada Y, Tanaka R, Clin. Chim. Acta 1986, 158, 81. [DOI] [PubMed] [Google Scholar]
- [16].Pan WH, Kastin AJ, Peptides 1999, 20, 1091. [DOI] [PubMed] [Google Scholar]
- [17].Kim BJ, Wu M, Ann. Biomed. Eng 2012, 40, 1316. [DOI] [PMC free article] [PubMed] [Google Scholar]
- [18].Chen H-C, in Cell Migration: Developmental Methods and Protocols, (Ed: Guan J-L), Humana Press, Totowa, NJ: 2005, p. 15. [Google Scholar]
- [19].Somaweera H, Ibraguimov A, Pappas D, Anal. Chim. Acta 2016, 907, 7. [DOI] [PubMed] [Google Scholar]
- [20].Zicha D, Dunn G, Jones G, in Basic Cell Culture Protocols, Springer, Berlin: 1997, p. 449. [Google Scholar]
- [21].Zicha D, Dunn GA, Brown AF, J. Cell Sci 1991, 99, 769. [DOI] [PubMed] [Google Scholar]
- [22].Heit B, Tavener S, Raharjo E, Kubes P, J. Cell Biol 2002, 159, 91. [DOI] [PMC free article] [PubMed] [Google Scholar]
- [23].Li J, Lin F, Trends Cell Biol. 2011, 21, 489. [DOI] [PubMed] [Google Scholar]
- [24].Chung BG, Choo J, Electrophoresis 2010, 31, 3014. [DOI] [PubMed] [Google Scholar]
- [25].Wu H, Huang B, Zare RN, J. Am. Chem. Soc 2006, 128, 4194. [DOI] [PubMed] [Google Scholar]
- [26].Mendelson A, Cheung Y, Paluch K, Chen M, Kong K, Tan J, Dong Z, Sia SK, Mao JJ, Lab Chip 2013, 13, 1156. [DOI] [PMC free article] [PubMed] [Google Scholar]
- [27].Huang PH, Chan CY, Li P, Wang Y, Nama N, Bachman H, Huang TJ, Lab Chip 2018, 18, 1411. [DOI] [PMC free article] [PubMed] [Google Scholar]
- [28].Huang PH, Chan CY, Li P, Nama N, Xie Y, Wei CH, Chen Y, Ahmed D, Huang TJ, Lab Chip 2015, 15, 4166. [DOI] [PMC free article] [PubMed] [Google Scholar]
- [29].Gupta MK, Meng F, Johnson BN, Kong YL, Tian L, Yeh YW, Masters N, Singamaneni S, McAlpine MC, Nano Lett. 2015, 15, 5321. [DOI] [PMC free article] [PubMed] [Google Scholar]
- [30].Haage A, in American Society for Cell Biology: Science News, ASCB, Bethesda, MD: 2018. [Google Scholar]
- [31].Espinosa-Hoyos D, Jagielska A, Homan KA, Du H, Busbee T, Anderson DG, Fang NX, Lewis JA, Van Vliet KJ, Sci. Rep 2018, 8, 478. [DOI] [PMC free article] [PubMed] [Google Scholar]
- [32].Haring AP, Thompson EG, Tong Y, Laheri S, Cesewski E, Sontheimer H, Johnson BN, Biofabrication 2019, 11, 025009. [DOI] [PubMed] [Google Scholar]
- [33].Johnson BN, Jia X, Neural Regener. Res 2016, 11, 1568. [DOI] [PMC free article] [PubMed] [Google Scholar]
- [34].Johnson BN, Lancaster KZ, Zhen G, He J, Gupta MK, Kong YL, Engel EA, Krick KD, Ju A, Meng F, Enquist LW, Jia X, McAlpine MC, Adv. Funct. Mater 2015, 25, 6205. [DOI] [PMC free article] [PubMed] [Google Scholar]
- [35].Zhu W, Tringale KR, Woller SA, You S, Johnson S, Shen H, Schimelman J, Whitney M, Steinauer J, Xu W, Yaksh TL, Nguyen QT, Chen S, Mater. Today 2018, 21, 951. [DOI] [PMC free article] [PubMed] [Google Scholar]
- [36].Tong Y, Murbach JM, Subramanian V, Chhatre S, Delgado F, Martin DC, Otto KJ, Romero-Ortega M, Johnson BN, MRS Adv. 2018, 3, 2365. [Google Scholar]
- [37].Haring AP, Sontheimer H, Johnson BN, Stem Cell Rev. Rep 2017, 13, 381. [DOI] [PMC free article] [PubMed] [Google Scholar]
- [38].Yazdi AA, Popma A, Wong W, Nguyen T, Pan YY, Xu J, Microfluid. Nanofluid 2016, 20, 50. [Google Scholar]
- [39].Cesewski E, Haring AP, Tong Y, Singh M, Thakur R, Laheri S, Read KA, Powell MD, Oestreich KJ, Johnson BN, Lab Chip 2018, 18, 2087. [DOI] [PMC free article] [PubMed] [Google Scholar]
- [40].Singh M, Tong Y, Webster K, Cesewski E, Haring AP, Laheri S, Carswell B, O’Brien TJ, Aardema CH, Senger RS, Robertson JL, Johnson BN, Lab Chip 2017, 17, 2561. [DOI] [PubMed] [Google Scholar]
- [41].Johnson BN, Lancaster KZ, Hogue IB, Meng F, Kong YL, Enquist LW, McAlpine MC, Lab Chip 2016, 16, 1393. [DOI] [PMC free article] [PubMed] [Google Scholar]
- [42].Haring AP, Khan AU, Liu GL, Johnson BN, Adv Opt Mater 2017, 5, 1. [Google Scholar]
- [43].Haring AP, Tong Y, Halper J, Johnson BN, Adv. Healthcare Mater 2018, 7, 1800213. [DOI] [PubMed] [Google Scholar]
- [44].Berman B, Business Horizons 2012, 55, 155. [Google Scholar]
- [45].Chaplain MA, Stuart AM, Math. Med. Biol 1993, 10, 149. [DOI] [PubMed] [Google Scholar]
- [46].Lebrun L, Junter GA, Enzyme Microb. Technol 1993, 15, 1057. [DOI] [PubMed] [Google Scholar]
- [47].Howdieshell TR, Riegner C, Gupta V, Callaway D, Grembowicz K, Sathyanarayana P. L. McNeil, Ann. Surg 1998, 228, 707. [DOI] [PMC free article] [PubMed] [Google Scholar]
- [48].Raja WK, Gligorijevic B, Wyckoff J, Condeelis JS, Castracane J, Integr. Biol 2010, 2, 696. [DOI] [PMC free article] [PubMed] [Google Scholar]
- [49].Bittner SM, Guo JL, Mikos AG, Bioprinting 2018, 12, e00032. [DOI] [PMC free article] [PubMed] [Google Scholar]
- [50].Postlethwaite AE, Keski-Oja J, Moses HL, Kang AH, J. Exp. Med 1987, 165, 251. [DOI] [PMC free article] [PubMed] [Google Scholar]
- [51].Brockmann MA, Ulbricht U, Gruner K, Fillbrandt R, Westphal M, Lamszus K, Neurosurgery 2003, 52, 1391. [DOI] [PubMed] [Google Scholar]
- [52].Nussberger J, Cugno M, Amstutz C, Cicardi M, Pellacani A, Agostoni A, Lancet 1998, 351, 1693. [DOI] [PubMed] [Google Scholar]
- [53].Zaman MH, Trapani LM, Sieminski AL, MacKellar D, Gong H, Kamm RD, Wells A, Lauffenburger DA, Matsudaira P, Proc. Natl. Acad. Sci. USA 2006, 103, 10889. [DOI] [PMC free article] [PubMed] [Google Scholar]
- [54].Mischak H, Goodnight J, Kolch W, Martiny-Baron G, Schaechtle C, Kazanietz M, Blumberg P, Pierce J, Mushinski J, J. Biol. Chem 1993, 268, 6090. [PubMed] [Google Scholar]
- [55].Akslen LA, Andersen KJ, Bjerkvig R, Anticancer Res 1988, 8, 797. [PubMed] [Google Scholar]
- [56].van der Sanden B, Appaix F, Berger F, Selek L, Issartel JP, Wion D, Future Oncol. 2013, 9, 817. [DOI] [PMC free article] [PubMed] [Google Scholar]
- [57].Ko IK, Lee SJ, Atala A, Yoo JJ, Exp. Mol. Med 2013, 45, e57. [DOI] [PMC free article] [PubMed] [Google Scholar]
- [58].Schantz JT, Chim H, Whiteman M, Tissue Eng. 2007, 13, 2615. [DOI] [PubMed] [Google Scholar]
- [59].Tanaka H, Matsumura M, Veliky IA, Biotechnol. Bioeng 1984, 26, 53. [DOI] [PubMed] [Google Scholar]
- [60].Thorne RG, Hrabetova S, Nicholson C, J. Neurophysiol 2004, 92, 3471. [DOI] [PubMed] [Google Scholar]
- [61].Censi R, Fieten PJ, di Martino P, Hennink WE, Vermonden T, Macromolecules 2010, 43, 5771. [DOI] [PubMed] [Google Scholar]
- [62].Young ME, Carroad PA, Bell RL, Biotechnol. Bioeng 1980, 22, 947. [Google Scholar]
- [63].Chatterjee C, Mukhopadhyay C, Biopolymers 2005, 78, 197. [DOI] [PubMed] [Google Scholar]
- [64].Watkins S, Robel S, Kimbrough IF, Robert SM, Ellis-Davies G, Sontheimer H, Nat. Commun 2014, 5, 4196. [DOI] [PMC free article] [PubMed] [Google Scholar]
Associated Data
This section collects any data citations, data availability statements, or supplementary materials included in this article.