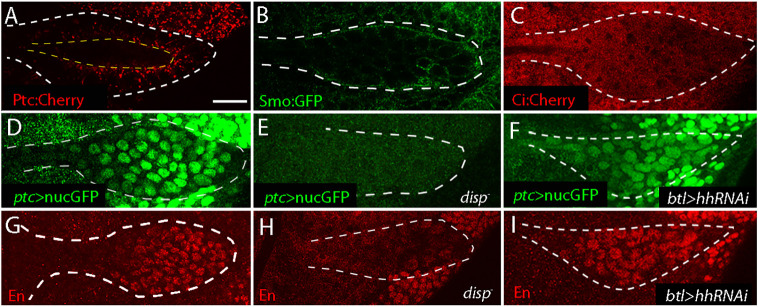
Fig. 2.
Graded output of Hh targets in ASP. (A-C) ASP distributions of Ptc:Cherry (A), Smo:GFP (B) and Ci:Cherry (C). Ptc:Cherry (A) localizes apically (dashed yellow lines). (D-F) ASP (white dashed line) ptc>nucGFP fluorescence of control (D), disp− (E) and genotype expressing hh RNAi in ASP (F, btl-Gal4 >hhRNAi). (G-I) ASP (white dashed line) α-En fluorescence of control (G), disp− (H) and genotype expressing hh RNAi in ASP (I, btl-Gal4 >hhRNAi). Scale bar: 20 μm.

