Fig. 8.
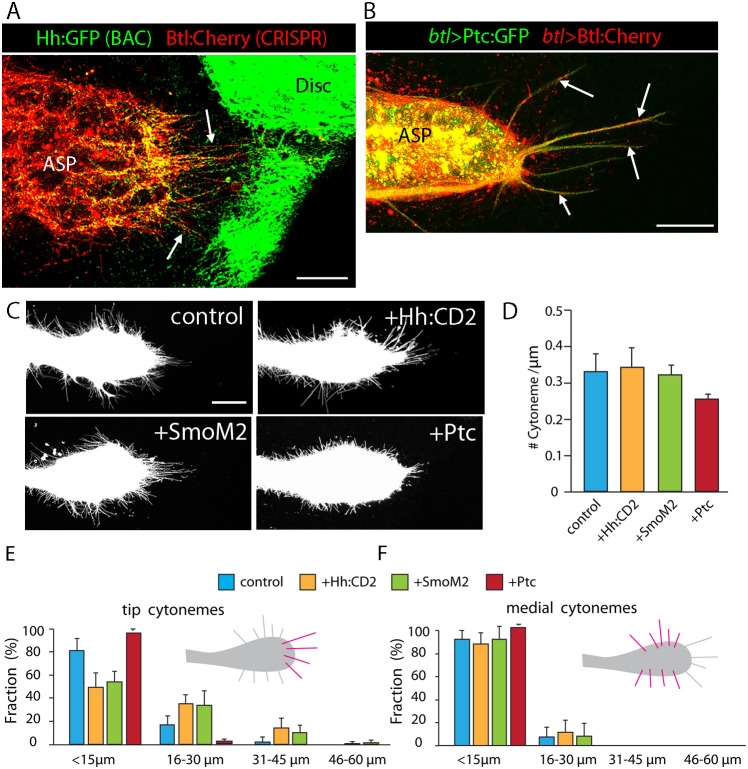
Cytonemes respond to Hh signaling. (A) BAC-encoded Hh:GFP (green) and CRISPR-generated Btl:Cherry knock-in (red) in ASP and disc. Tip cytonemes marked by Btl:Cherry and Hh:GFP (arrows). Genotype: Hh:GFP/+; Btl:Cherry/+. (B) Arrows show tip cytonemes containing Ptc:GFP and Btl:Cherry in ASP that expresses Ptc:GFP (green) and Btl:Cherry (red). Genotype: btl-Gal4, UAS-Btl:Cherry; UAS-Ptc:GFP/+. (C) ASPs with btl-Gal4 UAS-mCD8:GFP only (control) or with Hh:CD2, SmoM2 and Ptc. Genotypes: control (btl-Gal4, UAS-mCD8:GFP/+; Gal80ts/+); +Hh:CD2 (btl-Gal4, UAS-mCD8:GFP/+; Gal80ts/UAS-Hh:CD2), +SmoM2 (btl-Gal4, UAS-mCD8:GFP/+; Gal80ts/UAS-SmoM2) and +Ptc (btl-Gal4, UAS-mCD8:GFP/+; Gal80ts/UAS-Ptc). (D-F) Graphs showing density of ASP cytonemes measured as # cytonemes/µm of ASP perimeter (D), and fraction of cytonemes of indicated lengths at ASP tip (E) and medial region (F). The statistically significant differences between control and experimental genotypes (unpaired two-tailed Student's t-test, P<0.05) are cytoneme lengths for UAS-Ptc and number of tip cytonemes for UAS-Hh:CD2 and UAS-SmoM2 in D. For each genotype (n=10), except UAS-Ptc (n=4). Scale bars: 25 μm.

