Abstract
The current obesity epidemic faces unmet mechanistic insights. It is known that the acute activity changes of a growing number of brain neurons rapidly alter feeding behaviour; however, how these changes translate to obesity development and the fundamental mechanism underlying brain neurons in controlling body weight remain elusive. Here, we show that chronic activation of hypothalamic arcuate GABAergic (GABA+), agouti-related protein (AgRP) neurons or arcuate non-AgRP GABA+ neurons all leads to obesity, which is similar the obese phenotype observed in ob/ob mice. Conversely, chronic inhibition of arcuate GABA+, but not AgRP neurons, reduces aging-related weigh gain and corrects ob/ob obesity. These results demonstrate that the modulation of Arc GABA+ neurons is a fundamental mechanism of body weight regulation and that arcuate GABA+ neurons are the major mediator of leptin action with a significant and redundant role in obesity development.
Keywords: GABA, obesity, AgRP, leptin
Introduction
Obesity has reached epidemic levels, and continues to cause an enormous burden to human health and society. Despite extensive research, and increasing civil and governmental efforts aiming to reverse obesity trends, worldwide obesity rates are still rising. The reasons underlying such susceptibility to obesity development and correlated difficulty in weight loss remain unclear. Agouti-related protein (AgRP) neurons, a subset of arcuate (Arc) GABAergic (GABA+) neurons, potently regulate short-term feeding behavior, as previously shown by acute manipulations of their activity 1–4. However, as AgRP neuron activity is inhibited during natural feeding 5–8, how changes in short term feeding relate to obesity development is unknown. For leptin action, it has been postulated that leptin effects on body weight are mediated by a distributed neural netwok in the brain 9–12. Specifically, AgRP neuron-specific deletion or restoration of leptin receptor (LepR) in the db/db background produces little effects on body weight 13–15, suggesting a relative mild role for AgRP neuorns in mediating the leptin action. Deletion of LepR in GABAergic, but not glutamatergic, neurons produces obesity that is comparable to leptin deficient ob/ob mice 16, demonstrating a major role of GABAergic neurons. The contrasting outcome in body weight from LepR deletion in AgRP versus GABAergic neurons suggests an important role for non-AgRP GABAergic neurons in mediating the leptin action. However, the location of those non-AgRP GABAergic neurons remains elusive. Surprisingly, a recent study on deletion of LepR in adult AgRP neurons suggests that AgRP neurons are the major mediator of leptin action on body weight regulation 17. Thus, despite the intense research focusing on AgRP neurons and leptin action, the relative importance of AgRP neurons and non-AgRP neurons in mediating leptin action on body weight control remains controversial.
To more precisely elucidate Arc neuron function in obesity development, here we genetically targeted Arc neurons for conditional expression of either the bacterial sodium channel (NachBac) or the inward rectifying potassium channel Kir2.1 to achieve chronic activation or inhibition, respectively 18–20. Surprisingly, we found that chronic activation of AgRP neurons, or even random unilateral or bilateral expression in variable numbers of Arc GABA+ neurons, all caused a similar degree of hyperphagia and comparable obesity to what is observed with leptin deficiency. Strikingly, obesity via chronic activation of Arc GABA+ neurons can manifest independently of AgRP neurons and involvement of AgRP neuron function is not required for either leptin action on reducing obesity or obesity development in leptin deficiency. In addition, chronic inhibition of Arc GABA+ neurons, but not AgRP neurons, decreased normal ageing-related body weight gain and rescued obesity in leptin deficiency. These results, taken together with the observatons that obesity induced by chronic activation of Arc GABA+ neurons is refractory to leptin treatment, points to Arc GABA+ neurons as the major mediator of leptin action on body weight regulation. Thus, our findings demonstrate profound and redundant roles for Arc GABA+ neurons, including previously unappreciated non-AgRP neurons, in obesity development, and show the necessity of inhibiting the majority, if not all, Arc GABA+ neurons, to acheive obesity reversal, revealing Arc GABA+ neuron activation and inhibition as a fundamental mechanism underlying obesity development and reversal respectively.
Results
Chronin activation of Arc GABAergic leads to massive obesity
The Arc is positioned to rapidly sense nutrional indicators of feeding state and body weight, and contains mainly GABA+ neurons. Interestingly, although AgRP neurons have received intense attention in maintaining energy and body weight homeostasis, they represent a relatively small subset of cells that populate the Arc 16,21. To begin to investigate potential roles non-AgRP Arc neurons, we first examined fasting-induced c-Fos expression, an indicator of neuronal activation, in both AgRP-Cre and vesicular GABA transporter (Vgat)-Cre GFP (i.e. GABA+ neurons) reporter mice. We noted a significant number of Arc GABA+ neurons that expressed c-Fos were AgRP negative (AgRP−), as shown in serial rostral to caudal sections throughout the Arc (Figs. 1a and 1b, and Extended Data Fig. 1a). To examine the physiologic relevance of GABA+ neuron activation to body weight regulation, we aimed to activate these neurons through the the targeted expression of the bacterial sodium channel (NachBac) 18,19, which elevates neuron activity without a need of ligand administration. To selectively target Arc GABA+ neurons, we delivered adenoassociated vectors (AAV-EF1a-Flex-EGFP-P2A-mNachBac, referred to as AAV-Flex-NachBac) to the Arc of Vgat-Cre mice (Fig. 1c). To first validate functional modification of these neurons, we performed electrophysiological recordings and revealed the presence of modified action potentials (AP, Fig. 1d), reduced rheobase, AP firing threshold and input resistance, and increased number of neurons with spontaneous firing (Extended Data Fig. 1b–1j), all indicating increased neuron activity and excitability typically observed with NachBac expression 18,19. Interestingly, we routinely observed reduced resting membrane potential (REM) (Extended Data Fig. 1k), which may reflect a compensatory response to prevent over-excitation. However, we consistently observed that Arc neurons that expressed NachBac exhibited abundant c-Fos (Fig. 1e). Whereas GFP injected control mice showed a dynamic increase in fasting-induced c-Fos expression in Arc GABA+ neurons, NachBac targeted mice exhibited no further increases due to nearly all GABA+ neurons expressing c-Fos at baseline non-fasting conditions (Fig. 1f and Extended Data Fig. 2a), suggesting chronic activation of Arc GABA+ neurons by NachBac expression.
Figure 1. Chronic activation of Arc GABA+ neurons results in massive obesity.
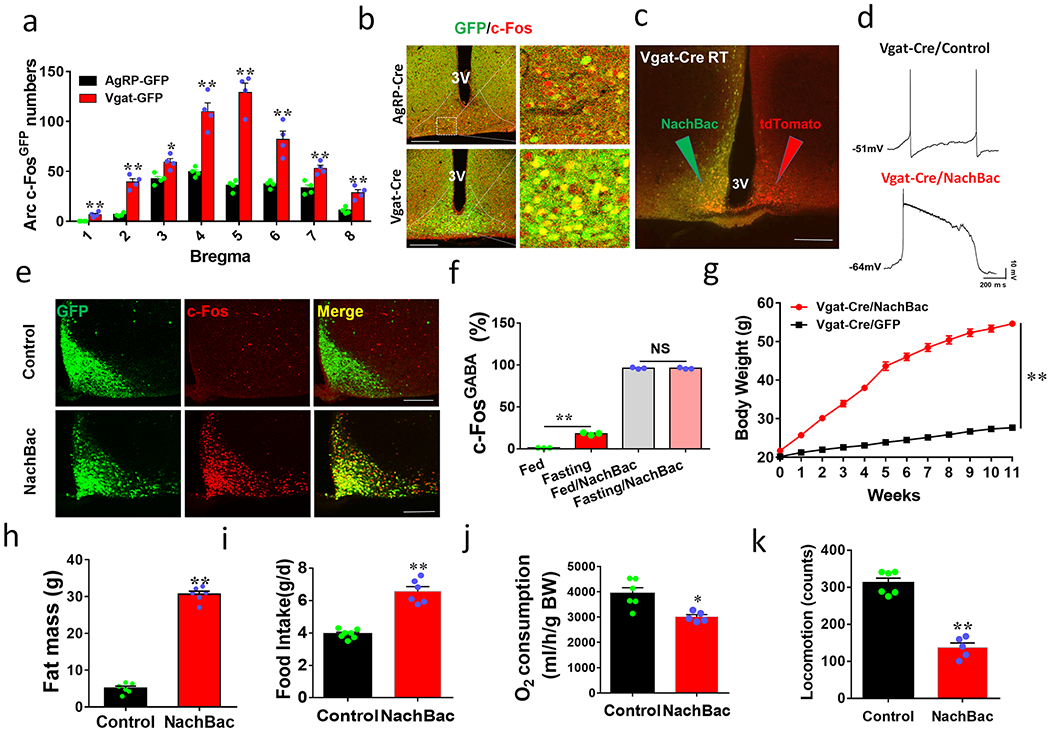
a-b, Vgat-Cre and AgRP-Cre GFP reporter mice were used to assess c-Fos induction in response to fasting. a, Quantitative comparison of c-Fos expressing in GFP reporter neurons in brain sections at the indicated bregma levels, n=4 each, 2-sided unpaired Student’s t tests (Bregma −1.22mm, t=5, df=6, **p=0.0017; −1.46mm, t=9.27, df=6, p<0.0001; −1.7mm: t=3.85, df=6, **p=0.0084; −2.06mm, t=6.6, df=6, **p=0.0006; −2.3mm: t=5.3, df=6, **p=0.0018; −2.46mm: t=4.46, df=6, **p=0.0043; −2.7mm, t=4.96, df=6, **p=0.0026). b, Representative pictures showing GFP and c-Fos colocalization at the level of bregma −1.46mm of the two genotypes. c-f, NachBac expression resulted in neuron activation. c, A representative picture showing NachBac vector expression (GFP) injected to one side of the Arc of Vgat-Cre::Ai9 reporter mice (Green arrow pointing to the injected side with both GFP and RFP expression and red arrow pointing to the non-injected side with red expression alone). d, Representative traces showing typical AP firing in neurons recorded from control noninjected side (top) and NachBac-mediated AP in neurons recorded from the injected side (bottom). e, Representative pictures showing c-Fos immunostaining (red) in the Arc of ad libitum fed mice with control GFP injections (top panels) and NachBac injections (bottom panels). f, Comparison in percentage of c-Fos expression in Arc GABA+ neurons in response to fasting in both control and NachBac mice. N=3 each/group, 2-way ANOVA with Tukey’s multiple comparisons, F(1,8)=7566, **p<0.0001 (Fed vs Fasting) and p=0.7934 (Fed/NachBac vs Fasting/NachBac). g, Comparison in body weight between mice with injections of control GFP or NachBac vectors to bilateral Arc of Vgat-Cre mice during the first 11 weeks after injection. 2-way ANOVA tests. F(1, 204)=3030, **p<0.0001 (NachBac vs GFP). h-k, Comparison in fat mass between the 2 indicated mouse groups at 11th week after viral injection (h, t=25.19, df=10, **p<0.0001), comparison in O2 consumption (i, t=8.76, df=11, **p<0.0001), food intake (j, t=3.503, df=9, **p=0.0067) and locomotion (k, t=9.64, df=9, **p<0.0001) during the first week post viral injection when body weight difference was minimal, n=6 each/group, all with 2-sided unpaired Student’s t tests. 3V: the third ventricle. Scale bar= 400 μM. All datasets presented as mean +/− sem.
Anatomically, as the Arc is surrounded by brain structures with dense glutamatergic neurons, it is possible to achieve selective expression of AAV-Flex-NachBac vectors in the Arc with targeted delivery to the Arc of Vgat-Cre mice (Extended Data Fig. 2b). Notably, chronic activation of Arc GABA+ neurons caused rapid body weight gain with an average of nearly 30 g increase within 11 weeks following NachBac viral delivery (Fig. 1g). The observed weight gain was solely due to increased fat accumulation (Fig. 1h) with no change in lean mass (Extended Data Fig. 2c), suggesting massive obesity development. Indeed, when these mice were placed in CLAMS chambers to measure food intake, O2 comsumption, and locomotion within one week after viral delivery, prior to any obvious differences in body weight (Extended Data Fig. 2d), GABA/NachBac mice exhibited hyperphagia (Fig. 1i, Extended Data Fig. 2e), reduced energy expenditure (Fig. 1j, Extended Data Fig. 2f) and locomotion (Fig. 1k, Extended Data Fig. 2g), compared to controls. Consistent with severe obesity, GABA/NachBac mice also exhibited a dramatic increase in leptin levels (Extended Data Fig. 2h). In addition, chronic activation of Arc GABA+ neurons with NachBac expression in females also caused comparable obesity to leptin deficiency (Extended Data Fig. 2i–2m). Thus, elevated activity of Arc GABA+ neurons leads to massive obesity and hyperleptinemia.
Chronin activation of Arc AgRP neurons leads to massive obesity
Given the known importance of AgRP neurons in feeding 2,3, we used the same strategy to increase AgRP neuron activity (Figs. 2a and 2b). Similarly to what we observed in Arc GABA+ neurons, targeted NachBac expression to AgRP neurons significantly increased c-Fos, with no further increase observed after fasting (Fig. 2c and Extended Data Fig. 3a). Chronic activation of AgRP neurons also led to comparable obesity to that caused by Arc GABA+ neuron activation (Fig. 2d) with a similar degree in fat mass increase (Fig. 2e) and no obvious changes in lean mass (Extended Data Fig. 3b). When these mice were placed in CLAMS chambers within 1 week after viral delivery, prior to any obvious differences in body weight (Extended Data Fig. 3c), AgRP/NachBac mice also exhibited hyperphagia (Fig. 2f, Extended Data Fig. 3d) and reduced locomotion (Fig. 2g, Extended Data Fig. 3e), but no change in energy expenditure (Fig. 2h, Extended Data Fig. 3f). Thus, activation of AgRP neuorns causes obesity similarly to that of Arc GABA+ neurons. Interestingly, we noticed that mice with GABA+ neuron NachBac expression exclusively in one side of the Arc exhibited a comparable level of obesity to those with expression in both sides (Figs. 2i–2k). Further analysis of mice with various viral injection patterns in Arc GABA+ neurons showed that, despite drastic difference in the number of Arc GABA+ neurons with NachBac expression, all exhibited comparable obesity (Fig. 2l). Thus, activation of AgRP neurons or random distributed GABA+ neurons located either unilaterally or bilaterally within the Arc is sufficient to drive massive obesity development.
Figure 2. Chronic activation of AgRP neurons or random Arc GABA neurons results in massive obesity.
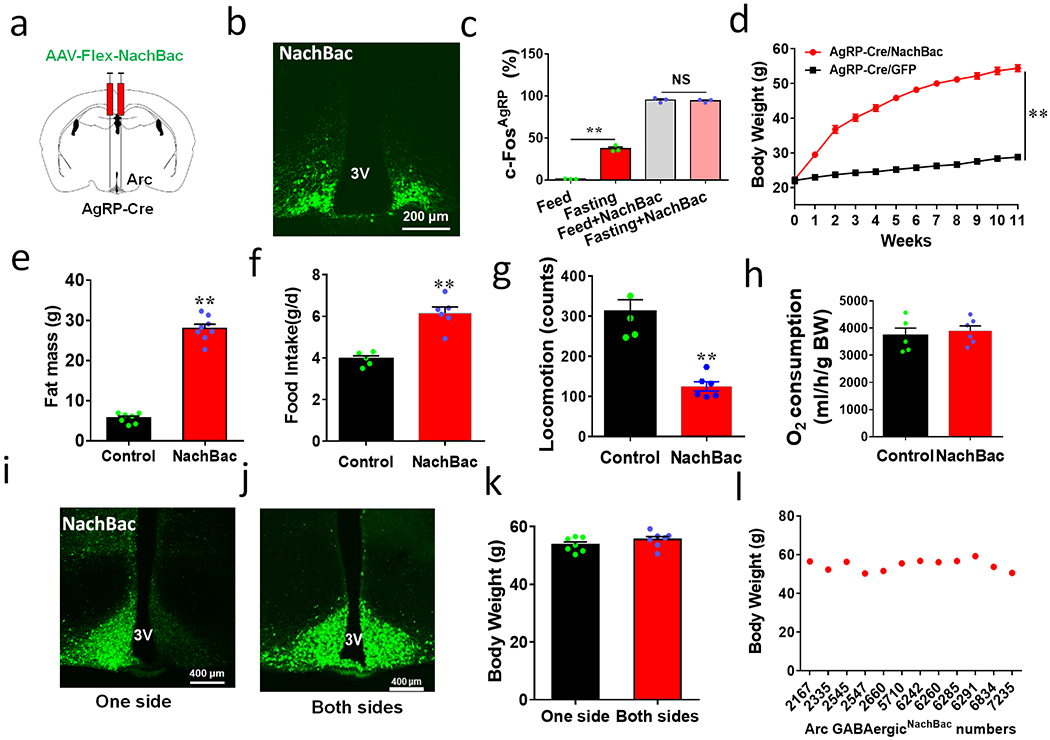
a, Diagram showing NachBac viral injections to bilateral Arc of AgRP-Cre mice. b, Representative expression pattern of AAV-Flex-NachBac in the Arc of AgRP-Cre mice. c, Comparison in percentage of c-Fos expression in Arc AgRP neurons in response to fasting in both control and NachBac mice; n=3 each, 2-way ANOVA withTurkey’s multiple comparisons, F(3,8)=770.2, **p<0.0001 (Fed vs Fasting) and p=0.6422 (Fed/NachBac vs Fasting/NachBac). d, Comparison in body weight between mice with injections of control GFP or NachBac vectors to bilateral Arc of AgRP-Cre mice during the first 11 weeks after injection. 2-way ANOVA tests. F(1, 204)=3301, **p<0.0001 (NachBac vs GFP). e-h, Comparison in fat mass between the 2 mouse groups at 11th week after viral injection (e, t=18, df=13, **p<0.0001), comparison in food intake (f, t=6.10, df=9, **p=0.0002), locomotion (g, t=6.14, df=9, **p<0.0001) and O2 consumption (h, t=0.518, df=9, **p=0.6169) during the first week post viral injection when body weight difference was minimal, n=6 each/group, all with 2-sided unpaired Students’ t tests. i-k, Representative pictures showing NachBac viral injections to one side (i), both sides (j) of Arc in Vgat-Cre mice, and comparison in body weight at the 11th week after NachBac viral injection (k, t=1.266, df=12, p=0.2296, n=7 (one side) or =8 (both sides), with 2-sided unpaired Student’s t test). l, Plot of body weight of individual animals at the 11th week after viral injection as a function of number of Arc GABA+ neurons with NachBac viral expression. 3V: the third ventricle. All data presented at mean +/− sem.
AgRP neurons are not required for obesity develoment
To examine whether Arc GABA+ neuron activation-induced obesity solely resulted from increased activity of AgRP neurons, we expressed NachBac in the Arc of Vgat-Cre::AgRPDTR/+ mice, in which AgRP neurons were lesioned in neonates using the previously established diphtheria toxin (DTX) administration approaches 22 (Fig. 3a). In addition to validation of AgRP neuron lesion (Extended Data Fig. 4a), to exclude the possibility that toxin induced pressure of killing AgRP neruons causes a selective suppression of AgRP expression, we used NPY-GFP mice and confirmed that DTX also eliminated NPY-GFP neurons (Extended Data Fig. 4b), confirming loss of AgRP neurons. Chronic activation of Arc AgRP− GABA+ neurons also led to massive obesity (Fig. 3b), with dramatic increase in fat mass (Fig. 3c) but no change in lean mass (Fig. 3d). When measured during the first week after viral delivery with no obvious differences in body weight, these mice exhibited increased hyperphagic feeding (Figs. 3e and 3f),and reduced energy expenditure (Fig. 3g and 3h) and locomotion (Extended Data Fig. 4c–4d). To rule out contributions from potential residual AgRP neurons as a result of unsuccessful ablation, we performed another injection of DTX at 12 weeks following viral delivery and found no changes in the obesity phenotype (Fig. 3i), confirming that AgRP neurons are not required for the obesity development. Together, these results reveal an previously unappreciated importance for AgRP− Arc GABA+ neurons in body weight regulation.
Figure 3. AgRP neurons are not required for obesity development by activation of Arc GABA+ neurons.
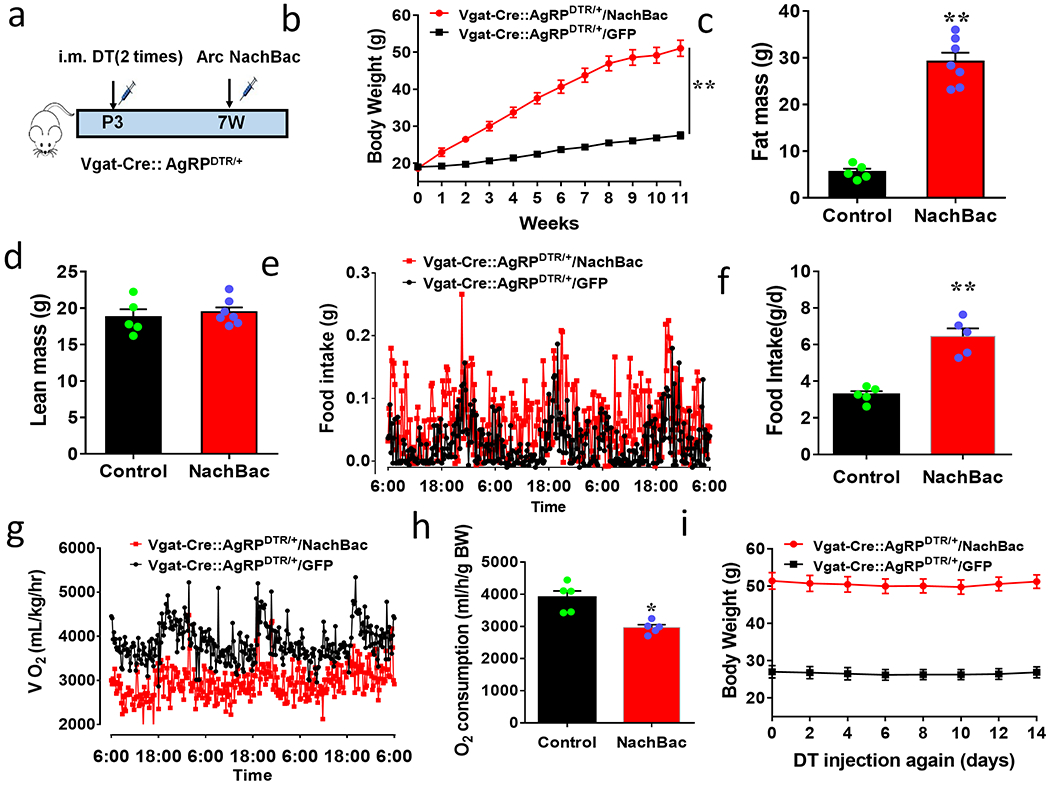
a, Diagram showing injections of NachBac vectors to bilateral Arc of Vgat-Cre:: AgRPDTR/+ mice with DTX (DT) treatment in neonates. b-h, Metabolic phenotypes of Vgat-Cre:: AgRPDTR/+ mice with AgRP lesion in neonates and NachBac injections to the Arc. Weekly body weight after viral injection (b, F(1, 156)=3301, **p<0.0001, NachBac vs GFP), fat (c, t=10.07, df=10, p<0.0001) and lean (d, t=0.5603, df=10, p=0.5876) mass at the 11th week after viral injection. (e-h) food intake pattern (e), comparsion in daily food intake (f, t=6.533, df=8, **p=0.0002), and comparison in O2 consumption pattern (g) and O2 consumption (h, t=4.289, df=8, p=0.0027) measured in CLAMS during the first week after viral injection with minimla body weight difference between groups, n=5 (control) or 7 (NachBac), with 2-sided unpaired student’s t tests in c, d, f and h, or 2-way ANOVA in b. i, Daily body weight of AgRPDTR/+ controls and obese Vgat-Cre:: AgRPDTR/+ mice presented in panels b-h after receiving another dose of DT treatment at the 11th week following NachBac or GFP viral delivery. All datasets presented as mean+/− sem.
AgRP neurons are not required for leptin action on body weight regulation
The Arc is known to mediate leptin action on body weight. While CRISPR/Cas9-mediated deletion of leptin receptor (LepR) in AgRP neurons causes comparable obesity to leptin deficiency 17, previous experiments with targeted deletion or restoration of LepR in AgRP neurons all reveal minor roles for AgRP neurons towards mediating leptin action on body weight 13–15. In fact, selective LepR deletion in GABA+ neurons causes comparable obesity to leptin deficiency, similar manipulations in AgRP neurons only had minor effects 13,16. Collectively, these data question the relative contributions of AgRP+ and AgRP− neurons within the Arc towards mediating leptin action on body weight control. To more directly examine the role of non-AgRP neurons in obesity development of leptin deficient ob/ob mice, we next generated AgRPDTR/+::ob/ob mice with neonatal lesion of AgRP neurons (Fig. 4a). These mice developed morbid obesity that was comparable to ob/ob mice (Fig. 4b). In these mice we i.c.v infused leptin and confirmed successful delivery and action via abundant p-STAT3 induction in the hypothalamus (Extended Data Fig. 4e), which is an established indicator of LepR-mediated signaling. Leptin potently lowered body weight (Fig. 4c), reduced feeding (Fig. 4d), and decreased fat mass (Fig. 4e), with no change in lean mass (Fig. 4f). Thus, AgRP neurons are dispensable for both obesity development in ob/ob mice or leptin action on reducing obesity, suggesting an importance of AgRP− neurons in mediating leptin action on body weight regulation.
Figure 4. AgRP neurons are not required ob/ob obesity or leptin action on reducing body weight.
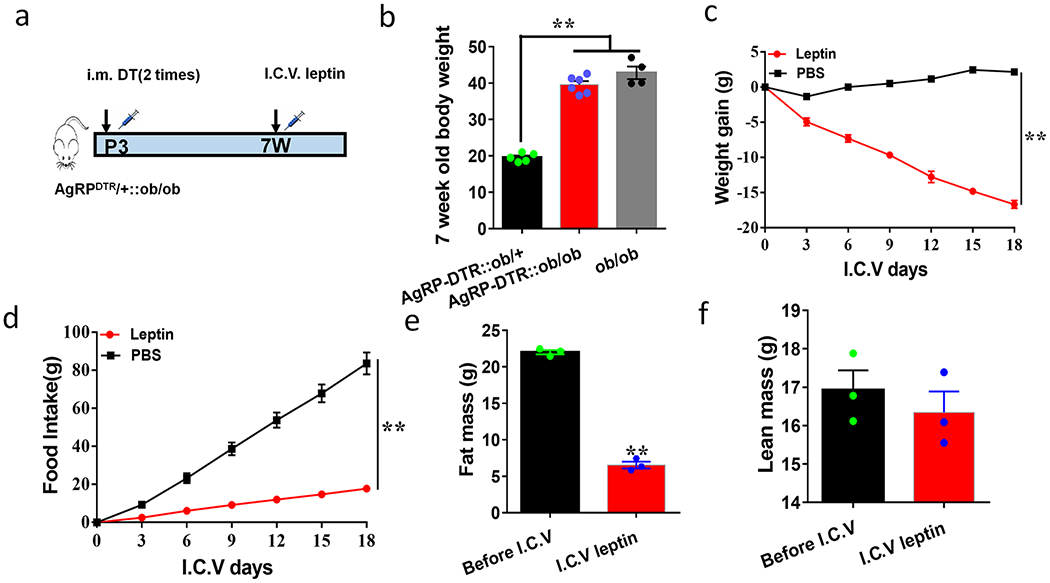
a-f, Leptin treatment on body weight in ob/ob mice with neonatal AgRP neuron lesion. a, Diagram showing DTX (DT) and leptin treatments in AgRPDTR/+::ob/ob mice. b, Comparison in body weight of the indicated genotypes at the age of 7 weeks, 1-way ANOVA, F(2, 12)=131.9, **p<0.0001 (AgRP-DTR::ob/+vsAgRP-DTR::ob/ob); **p<0.0001 (AgRP-DTR::ob/+vs ob/ob); p=0.1112 (AgRP-DTR::ob/ob vs ob/ob), n=5 (AgRP-DTR::ob/+), 6 (AgRP-DTR::ob/ob); or 4 (ob/ob). c-d, Changes in daily body weight (c) and food intake (d) in AgRPDTR/+::ob/ob mice receiving either icv leptin (n=3) or control PBS (n=3), 2-way ANOVA tests: for body weight F(1, 21)=1510, **p<0.0001 (Leptin vs PBS); and for food intake F(1, 21)=880.3, **p<0.0001 (leptin vs PBS). e-f, Changes in fat mass (e, t=27.66 df=4, **p<0.0001, n=3 each) and lean mass (f, t=0.7783, df=4, p=0.4798, n=3 each) of AgRPDTR/+::ob/ob mice at the end of the 18th day of icv infusion, all with 2-sided unpaired Student’s t tests. All datasets presented as mean+/− sem.
Activation of Arc GABAergic neurons overrides leptin action on body weight regulation
Given the concentrated LepR expression in the Arc and comparable obesity to leptin deficiency by chronic activation of Arc GABA+ neurons, we next examined whether obesity in NachBac mice can be reversed by leptin (Fig. 5a). Leptin i.c.v. infusion had no effects on NachBac-induced obesity (Fig. 5b), food intake (Fig. 5c), fat mass (Fig. 5d), or lean mass (Fig. 5e). However, as anticipated, leptin administratin dramatically reduced body weight, feeding, and fat mass in ob/ob mice (Fig. 5b–5d). To further examine whether the resistance to leptin is mediated by blunted intracellular leptin signaling, we examined leptin-induced p-STAT3 expression. As expected, leptin induced robust p-STAT3 in the Arc of ob/ob mice (Figs. 5f and 5g), whereas we saw no difference in leptin-induced p-STAT3 expression between control and NachBac mice (Figs. 5f and 5g). To further correlate leptin signal with neuron activation, we performed i.p. leptin treatment in mice with NachBac expression in Arc GABA+ neurons. Compared to controls, leptin dramatically increased the number of p-STAT3 positive neurons in the Arc of NachBac mice (Fig. 5h, Extended Data Figs, 5a–5b). In contrast, we detected no difference in c-Fos positive neurons between the groups with the majority of Arc GABA+ neurons expressing c-Fos in both groups (Fig. 5i, Extended Data Fig. 5c–5d). To rule out the possibility that the observed leptin resistance is caused by obesity in NachBac mice, we expressed NachBac in Arc GABA+ neurons in ob/ob mice (Extended Data Fig. 5e), which are known to exhibit increased leptin sensitivity 23, and found that leptin was still incapabale of reducing obesity (Extended Data Fig. 5f–5k). We then directly examined leptin effects on electrical properties in Arc neurons, and found that leptin effects on reducing firing rates was blunted in neurons with NachBac expression, compared to controls (Fig. 5j, Extended Data Figs. 5l–5m). These data suggest that NachBac expression causes a strong effect on neuron excitation that overrides the inhibitory action of leptin. Thus, GABA+ neuron NachBac targeted mice represent a unique obesity model with concurrent hyperleptinemia and normal intracellular leptin signaling.
Figure 5. Arc GABA+ neuron activation driven by NachBac overrides leptin action.
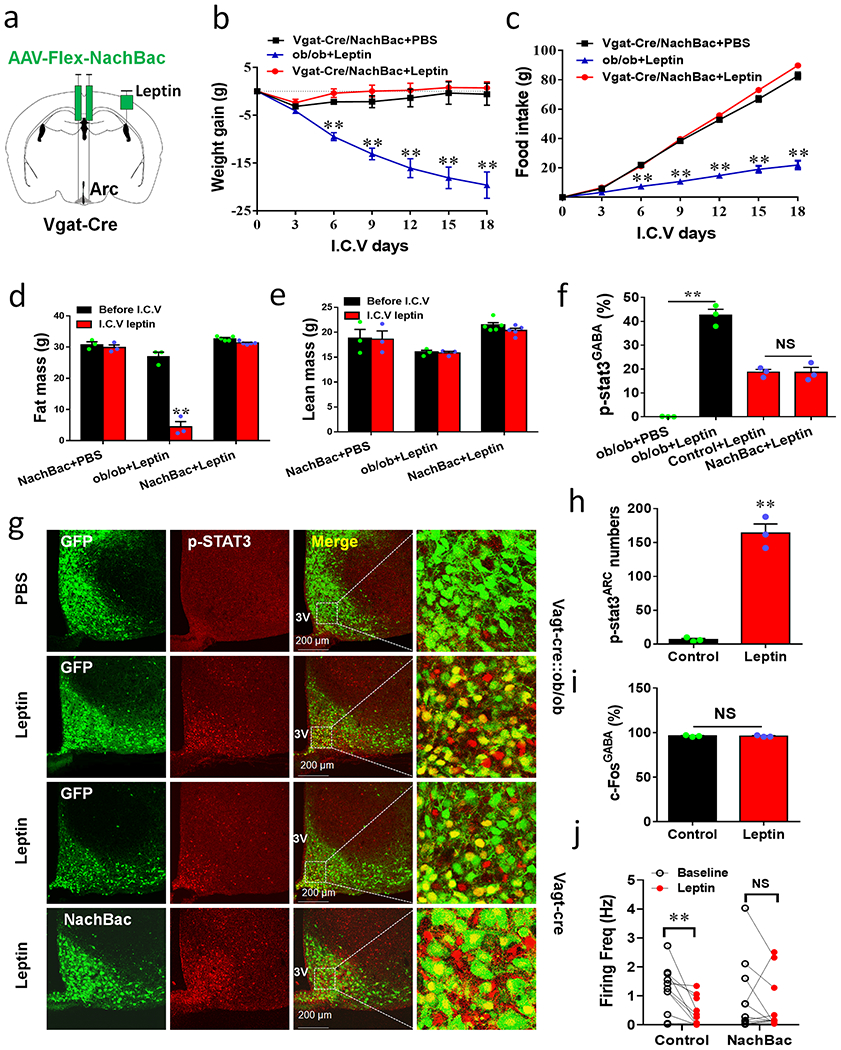
a, Diagram showing i.c.v. treatment of leptin or saline with 3-week duration minipumps in Vgat-Cre or Vgat-Cre::ob/ob mice that were injected with NachBac vectors to bilateral Arc. b-e, Body weight (b) and food intake (c) were measured once every 3 days with leptin or saline treatment in the indicated groups of mice and body composition was examined at the 18th day on leptin treatment for fat (d) and lean (e) mass, n=3 (NachBac+PBS), 3 (ob/ob+leptin) or 5 (NachBac+leptin), 2-way ANOVA in b (F(6, 35)=10.86, **p<0.0001, NachBac+PBS vs ob/ob+leptin; F(6, 42)=0.1529, p<0.9874, NachBac+PBS vs ob/ob+leptin; F(6, 49)=17.57, **p<0.0001, ob/ob+leptin vs NachBac+leptin) and in c (F(6, 35)=112.1, **p<0.0001, NachBac+PBS vs ob/ob+leptin; F(6,42)=6.368, p=0.081, NachBac+PBS vs ob/ob+leptin; F(6, 69)=290.2, **p<0.0001, ob/ob+leptin vs NachBac + leptin); and 2-sided unpaired Student’s t tests in d (t=10.40, df=4 **p=0.0005 in the ob/ob+leptin group (before vs after leptin)) and e (t=1.491, df=8, p=0.1778 in the group of NachBac+leptin (before vs after leptin)). f, Comparison in percentage of p-STAT3 expression in Arc GABA+ neurons in control and NachBac mice with saline or leptin infusion, n=3 each/group, 1-way ANOVA (F(3,8)=99.83, **p<0.0001, ob/ob+PBS vs ob/ob+leptin; p=0.9732, Control+leptin vs NachBac+leptin). g, Representative pictures for data presented in panel f showing GFP and p-STAT3 in Vgat-Cre::ob/ob mice with saline or leptin infusion (top 2 rows), and showing NachBac and p-STAT3 in NachBac injected Vgat-Cre mice with leptin infusion (bottom 2 rows). h-I, In a new cohort of Vgat-Cre male mice with NachBac viral delivery to the Arc, i.p. leptin (or saline) was administered, and the expression of p-STAT3 (h, t=11.71, df=4, **p=0.0003) and c-Fos (i, t=0.2800, df=4, p=0.754) was examined in the Arc and compared between leptin and contral saline treatments, n=3 each/group,with 2-sided unpaired Student’s t tests. j, Comparison in leptin effects on firing frequency of control and NachBac-expressing AgRP neurons using patch clamp recording on brain slices, n=11 (control) or 12 (NachBac), with 2-sided paired Student’s t tests, t=3.630, df=10, **p=0.0046 in controls, and t=0.8136, df=10, p=0.4348 in the NachBac group. 3V: the third ventricle. All data presented as mean +/− sem.
Chronic inhibition of Arc GABAergic, but not AgRP neurons, reduces body weight
We next examined whether baseline activity levels of Arc GABA+ neurons are required for body weight regulation. Toward this, we expressed a mutated Kir2.1 channel by delivery of AAV-EF1a-DIO-Kir2.1-P2A-dTomato vectors (AAV-DIO-Kir2.1) in the Arc of Vgat-Cre mice (Fig. 6a), which effectively reduces neuron activity 19. Whole cell recordings from brain slice verified that neurons with Kir2.1 expression exhibited lower AP firing rates and REM (Fig. 6b, Extended Data Figs. 6a and 6b), lower input resistance (Extended Data Fig. 6c, and elevated rheobase and AP firing threshold (Extended Data Figs. 6d–6g), consistent with reduced neuron activity. In response to fasting, Kir2.1 mice showed much less c-Fos positive neuron number in the Arc compared to controls (Extended Data Figs. 7a and 7b), especially in GABA+ neurons (Fig. 6c). Together these data indicate reduced levels of Arc GABA+ neuron activity in vivo. Interestingly, while controls showed a gradual increase in body weight, Kir2.1 mice largely limited body weight gain during ageing (Fig. 6d), which was associated with reduced fat mass (Fig. 6e) and slight reductions in lean mass (Fig. 6f). We further confirmed that the observed body weight reduction was caused by a combination of reduced feeding (Fig. 6g, Extended Data Fig. 7c), elevated energy expenditure (Fig. 6h, Extended Data Fig. 7d) and increased locomotion (Fig. 6i, Extended Data Fig. 7e). To examine the potential contribution of AgRP neurons to reduced body weight, we performed a similar manipulation in AgRP neurons using AgRP-Cre mice (Fig. 6j). AgRP/Kir2.1 mice exhibited significantly less c-Fos expression in response to fasting in Arc AgRP neurons compared to controls (Fig. 6k, Extended Data Figs. 7f and 7g). Surprisingly, inhibition of AgRP neurons led to no changes in body weight (Fig. 6l), food intake (Extended Data Fig. 7h) or body composition (Extended Data Figs. 7i and 7j). Given the well-documented implication of AgRP neurons in feeding, we also used an independent, tetanus toxin light chain (TeLC) mediated ablation of neurotransmission to confirm the role of AgRP neurons. We delivered AAV-DIO-TeLC-GFP viral vectors to the Arc of AgRP neurons. The vector expression was confirmed in almost all AgRP neurons (Extended Data Fig. 8a), and these mice showed no difference in body weight, compared to control mice with AAV-DIO-GFP vector injections (Extended Data Fig. 8b). Thus, normal baseline activity levels of Arc GABA+ neurons, but not AgRP neurons, are required for ageing related body weight gain.
Figure 6. Arc GABA+ but not AgRP neurons are necessary for ageing-related body weight gain.
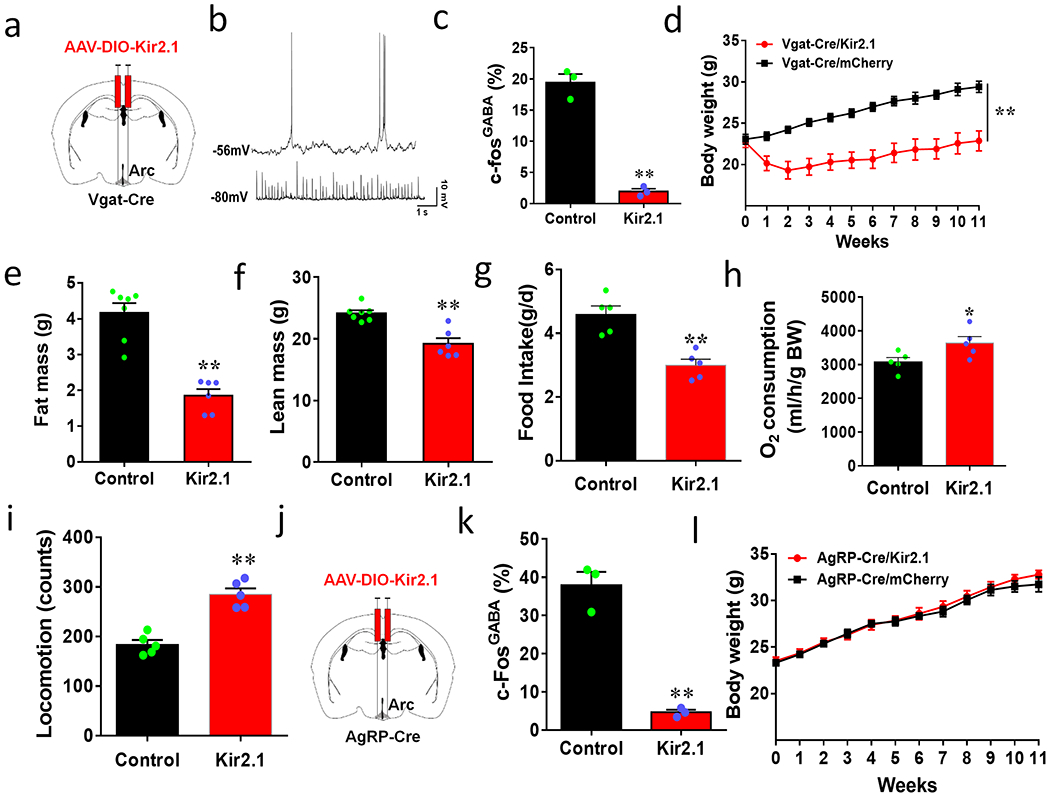
a, Diagram showing injections of Kir2.1 vectors to bilateral Arc of 7-8 week old Vgat-Cre mice. b, Representative traces showing spontaneous activity of control (top) and Kir2.1-expressing Arc GABA+ neurons (bottom). c, Comparison in percentage of Arc GABA+ neurons that express c-Fos in response to overnight fasting between control and Kir2.1 mice, n=3/group with 2-sided unpaired Student’s t tests, t=12.17, df=4, **p=0.0003. d-i, Weekly body weight (d, two-way ANOVA tests, F(1, 120)=226.8, **p<0.0001 Kir2.1 vs mCherry, body composition in fat (e, t=6.816, df=11, **p<0.0001) and lean mass (f, t=5.015, df=11, **p=0.0004) measured at the 11th week after viral injection; food intake (g, t=4.923, df=8, **p=0.0012), O2 consumption (h, t=2.428, df=8, *p=0.0413) and locomotion (i, t=6.649, df=8, **p=0.0002) measured during the first week after viral injection when the body weight difference between groups was minimal, n=5/groups, all with 2-sided unpaired Student’s t tests in e-i. j-l, Body weight effects of Kir2.1 expression in AgRP neurons. (j) Diagram showing injections of Kir2.1 vectors to bilateral Arc of 7-8 week old AgRP-Cre mice. k, Comparison in percentage of AgRP neurons expressing c-Fos in response to fasting, n=3/group, 2-sided unpaired Student’s t tests (t=9.289, df=4, **p=0.0007). l, Comparison in weekly body weight between groups after viral injection, 2-way ANOVA, F(1, 120)=1.926, p=0.1645 Kir2.1 vs mCherry. All data presented at mean +/− sem.
Chronic inhibition of Arc GABAergic, but not AgRP neurons, normalizes ob/ob obesity
To examine whether chronic inhibition of Arc GABA+ neurons can reverse obesity, we expressed Kir2.1 in the Arc of Vgat-Cre::ob/ob mice (Fig. 7a). Expression of Kir2.1 led to a dramatic reduction of fasting-induced c-Fos in GABA+ neurons in the Arc (Fig. 7b, Extended Data Figs. 9a and 9b), confirming chronic inhibition of these neurons in ob/ob mice. Strikingly, Kir2.1 mediated chronic inhibition of GABA+ neurons led to nearly a complete reversal of obesity development in ob/ob mice (Fig. 7c), accompanied by a a dramatic reduction in fat mass (Fig. 7d) and a slight reduction in lean mass (Fig. 7e). The observed obesity reversal was due to a combination of reduced feeding (Fig. 7f, Extended Data Fig. 9c), elevated O2 consumption (Fig. 7g, Extended Data Fig. 9d), and increased locomotor activity (Fig. 7h, Extended Data Fig. 9e). Similarly, we also bilaterally delivered Kir2.1 to the Arc of AgRP-Cre::ob/ob mice to evaluate potential effects on the ob/ob obesity (Fig. 7i). As expected, Kir2.1 expression in AgRP neurons significantly reduced fasting-induced c-Fos throughout the Arc (Extended Data Figs. 9f and 9g), and largely eliminated c-Fos expression in AgRP neurons (Fig. 7j), indicating chronic inhibition of AgRP neurons by Kir2.1 in ob/ob mice. Chronic inhibition of AgRP neurons had no effects on obesity development of ob/ob mice (Fig. 7k), food intake (Fig. 7l), or body composition (Extended Data Fig. 9h–9i). To rule out the possibility that Arc AgRP neurons were partially inhibited due to insufficient viral delivery, we examined colocalization of Kir2.1 vector expression in AgRP-Cre reporter mice, and found that the vast majority, if not all, of AgRP neurons expressed Kir2.1 viral vectors (Extended Data Fig. 10a). Similarly, we also confirmed selective expression of Kir2.1 in all Arc sections harboring GABA+ neurons (Extended Data Fig. 10b). Finally, we delivered Kir2.1 viral vectors to one side of the Arc and found that it failed to reduce ageing–related body weight gain or the ob/ob obesity (Extended Data Figs. 10c–10f). Thus, chronic inhibition of most, if not all, Arc GABA+ neurons is required to reduce feeding and body weight under both ad libitum chow-fed or obese conditions.
Figure 7. Chronic inhibition of Arc GABA+ but not AgRP neurons are sufficient to normalize ob/ob obesity.
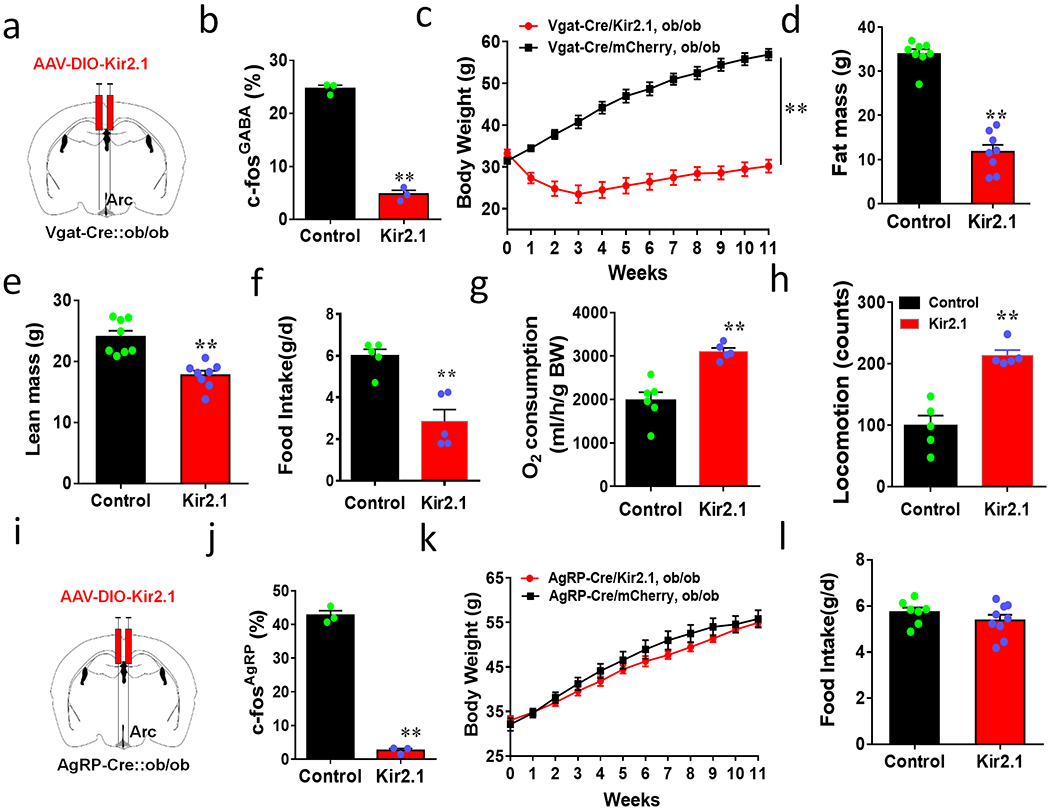
a-i, Effects on body weight by Kir2.1 expression in Arc GABA+ neurons in obese ob/ob mice. a, Diagram showing injections of Kir2.1 vectors to bilateral Arc of 7-8 week old Vgat-Cre::ob/ob mice. b, Comparison in percentage of Arc GABA+ neurons expressing c-Fos in response to overnight fasting between control and Kir2.1 mice, n=3/group, 2-sided unparired Student’s t tests (t=20.97, df=4, **p<0.0001). c-h, Weekly body weight (c, n=8/group, F(11, 168)=16.28, **p<0.0001, Kir2.1 vs mCherry), body composition for fat (d, n=8/group, t=11.65, df=14, p<0.0001) and lean mass (e, n=8/group, t=5.090, df=14, **p=0.0002) measured at the 11th week after viral injection; comparison in food intake (f, n=5/group, t=4.785, df=8, **p=0.0014), O2 consumption (g, n=5/group,t=4.999, df=9, **p=0.0007) and locomotion (h, n=5/group,t-5.949, df=8, **p=0.0003) measured during the first week after viral injection when the body weight difference between groups was minimal, 2-way ANOVA tests in c and 2-sided unpaired Student’s t tests in d-h. i-l, Body weight effects of Kir2.1 expression in AgRP neurons in obese ob/ob mice. i, Diagram showing injections of Kir2.1 vectors to bilateral Arc of 7-8 week old AgRP-Cre::ob/ob mice. j, Comparison in percentage of AgRP neurons expressing c-Fos in response to fasting, n=3/group, 2-sided unpaired Student’s t tests (t=26.02, df=4, **p<0.0001). k-l, Comparison in weekly body weight (k, n=7 for Kir2.1 and =9 for mCherry, F(11, 168)=0.4810, p=0.9131, Kir2.1 vs mCherry, 2-way ANOVA) and food intake (l, n=7 for Kir2.1 and =9 for mCherry, t=1.109, df=14, p=0.2862, 2-sided unpaired Student’s t tests) between groups after viral injection. All data presented as mean +/− sem.
Discussion
Here we combined Vgat-Cre mice and targeted delivery of AAV vectors to achieve chronic changes of Arc GABA+ neuron activity. Our targeting to the Arc is highly specific, which is in part benefited from void of Vgat expression in the brain structures surrounding the Arc, preventing Cre-mediated expression from potential viral particle spillover beyond the Arc, as evidenced from our data on viral expression pattern. In some cases, we observed a small number of dorsal medial hypothalamic (DMH) neurons with viral expression, which, however, caused no difference in the observed body weight phenotype. Thus, although a role of DMH neurons in body weight regulation cannot be completely ruled out, the observed body weight changes in this study are mainly contributed by Arc GABA+ neurons.
Our results reveal a profound effect of aberrant activation of Arc GABA+ neurons in driving rapid and massive obesity. As obesity with deficient leptin function is associated with increased Arc neuron activation 24, aberrant activation of these neurons may represent one major brain dysfunction that leads to hyperphagia and obesity. Despite normal leptin signaling, obesity through chronic activation of Arc GABA+ neurons is refractory to leptin treatment, representing a unique obesity model with hyperleptinemia and intact leptin signaling. These findings echo emerging data that suggest defective leptin signaling is not required for obesity development 25. On the other hand, inhibition of Arc GABA+ neurons, a leptin-mimicking effect, reduces ageing-associated body weight gain. Complete rescues of ob/ob obesity via inhibition of Arc GABA+, but not AgRP, neurons and failure of leptin in reducing obesity in mice with activation of Arc GABA+ neurons collectively suggest that leptin action on body weight is largely mediated by GABA+ neurons within the Arc. Thus, the major function of leptin in body weight regulation appears to modulate the activity of Arc GABA+ neurons as opposed to the previous view that leptin signals primarily through AgRP neurons. Supporting this, leptin action on Arc GABA+ neurons is inhibitory, and deletion of LepR from GABA+ neurons leads to a comparable level of obesity as observed with leptin deficiency 16. These findings are also in line with the observed mild effects on body weight mediated by LepR or LepR-expressing neurons in other non-Arc brain sites 26–29. Of note, our experiments were conducted in non-disturbed normal chow diet conditions, and it is conceivable that LepR neurons in non-Arc sites may in fact be involved in stressful metabolic conditions, such as fasting and/or high fat diet feeding.
Notably, here we demonstrate that Arc GABA+ neurons promote feeding and obesity in a functionally redundant manner, and abberant activation of only a small number of these neurons is equally effective in driving a similar degree of obesity development. One striking finding is that AgRP neurons are not required for either obesity development or body weight-reducing effects of leptin, revealing a previously unappreciated importance for Arc AgRP− GABA+ neurons in body weight regulation. In contrast to intense research on AgRP neurons, the function and underlying anatomy of AgRP− GABA+ neurons remain poorly explored. Nevertheless Arc neurons expressing tyrosine hydroxylase (TH) and nitric oxide synthetase 1 (Nos1) may represent AgRP− neurons in promoting feeding and obesity 11,30. It is worthy to note that activation of AgRP neurons caused only hyperphagia, whereas activating Arc GABA+ or AgRP− GABA+ neurons caused both hyperphagia and reduced energy expenditure, suggesting a distinct role for AgRP− GABA+ neurons in energy expenditure, in addition to feeding. Supporing this, previous studies on non-AgRP Arc neurons reveals a role in energy expenditure 31. Consistent with these redundant roles, inhibition of AgRP neurons alone was not sufficient, but rather inhibition of the whole population of GABA+ neurons within the Arc, is required to reduce normal ageing-associated body weight gain or ob/ob obesity, revealing a role for Arc AgRP− GABA+ neurons in maintaining normal feeding or hyperphagia/obesity in ob/ob mice. Given the known efficient communication between Arc neurons and blood circulation for nutritional states, the redundant function of Arc GABA+ neurons in promoting feeding and body weight provides an evolutionary advantage for survival.
Our results showing that inhibition of AgRP neurons with no obvious effects on body weight is in contrast to the impact of adult AgRP neuron lesion, which leads to starvation and decreased survival 22. The underlying reason for this remains unknown, but may involve residual activity of AgRP neurons with Kir2.1 inhibition as shown by residual AP firing in our recording experiments, which is in contrast to complete loss of AgRP neurons by lesion. Such residual activity may more closely mimic natural physiologic inhibition of AgRP neurons, thus better reflecting AgRP neuron function in normal physiology. Since AgRP lesion-induced starvation can be alleviated and/or rescued non-specifically by increased fat reserve in ob/ob mice 32, the starvation phenotype may also actually manifest as a secondary effect from acute perturbation of feeding by toxin,. In addition, DTX-mediated AgRP neuron lesion in AgRPDTR/+ mice caused a notable glial activation within the Arc 33. In contrast, little glial activation was identified with Kir2.1-mediated inhibition of AgRP neurons (Extended Data Fig. 10g). Although it remains to be examined, it is conceivable that local immune responses potentially contribute to feeding as demonstrated previously 34. Consistent with a sufficient, but not a required role for AgRP neurons in body weight regulation, while peptide and GABA release from AgRP neurons promote potent feeding 2,35, deficiency of each of these factors alone or in combination produces no obvious phenotypes on body weight on chow diet 36,37. Despite the demonstrated role for loss of GABA in AgRP lesion-induced starvation 38, adult ablation of GABA release from AgRP neurons causes no obvious phenotypes in body weight 39. In line with this, chronic DREADD-mediated inhibition of AgRP neurons fails to reduce body weight, and re-expression of LepR in AgRP neurons also fails to rescue the db/db obesity 14,40.
In sum, our new approaches with chronic manipulation of brain neuron activity demonstrate Arc GABA+ neuron activation and inhibition as one major mechanism in promoting and inhibiting obesity development respectively. Our results identify a profound and redundant role for Arc GABA+ neurons in promoting feeding and obesity. Reversal of aberrant activity of most, if not all, Arc neurons is required for obesity reversal in obese states. Our findings suggest that redundant functionality of Arc GABA+ neurons may underlie the brain mechanism for easy susceptibility to obesity, but difficulty in weight loss. Thus, strategies to achieve efficient inhibition of Arc GABA+ neurons should represent effective therapeutic approaches against obesity with or without leptin resistance.
EXPERIMENTAL PROCEDURES
Animal care.
Mice were housed at 21°C–22°C with a 12 h light/12 h dark cycle with standard pellet chow and water provided ad libitum unless otherwise noted for fasting experiments. Animal care and procedures were approved by the University of Texas Health Science Center at Houston Institutional Animal Care and Use Committee. Vgat-Cre, ob/+, AgRP-Cre and NPY-GFP mice were purchased from the Jax lab and described previously 22. AgRPDTR/+ mice were provided by Dr. Qi Wu of Baylor College of Medicine and as previously described 22. Additionally, in most breeding pairs, either male or female breeders (ROSA)26Sortm9(CAG-tdTomato) (also called Ai9) 41 or (ROSA)26Sortm1.1(CAG-cas9*,-EGFP)42 were bred into the Cre lines to allow RFP and GFP expression respectively in the presence of cre recombination. All mice that were used for stereotaxic injections were at least 8-10 weeks old. AgRP lesion was performed by 2 doses (50 μg/kg) of i.p. injections of DTX (Sigma, St. Louis, MO) around days 3 and 5 respectively, similarly to the previously described for neonatal deletion 22.
Surgeries and viral constructs
Stereotaxic surgeries to deliver viral constructs and for optical fiber implantation were performed as previously described 43. Briefly, mice were anesthetized with a ketamine/xylazine cocktail (100 mg/kg and 10 mg/kg, respectively), and their heads affixed to a stereotaxic apparatus. Viral vectors were delivered through a 0.5 μL syringe (Neuros Model 7000.5 KH, point style 3; Hamilton, Reno, NV, USA) mounted on a motorized stereotaxic injector (Quintessential Stereotaxic Injector; Stoelting, Wood Dale, IL, USA) at a rate of 30 nL/min. Viral preparations were made through the Baylor NeuroConnectivity Core with either serotype 5 or DJ and titered at more than ~1012 particles/mL. Viral delivery was targeted to the Arc through 4 local injections with 2 each side (200 nL/side; anteroposterior (AP): −1.35 and −1.5 mm; mediolateral (ML): ± 0.2 mm; dorsoventral (DV): −5.9 mm). AAV-EF1a-Flex-EGFP-P2A-mNachBac or AAV-EF1a-DIO-Kir2.1-P2A-dTomato were delivered bilaterally into the Arc. Two mutations (E224G and Y242F) were made in the Kir2.1 construct so that the channel will be more effective in reducing neuron activity. AAV-DIO-TeLC-GFP, AAV-Flex-GFP and AAV-Flex-mCherry vectors were provided by Dr. Ben Arenkiel from Baylor College of Medicine.
Brain slice electrophysiological recordings.
Mice were given an overdose of Avertin then perfused intracardially with ice-cold cutting solution containing (in mM): 212 sucrose, 3 KCl, 1.25 NaH2PO4, 26 NaHCO3, 7 MgCl2, 10 glucose Whole brain was excised quickly and immediately immersed into ice-cold cutting solution. Coronal brain slices (280 μm) containing arcuate nucleus were prepared from mice that had received stereotaxic injections of AAV-EF1a-Flex-EGFP-P2A-mNachBac, AAV-EF1a-DIO-Kir2.1-P2A-dTomato or AAV-Flex-GFP to Arc about 1 week prior to the recording were cut in oxygenized, ice-cold cutting solution. Slices were incubated for 30 min in artificial cerebrospinal fluid (aCSF) containing (in mM): 1123 NaCl, 26 NaHCO3, 2.5 KCl, 1.25 NaH2PO4, 10 glucose, 1.3 MgCl2, 2.5 CaCl2 bubbling with 95% O2/5% CO2, at 32-34°C, for recovery. Individual slices were transferred to a recording chamber mounted on an upright microscope (Olympus BX51WI) and continuously superfused (2 ml/min) with aCSF warmed to 32-34°C by passing it through a feedback-controlled in-line heater (TC-324B; Warner Instruments). Cells were visualized through a 40X water-immersion objective with differential interference contrast (DIC) optics and infrared illumination. Fluorescent-guided whole-cell patch clamp recordings were performed with a MultiClamp 700B amplifier (Axon Instruments). Patch pipettes were 3–5 MΩ when filled with an internal solution containing (in mM): 142 K-gluconate, 10 HEPES, 1 EGTA, 2.5 MgCl2, 0.25 CaCl2, 4 Mg-ATP, 0.3 Na-GTP, 10 Na2-Phosphocreatine (Ph 7.3 adjusted with KOH, 300 mOsmol). To test leptin sensitivity, a phosphocreatine-free internal solution was used to prevent KATP blockade (Nicholas C.G & Lederer W.J. 1989) (in mM): 142 K-gluconate, 10 HEPES, 2.5 EGTA, 2.5 MgCl2, 0.25 CaCl2, 2 Mg-ATP, 0.3 Na-GTP. The whole-cell patch clamp recording was initiated by rupturing the plasma membrane of the cell voltage-clamped at −60 mV. Immediately after the formation of the whole-cell configuration, the clamp mode was switched to current clamp and the current injection was set to zero, membrane potential and spontaneous firing were recorded before a negative current pulse was applied to measure the input resistance and a series of current steps were used to detect the action potential rheobase (the minimal injected current required for the generation of an action potential). Voltage clamp recordings were performed following current clamp recordings. The junction potential was not corrected throughout the study.
Body Weight, Food Intake and Energy Expenditure
Body Weight Studies.
Weekly body weight was monitored on all genotypes mice fed standard mouse chow (Teklad F6 Rodent Diet 8664, 4.05 kcal/g, 3.3 kcal/g metabolizable energy, 12.5% kcal from fat, Harlan Teklad, Madison, WI) for 11 weeks after viral delivery. Body composition (fat mass and lean mass) was measured at indicated times by using the Echo-MRI system (Echo MRI, Houston, Texas).
Food Intake Measurements.
In young age mice, all study subjects were individually housed after weaning, and daily food intake was monitored for 1 week 3 days after viral delivery. Body weights of these mice were also recorded at the beginning and end of the measurement period. Daily food intakes were calculated as the mean values of the one week measurement. All housing cages were changed daily during the measurement period.
CLAMS Analysis
Energy expenditure was measured by oxygen consumption by indirect calorimetry. Individual housed mice maintained on chow diet 3-4 days after viral delivery when there would no significant difference in body weight between groups. Body weight were measured before and after CLAMS measurements. Mice were placed at room temperature (22°C-24°C) in chambers of a Comprehensive Lab Animal Monitoring System (CLAMS, Columbus Instruments, Columbus, OH) with capacity of simultaneous measurement of food intake, O2 consumption and locomotion (beam breaks). Food and water were provided ad libitum. Mice were acclimatized in the chambers for at least 48 hours prior to data collection. Readings of O2 consumption, locomotion and food intake were ploted and compared between groups.
Immunostaining and imaging
After behavioral experiments were completed, study subjects were anesthetized with a ketamine/xylazine cocktail (100 mg/kg and 10 mg/kg, respectively) and subjected to transcardial perfusion. During perfusion, animals were flushed with 20 mL of saline prior to fixation with 20 mL of 10% buffered formalin. Freshly fixed brains were then extracted and placed in 10% buffered formalin in 4ºC overnight for post-fixation. The next day, brains were transferred to 30% sucrose solution and allowed to rock at room temperature for 24 h prior to sectioning. Brains were frozen and sectioned into 30 μm slices with a sliding microtome and mounted onto slides for post-hoc visualization of injection sites and cannula placements. Brain sections were immunostained with antibodies against c-Fos (1:2000,# 2250S, Cell Signaling Technology, Danvers, MA), pSTAT3 (1:1000,#9145S, Cell Signaling Technology, Danvers, MA) or GFAP (1:1000,# NB100-53809, Novusbio, Centennial, CO). Brain sections with reporter expression and/or immunostained flurosceins were visualized with confocal microscopy (Leica TCS SP5; Leica Microsystems, Wetzlar, Germany). For c-Fos responses to fasting, mice were perfused with either fed ad libitum (feed) or overnight fasted (fasting). For c-Fos and p-STAT3 counting, matched sections at the same bregma levels from at least 3 different animals per group were used to count neurons with clear and strong signals of c-Fos immunostaining and the counted numbers were averaged and compared between conditions and/or groups.
Leptin treatement experiment.
For i.c.v. leptin infusiton, adult ob/ob and mice with NachBac expression with body weight of more than 40 grams received surgeries for the implantation of 3-week duration minipums (DURECT Corporation, Cupertino, CA), prefilled with leptin (Dr. Parlow, Harbor-UCLA, CA), which allows slow infusion of leptin (50ng/h) for 3 weeks. Mice were measured for feeding and body weight once 3 days, and analyzed for body composition before the end of the experiment. After perfusion, brain sections were analyzed for both NachBac vector, p-STAT3 and c-Fos expression. For i.p. leptin injections, adult controls, ob/ob or NachBac mice fasting overnight and received a single bolus injection of leptin 2 mg/kg 44, and mice were perfused 1 hours later. Brain sections were analyzed for NachBac vector, p-STAT3 and c-Fos expression.
Leptin measurement.
Serum was obtained 11 weeks after NachBac delivery to the Arc of Vgat-Cre mice and used for leptin measurements. Leptin was measured in the Mouse Metabolism and Phenotype Core at Baylor College of Medicine.
Statistical analyses.
GraphPad Prism 7.00 (GraphPad Software, Inc., La Jolla, CA, USA) was used for all statistical analyses and construction of graphs for presentation of data comparison. Comparisons were made by paired or unpaired two-tailed Student’s t-tests, 1-way or 2-way ANOVA followed by Tukey’s multiple comparison post-hoc tests. Error bars in graphs were represented as ± sem.
Data availability statement
The data that support the findings of this study are available from the corresponding author upon request.
Extended Data
Extended Data Fig. 1. Fasting-induced response of c-Fos expression between ArcAgRP and ArcGABA+ neurons and NaChBac expression increases neuron activity.
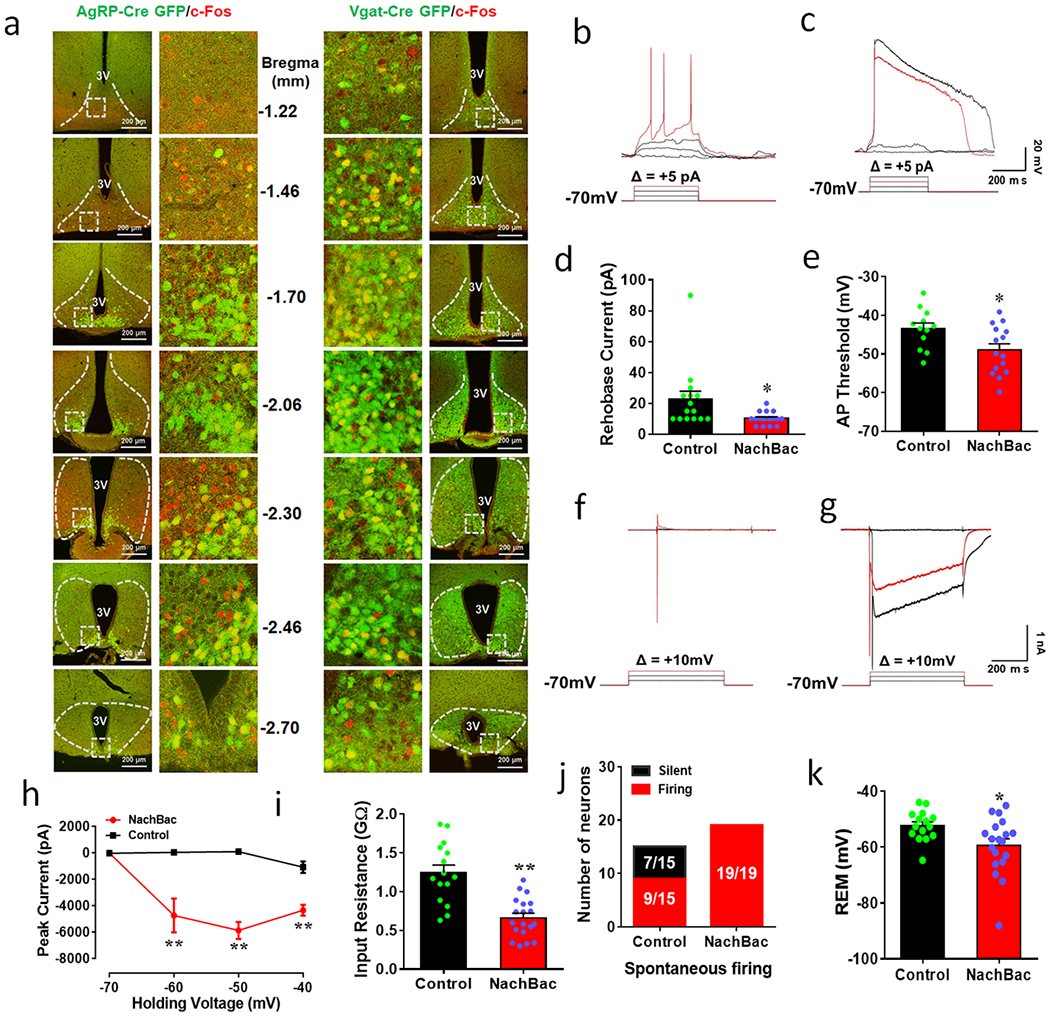
a, Matched sections from Arc in serial rostral to caudal Bregma levels (mm) showing c-Fos (red) and GFP reporter for AgRP neurons (left panels) or ArcGABA+ neurons (right panels). The pictures shown in the middle are magnified pictures of the boxed area at each indicated Bregma level. 3V: the third ventricle. This experiment was repeated in 4 animals/group as indicated in Fig. 1a. b-k, Brain slices from Vgat-Cre::Ai9 reporter mice with stereotaxic injections of Cre-dependent GFP or NachBac vectors to the Arc were used for recording. b-c, Representative traces showing action potential firing by current injections in a step wise increment of 5pA with voltage clamped at −70 mV in control (b) and NachBac expressing neurons (c). d-e, Comparison in Rheobase (minimum current size required to be injected to elicit AP firing) (d, t=2.523, df=31, *p=0.0170) and comparison in minimum membrane potential required to elicit AP firing (e, t=2.436, df=25, *p=0.0223). f-g, Representative traces showing Na+ current traces with step wise voltage depolarization at the +10mV increment from −70mV in control (f) and NachBac expressing neurons (g). h-k, Comparison in Na+ currents at the indicated voltages (h, −60 mV: t=3.507, df=30, **p=0.0015; −50mV: t=8.754, df=30, **p<0.0001; −40 mV: t=5.459, df=30, **p<0.0001), in input resistance of the recorded neurons between groups (i, t=5.200, df=32, **p<0.0001), in number of recorded neurons showing spontaneous firing between groups (j) and in resting membrane potential (REM) between the two groups (k, t=2.441, df=32, *p=0.0204). For b-k, n=15 (control) or n=19 (NachBac), all with 2-sided paired Student’s t tests. 3V: the third ventricle. All data presented as mean+/−sem.
Extended Data Fig. 2. NachBac expression in ArcGABA+ neurons increases neuron activity levels and promotes massive obesity.
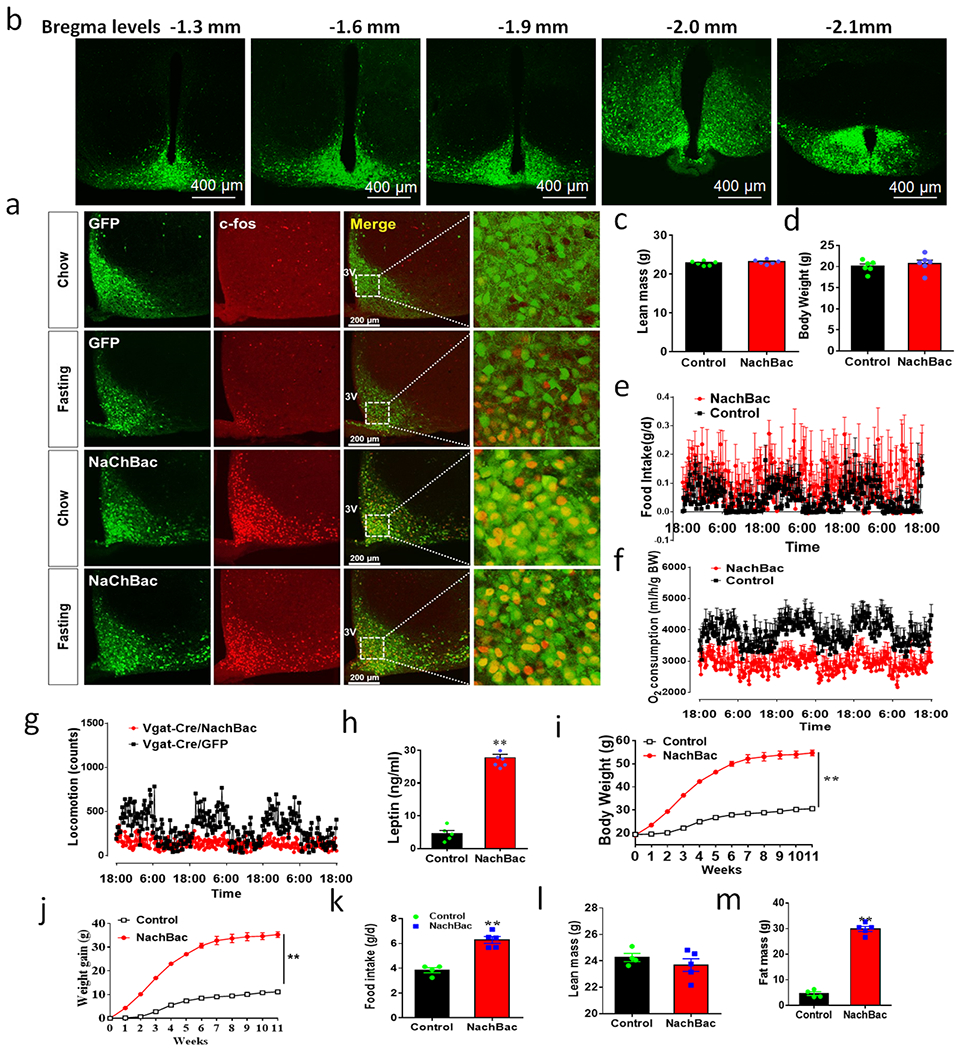
a, A represent expression of pattern of NachBac vector in the Arc from rostral to caudal sections. b, Expression GFP (green column) and c-Fos (red column) and their colocalization (merged column) with magnified pictures showing the boxed area in the merged pictures from Vgat-Cre mice injected with Cre-dependent GFP (top two rows) or NachBac (bottom two rows) when fed ad libitum chow (the first and third rows) or fasted (the second and forth row). It is notable that the vast majority of NachBac-expressing neurons exhibited c-Fos regardless of fed or fasted. This is one of 3 animals/group shown in Fig. 1f. c-g, Associated data from animals presented in Figs. 1g–1k, n=6 animals/group. Comparison in lean mass between control and mice with NachBac expression in ArcGABA-NachBac mice 11 weeks after viral delivery (n=6 each/group, t=1.055, df=10, p=0.3163, 2-sided unpaired Student’s t test). d, Comparison in body weight when mice were placed CLAMS chambers for measurements during the 1st week after viral delivery (n=6/group, t=0.7030 df=10, p=0.4981, 2-sided unpaired Student’s t test). (e-g) Real time measurements of food intake (e), O2 consumption (f) and locomotion (g) over the 3 day measurement period. h, Comparison in leptin levels between groups 11 weeks after viral delivery (n=6/group, t=14.88 df=10, **p<0.0001, 2-sided unpaired Student’s t test). i-m, Female Vgat-Cre were injected with AAV-Flex-EGFP-P2A-mNachBac or control GFP vectors to bilateral Arc at 7-8 weeks of age. Body weight (i, n=6 each/group, df=11, F(11, 84)=41.03, **p<0.0001, two-way ANOVA tests) and body weight gain (j, n=6 each/group, df=11, F(11, 84)=38.60, **p<0.0001, two-way ANOVA tests) were followed weekly for 11 weeks. k-m, Comparison in food intake measured at the first 2 weeks after viral delivery (k, t=6.700 df=7, **p=0.0003, 2-sided unpaired Student’s t test), lean mass (l, t=0.9398 df=7, p=0.3786, 2-sided unpaired Student’s t test) and fat mass (m, t=19.46 df=7, **p<0.0001, 2-sided unpaired Student’s t tests) measured at the end of the 11th week after viral delivery. 3V: the third ventricle. All data presented as mean+/−sem.
Extended Data Fig. 3. NachBac expression in ArcAgRP neurons increases neuron activity levels and promotes massive obesity.
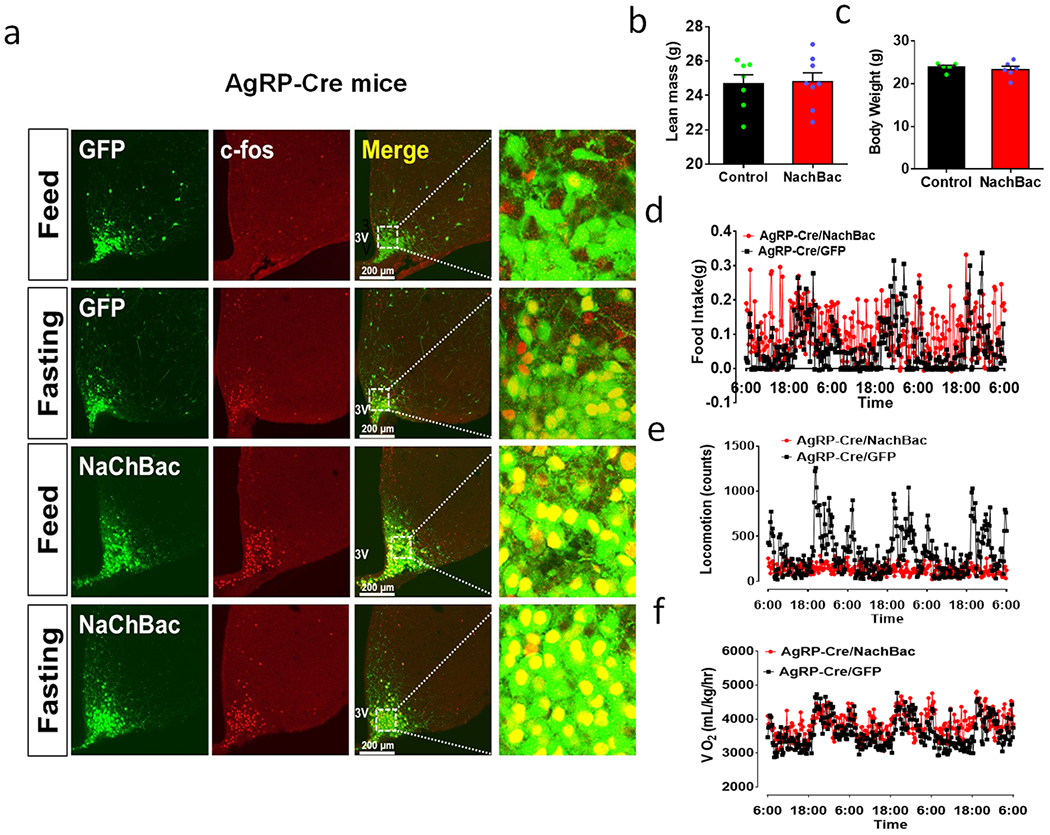
a, Expression GFP (green column) and c-Fos (red column) and their colocalization (merged column) with magnified pictures showing the boxed area in the merged pictures from AgRP-Cre mice injected with Cre-dependent GFP (top two rows) or NachBac (bottom two rows) when treated fed ad libitum chow (the first and third rows) or fasted (the second and forth row). It is notable that the vast majority of NachBac-expressing neurons exhibited c-Fos regardless of fed or fasted, n=3 as presented in Fig. 2c. b, Comparison in lean mass between control and mice with NachBac expression in AgRPNaChBac mice 11 weeks after viral delivery (n=7 for control and 8 for NachBac, t=0.1576, df=13, p=0.8772, 2-sided unpaired Student’s t test). c, Comparison in body weight when mice were placed in CLAMS chambers for O2 consumption measurements during the 1st week after viral delivery (n=7 for control and 8 for NachBac, t=0.5734, df=9, p=0.5804, 2-sided unpaired Student’s t test). d-f, Real time measurements of food intake (d), locomotion (e) and O2 consumption (f) over 3 days. 3V: the third ventricle. Data presented as mean+/−sem.
Extended Data Fig. 4. AgRP neuron ablation causes no difference in obesity development by NachBac.
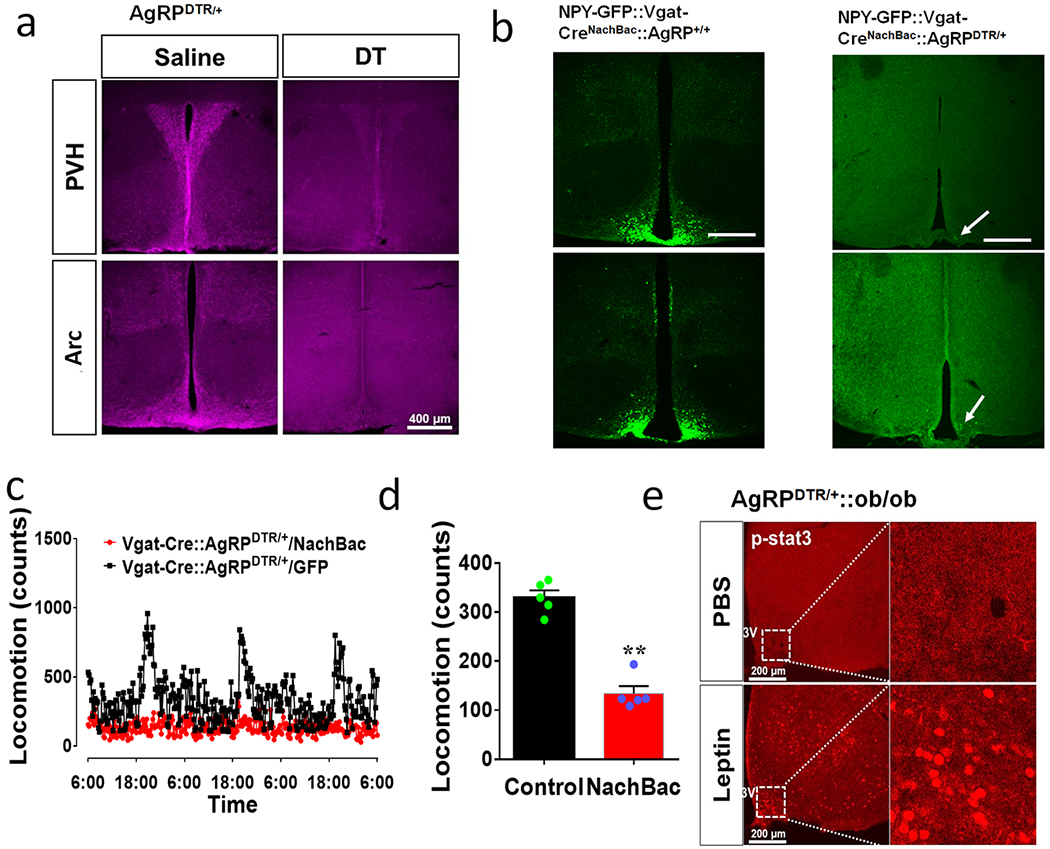
a, Representative pictures showing immunostraining for AgRP in PVH (top panels) and Arc (bottom panels) in adult AgRPDTR/+ mice treated with either saline (left panels) or DTX (right panels) at day 3, repeated in 3 mice. b, NPY-GFP transgene was bred into AgRPDTR/+ mice, and DTX treatment led to almost complete ablation of NPY neurons in the Arc (arrows), repeated in one additional mouse. c-d, Expression of NachBac in the Arc of Vgat-Cre mice with AgRP neuron lesion caused reduced locomotion shown in representative traces (c) and comparison in locomotion between groups (d, n=5 each/groups, t=9.366, df=8, **p<0.0001, 2-sided Student’s t test). e, i.c.v. leptin infusion was confirmed by induction of p-STAT3 shown by immunostaining (bottom panels), compared to control PBS infusion (top panels), repeated in 3 mice. 3V: the third ventricle. Scale bar in b: 400 μM and arrows in panel b pointing to residual NPY neurons. Data presented as mean+/−sem.
Extended Data Fig. 5. Activation by NachBac overrides leptin-mediated inhibitory action.
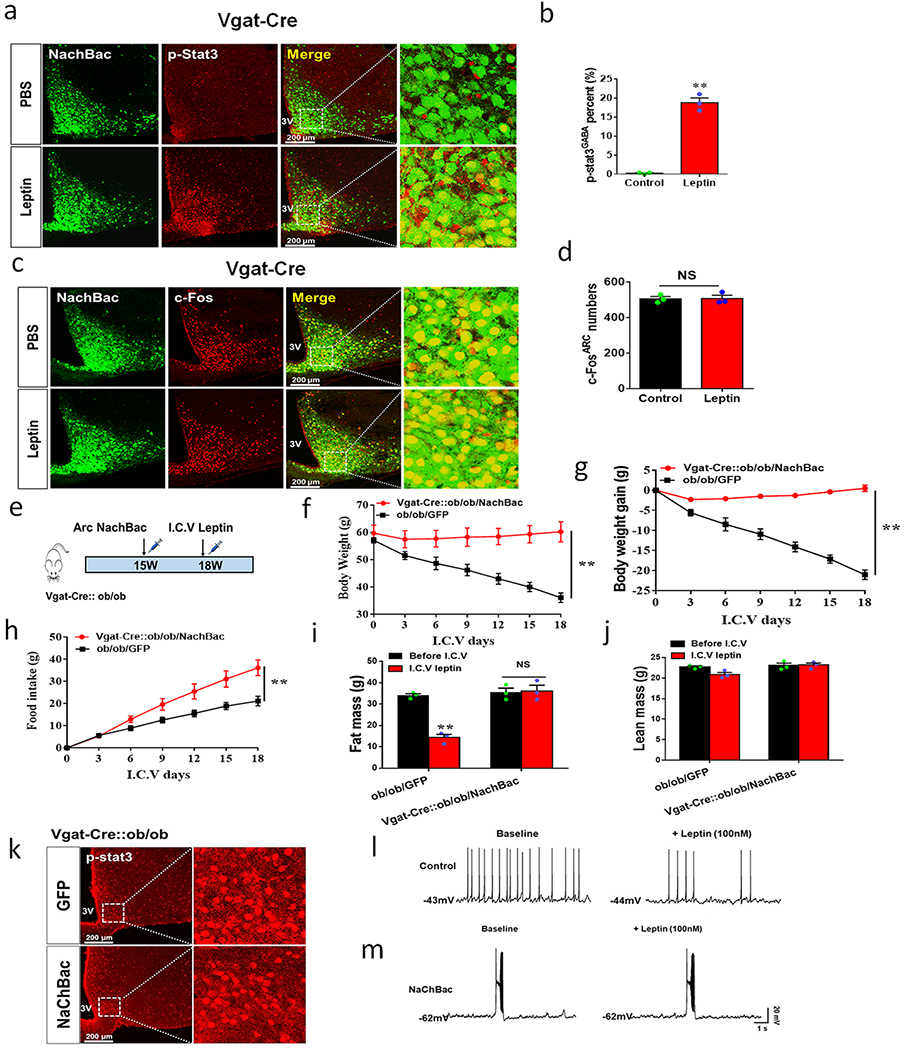
a-b, Vgat-Cre mice (9-10 weeks of age) with prior injections of AAV-Flex-GFP-p2A-mNachBac to the Arc received i.p. injections of saline (top panels) or leptin (bottom rows), and then immunostained for p-STAT3 (a) and quantification for p-STAT3 expression in ArcGABA+ neurons (b, n=3, t=14.82, df=4, **p=0.0001, 2-sided unpaired Student’s t test). c-d, Colocalizatoin of NaChBac expression in the Arc with c-Fos in mice treated with saline (top panels) or leptin (bottom panels) (c) and comparison in the colocalization between groups (d, n=3, t=0.09029, df=4, p=0.7934, 2-sided unpaired t test). e-g, Vgat-Cre::ob/ob mice (9-10 weeks of age) with injections of AAV-Flex-GFP-p2A-mNachBac or control GFP virus to the Arc and then received munipump infusion of leptin (50ng/hr). e, Diagram showing experimental design. b-d, Daily weight (f, n=3 each/group, df=6, F96,28)=4.269, **p=0.0036, two-way ANOVA tests), percentage of body weight change (g, n=3 each/group, df=6, F(6, 28)=38.67, **p<0.0001, two-way ANOVA tests) and feeding (h, n=3 each/group, F(6, 28)=12.24, **p<0.0001, two-way ANOVA tests) measured during the 18 day period on leptin minipump. i-j, Body composition changes before and after leptin infusion in fat mass (i, GFP: t=11.64 df=4, p=0.0122; NachBac: t=0.2211 df=4, p=0.3569, both 2-sided unpaired Student’s t tests) and lean mass (j, GFP: t=3.198, df=4, p=0.1309; and NachBac: t=0.2411, df=4, p=0.5970, both 2-sided unpaired Student’s t tests). k, Induction of p-STAT3 in the Arc of both groups, repeated in 2 other animals. l-m, Electrophysiological recording of neurons with control GFP (l, n=11 each/group,) or NachBac (g, n=11 each/group) expression treated with leptin (100nM) as presented in Fig. 5j. 3V: the third ventricle. Data presented as mean+/−sem.
Extended Data Fig. 6. Kir2.1 expression causes neuron inhibition.
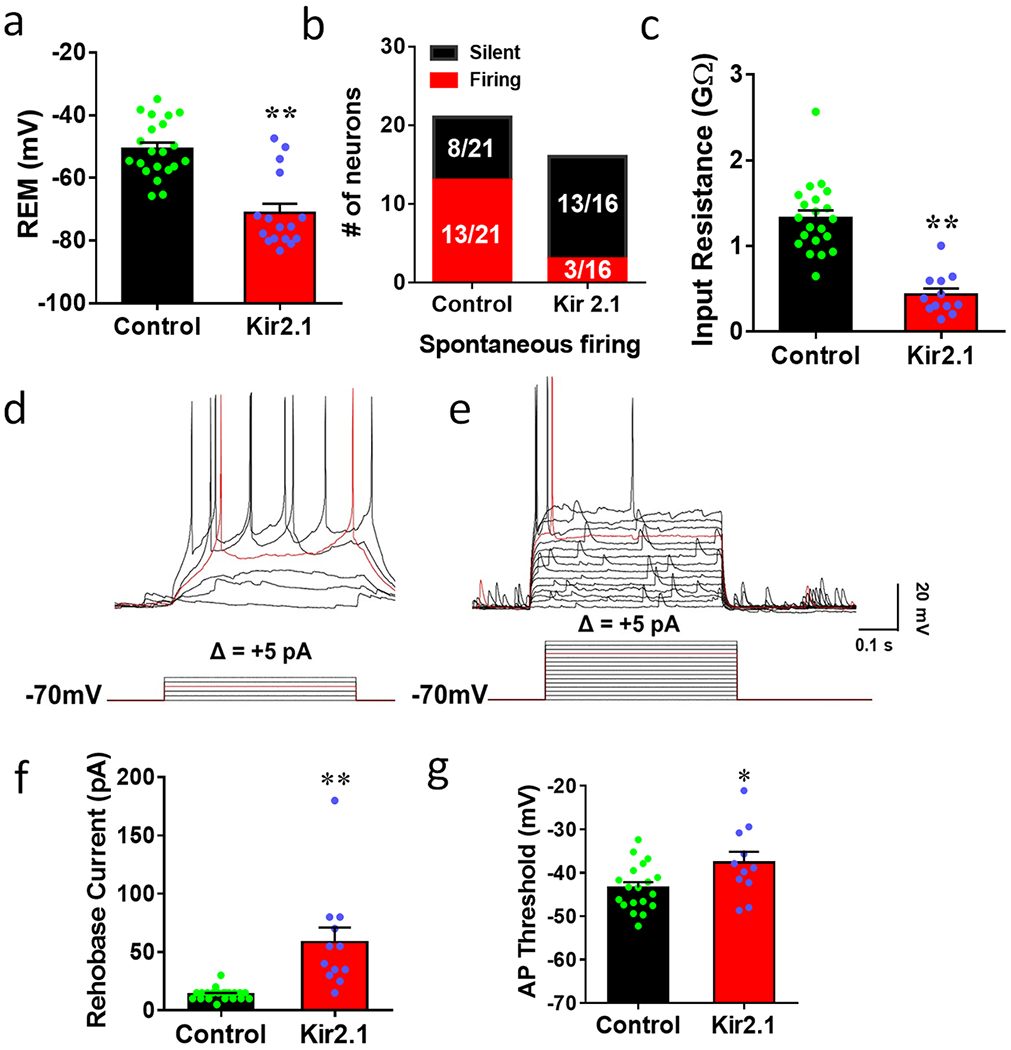
a-g, Brain slices from Vgat-Cre mice (9-10 weeks of age) with prior injections of AAV-DIO-Kir2.1-p2A-dTomato or control vectors to the Arc were used for electrophysiological recording. Recorded neurons from both groups were analyzed for comparison in resting membrane potential (REM, a, n= 21 (control) or 16 (Kir2.1), t=5.978, df=35, **p<0.0001, 2-sided unpaired Student’s t test), in percentage of neuron with spontaneous AP firing (b) and in input resistance (c, n= 21 (control) or 16 (Kir2.1), t=6.892, df=31, **p<0.0001). d-e, Representative traces showing action potential firing with step wise current injections at the 5pA increment in control (d) and Kir2.1 (e) mice. f-g, Comparison in Rheobase (minimal currents required for AP firing) (f, n= 21 (control) or 16 (Kir2.1), t=4.660 df=31, **p<0.0001, 2-sided unpaired Student’s t test) and AP firing threshold (g, n= 21 (control) or 16 (Kir2.1), t=7.071 df=4, *p=0.0265, 2-sided unpaired Student’s t test) between the 2 groups. All data presented as mean+/−sem.
Extended Data Fig. 7. Kir2.1 expression reduces neuron activity and related effects on energy balance.
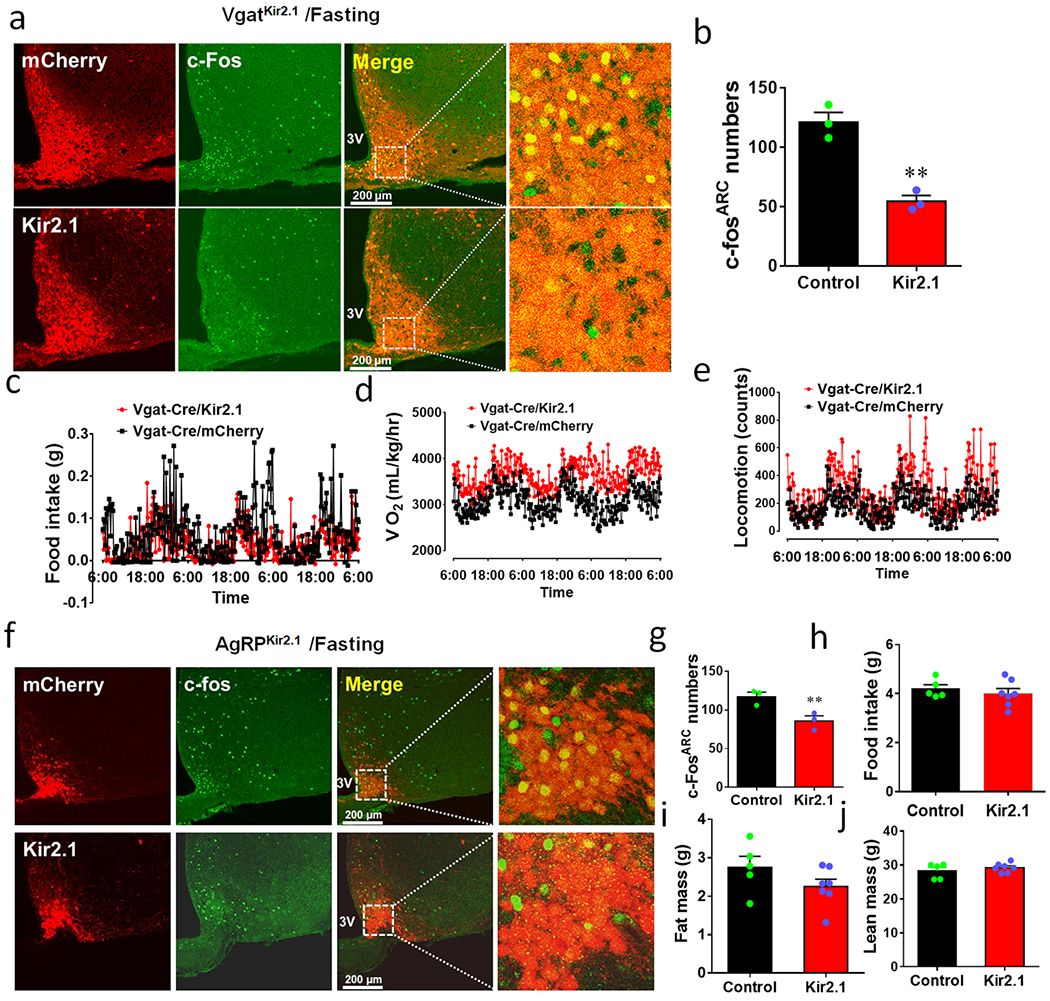
a, Vgat-Cre mice received either control vector (top panels) or AAV-DIO-Kir2.1-p2A-dTomato (bottom panels) to the Arc, and immunostraining was performed 4 weeks after viral delivery for c-Fos (green column) in response to overnight fasting (magnified pictures showing details of the boxed areas in the merged pictures as indicated), n=3 as presented in panel b. b, Comparison in the number of Arc neurons with c-Fos expression between groups (n=3 each/group, t=3.648 df=4, **p=0.0021, 2-sided unpaired Student’s t test). c-e, CLAMS measurements of feeding (c), O2 consumption (d) and locomotion (e) in mice with control or Kir2.1 vector delivery to bilateral Arc of Vgat-Cre mice. The CLAMS measurement was performed during the first week after viral delivery when body weight difference is minimal, n=5 each/group as presented in Fig. 6g–6i. f, AgRP-Cre mice received either control vector (top panels) or kir2.1 vectors (bottom panels) to the Arc, and immunostraining was performed 4 weeks after viral delivery for c-Fos (green column) in response to overnight fasting (magnified pictures on the right showing details of the boxed areas in the merged pictures as indicated), n=3 as presented in panel g. g, Comparison in c-Fos neurons in response to fasting in the Arc between groups (n=3 each/group, t=3.648, df=4, **p=0.0218, 2-sided Student’s t test). h-j, Comparison in food intake (h, n=5 (control) or 7 (Kir2.1), t=0.6790, df=10, p=0.5125, 2-sided unpaired Student’s t test), fat mass (i, n=5 (control) or 7 (Kir2.1), t=1.507, df=10, p=0.1628, 2-sided unpaired Student’s t test) and lean mass (j, n=5 (control) or 7 (Kir2.1), t=0.9326, df=10, p=0.3730, 2-sided unpaired Student’s t test) during the 3rd week after viral delivery. 3V: the third ventricle. Data presented as mean+/−sem.
Extended Data Fig. 8. TeLC expression in AgRP neurons causes no obvious effects on body weight.
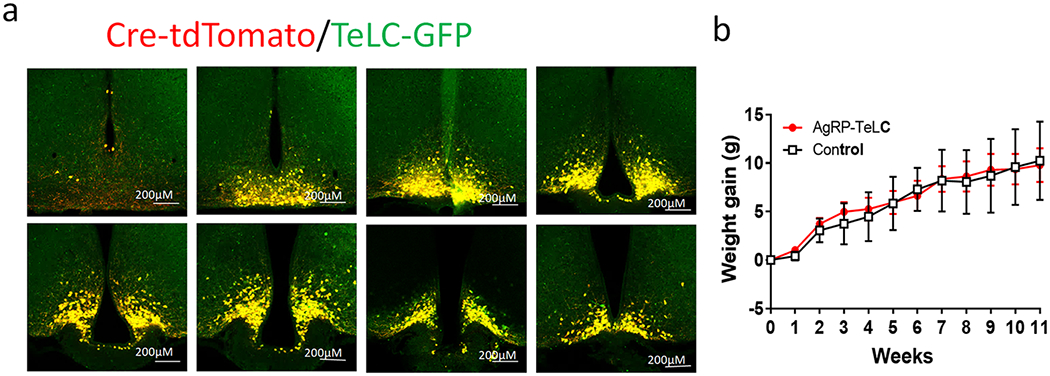
a, Represent pictures showing expression of AAV-DIO-TeLC-GFP injected to the Arc and tdTomato expression in AgRP-Cre:Ai9 reporter mice in a rostral to caudal series of sections. b, Body weight of a group of mice (males) injected at 6-7 weeks of age and their controls with AAV-DIO-GFP injections (n=6 for control and =7 for TeLC, F(11, 84)=0.04721, p>0.9999, two-way ANOVA tests). Data presented as mean+/−sem.
Extended Data Fig. 9. Kir2.1 expression in Arc GABA+ neurons reduces neuron activity and normalizes body weight of ob/ob mice.
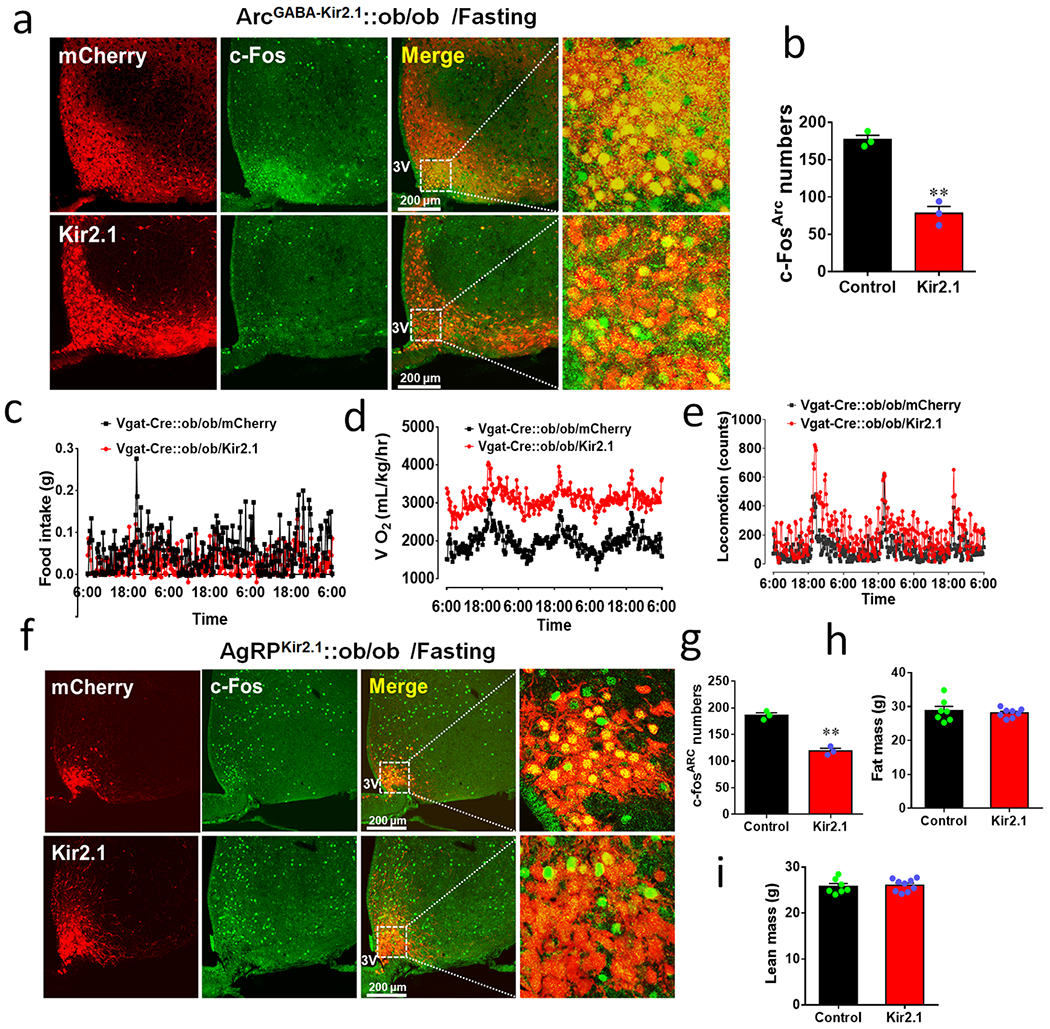
a, Vgat-Cre::ob/ob mice received either control vector (top panels) or AAV-DIO-Kir2.1-p2A-dTomato (bottom panels) to the Arc, and immunostraining was performed 4 weeks after viral delivery for c-Fos (green column) in response to overnight fasting (the magnified pictures on the right showing details of the boxed areas in the merged pictures as indicated). b, Comparison in the number of Arc neurons with c-Fos expression between groups (n=3 each/group, t=8.990, df=4, **p=0.0008, 2-sided unpaired Student’s t test). c-e, CLAMS measurements of feeding (c), O2 consumption (d) and locomotion (e) in mice with control or Kir2.1 vector delivery to bilateral Arc of Vgat-Cre::ob/ob mice. The CLAMS measurement was performed during the first week after viral delivery when body weight difference between groups was minimal, n=5 each/group as presented in Fig. 7c–7h. f, AgRP-Cre::ob/ob mice received either control vector (top panels) or kir2.1 vectors (bottom panels) to the Arc, and immunostraining was performed 4 weeks after viral delivery for c-Fos (green column) in response to overnight fasting (the magnified pictures on the right showing details of the boxed areas in the merged pictures as indicated), n=3 as presented in Fig. 7j and panel g. g-i, Comparison in the number of Arc neurons expressing c-Fos between the groups (g, n=3 each/group, t=10.15, df=4, **p=0.0005, 2-sided unpaired Student’s t test), fat mass (h, n=7 (control) or 8 (Kir2.1), t=0.5465, df=13, p=0.5940, 2-sided unpaired Student’s t test) and lean mass (i, n=7 (control) or 8 (Kir2.1), t=0.3036, df=14, p(two-tailed)=0.7659, 2-sided unpaired Student’s t test) at the 11th week after viral delivery. 3V: the third ventricle. Data presented as mean+/−sem.
Extended Data Fig. 10. Expression pattern of Kir2.1 in Arc neurons and the related effects.
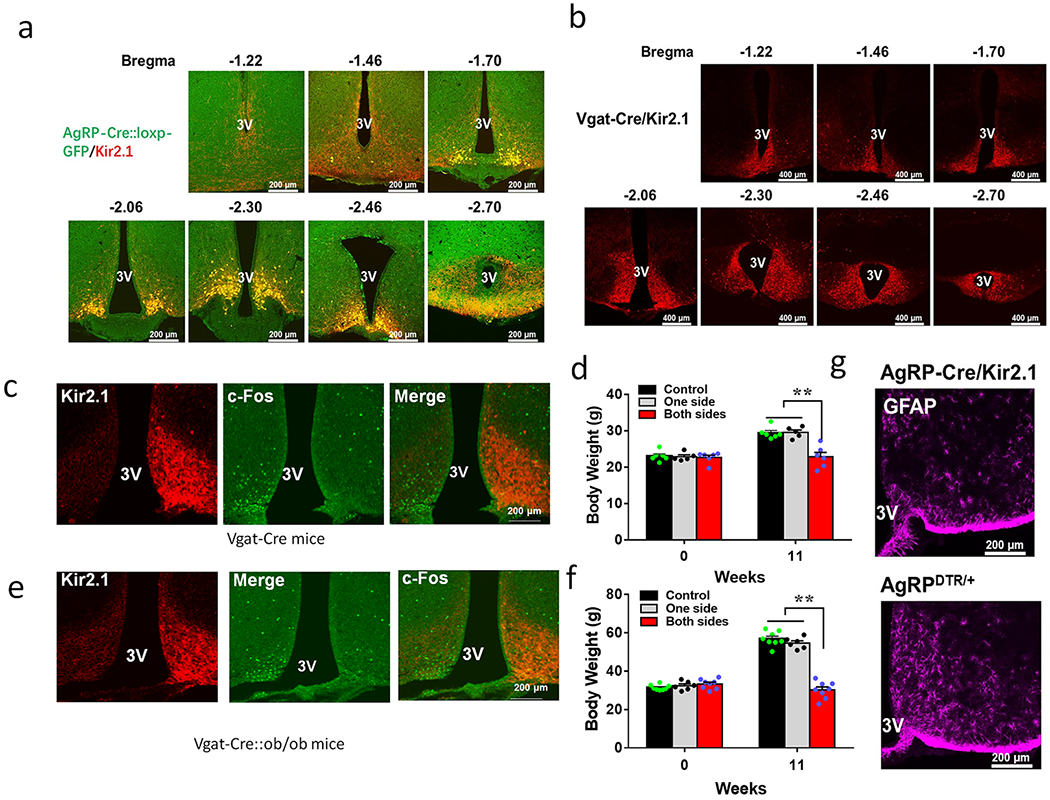
a, Representative pictures showing expression patterns of Kir2.1-expressing vectors in AgRP neurons as observed in dTomato expression from serial rostral to caudal Arc sections. In order to confirm that all AgRP neurons express the Kir2.1 vector, AgRP-Cre mice were bred with GFP-reporter mice and almost all GFP-labelled neurons showed expression of Kir2.1 vector. b, Representative pictures showing expression patterns of Kir2.1-expressing vectors in Vgat neurons, as illustrated by dTomato expression from serial rostral to caudal Arc sections. c-f, Expression of Kir2.1-expressing vectors in one side of Arc and effects on fasting-induced c-Fos in the Arc of Vgat-Cre male mice (c) and the effect on body weight 11 weeks after viral expression (d, n=7 (control), 5 (one side) or 6 (both sides), F(2, 14)=17.77, p=0.0008: control vs two sides, and p=0.0014: one side vs two sides, one-way ANOVA tests). e-f, Expression of Kir2.1-expressing vectors in one side of Arc and effect of fasting-induced c-Fos in the Arc in Vgat-Cre::ob/ob male mice (e) and the effect on body weight 11 weeks after viral expression (f, n=8 for control, 7 for one side, or 8 for both sides, F(2, 19)=116, **p<0.0001: control vs two sides, and **p<0.0001: one side vs two sides, one-way ANOVA tests). g, GFAP expression in the Arc of AgRP-Cre mice injected with the Kir2.1 vectors (top panel) or with AgRP lesion (bottom panel), repeated in one additional mouse. 3V: the third ventricle. All data presented at mean+/− sem.
Supplementary Material
Detailed statistics information for comparisons in all Figures.
Statistical Source Data
Statistical Source Data
Statistical Source Data
Statistical Source Data
Statistical Source Data
Statistical Source Data
Statistical Source Data
Statistical Source Data
Statistical Source Data
Statistical Source Data
Statistical Source Data
Statistical Source Data
Statistical Source Data
Statistical Source Data
Statistical Source Data
Statistical Source Data
Acknowledgements:
This study was supported by NIH R01 DK114279 and R21NS108091 to QT; R01DK109934 and DOD W81XWH-19-1-0429 to B.R.A. and Q.T.; NIH R01DK117281 and R01DK101379 to Yong X; NIH and R01MH117089 and McKnight Foundation to M.X. We also acknowledge the Neuroconnectivity Core funded by NIH IDDRC grant 1 U54 HD083092 and Baylor College of Medicine Gene Vector Core for providing AAV vectors. C.Z was supported by the Graduate Student Overseas Study Program (2017LHPY024) from South China Agricultural University. We would like to acknowledge the Tong lab members for helpful discussion, Dr. Zhengmei Mao for help with microscopy. QT is the holder of Cullen Chair in Molecular Medicine at McGovern Medical School. The BCM core facility was supported by MPC at BCM & NIH fund RO1DK114356 & UM1HG006348.
Footnotes
Competing interests:
All authors declare no competing interests.
References
- 1.Krashes MJ et al. An excitatory paraventricular nucleus to AgRP neuron circuit that drives hunger. Nature 507, 238–242, doi: 10.1038/nature12956 (2014). [DOI] [PMC free article] [PubMed] [Google Scholar]
- 2.Atasoy D, Betley JN, Su HH & Sternson SM Deconstruction of a neural circuit for hunger. Nature 488, 172–177, doi: 10.1038/nature11270 (2012). [DOI] [PMC free article] [PubMed] [Google Scholar]
- 3.Krashes MJ et al. Rapid, reversible activation of AgRP neurons drives feeding behavior in mice. J Clin Invest 121, 1424–1428, doi: 10.1172/JCI46229 (2011). [DOI] [PMC free article] [PubMed] [Google Scholar]
- 4.Aponte Y, Atasoy D & Sternson SM AGRP neurons are sufficient to orchestrate feeding behavior rapidly and without training. Nature neuroscience 14, 351–355, doi: 10.1038/nn.2739 (2011). [DOI] [PMC free article] [PubMed] [Google Scholar]
- 5.Chen Y, Lin YC, Kuo TW & Knight ZA Sensory detection of food rapidly modulates arcuate feeding circuits. Cell 160, 829–841, doi: 10.1016/j.cell.2015.01.033 (2015). [DOI] [PMC free article] [PubMed] [Google Scholar]
- 6.Betley JN et al. Neurons for hunger and thirst transmit a negative-valence teaching signal. Nature 521, 180–185, doi: 10.1038/nature14416 (2015). [DOI] [PMC free article] [PubMed] [Google Scholar]
- 7.Beutler LR et al. Dynamics of Gut-Brain Communication Underlying Hunger. Neuron 96, 461–475 e465, doi: 10.1016/j.neuron.2017.09.043 (2017). [DOI] [PMC free article] [PubMed] [Google Scholar]
- 8.Chen Y et al. Sustained NPY signaling enables AgRP neurons to drive feeding. Elife 8, doi: 10.7554/eLife.46348 (2019). [DOI] [PMC free article] [PubMed] [Google Scholar]
- 9.Leinninger GM et al. Leptin acts via leptin receptor-expressing lateral hypothalamic neurons to modulate the mesolimbic dopamine system and suppress feeding. Cell metabolism 10, 89–98, doi:S1550-4131(09)00195-8 [pii] 10.1016/j.cmet.2009.06.011 (2009). [DOI] [PMC free article] [PubMed] [Google Scholar]
- 10.Myers MG Jr., Munzberg H, Leinninger GM & Leshan RL The geometry of leptin action in the brain: more complicated than a simple ARC. Cell Metab 9, 117–123, doi: 10.1016/j.cmet.2008.12.001 (2009). [DOI] [PMC free article] [PubMed] [Google Scholar]
- 11.Leshan RL, Greenwald-Yarnell M, Patterson CM, Gonzalez IE & Myers MG Jr. Leptin action through hypothalamic nitric oxide synthase-1-expressing neurons controls energy balance. Nature medicine 18, 820–823, doi: 10.1038/nm.2724 (2012). [DOI] [PMC free article] [PubMed] [Google Scholar]
- 12.Rupp AC et al. Specific subpopulations of hypothalamic leptin receptor-expressing neurons mediate the effects of early developmental leptin receptor deletion on energy balance. Molecular metabolism 14, 130–138, doi: 10.1016/j.molmet.2018.06.001 (2018). [DOI] [PMC free article] [PubMed] [Google Scholar]
- 13.van de Wall E et al. Collective and individual functions of leptin receptor modulated neurons controlling metabolism and ingestion. Endocrinology 149, 1773–1785, doi: 10.1210/en.2007-1132 (2008). [DOI] [PMC free article] [PubMed] [Google Scholar]
- 14.Goncalves GH, Li W, Garcia AV, Figueiredo MS & Bjorbaek C Hypothalamic agouti-related peptide neurons and the central melanocortin system are crucial mediators of leptin’s antidiabetic actions. Cell reports 7, 1093–1103, doi: 10.1016/j.celrep.2014.04.010 (2014). [DOI] [PMC free article] [PubMed] [Google Scholar]
- 15.Egan OK, Inglis MA & Anderson GM Leptin Signaling in AgRP Neurons Modulates Puberty Onset and Adult Fertility in Mice. The Journal of neuroscience : the official journal of the Society for Neuroscience 37, 3875–3886, doi: 10.1523/JNEUROSCI.3138-16.2017 (2017). [DOI] [PMC free article] [PubMed] [Google Scholar]
- 16.Vong L et al. Leptin Action on GABAergic Neurons Prevents Obesity and Reduces Inhibitory Tone to POMC Neurons. Neuron 71, 142–154, doi:S0896-6273(11)00479-X [pii] 10.1016/j.neuron.2011.05.028 (2011). [DOI] [PMC free article] [PubMed] [Google Scholar]
- 17.Xu J et al. Genetic identification of leptin neural circuits in energy and glucose homeostases. Nature 556, 505–509, doi: 10.1038/s41586-018-0049-7 (2018). [DOI] [PMC free article] [PubMed] [Google Scholar]
- 18.Patel JM et al. Sensory perception drives food avoidance through excitatory basal forebrain circuits. Elife 8, doi: 10.7554/eLife.44548 (2019). [DOI] [PMC free article] [PubMed] [Google Scholar]
- 19.Xue M, Atallah BV & Scanziani M Equalizing excitation-inhibition ratios across visual cortical neurons. Nature 511, 596–600, doi: 10.1038/nature13321 (2014). [DOI] [PMC free article] [PubMed] [Google Scholar]
- 20.Rothwell PE et al. Autism-associated neuroligin-3 mutations commonly impair striatal circuits to boost repetitive behaviors. Cell 158, 198–212, doi: 10.1016/j.cell.2014.04.045 (2014). [DOI] [PMC free article] [PubMed] [Google Scholar]
- 21.Campbell JN et al. A molecular census of arcuate hypothalamus and median eminence cell types. Nat Neurosci 20, 484–496, doi: 10.1038/nn.4495 (2017). [DOI] [PMC free article] [PubMed] [Google Scholar]
- 22.Luquet S, Perez FA, Hnasko TS & Palmiter RD NPY/AgRP neurons are essential for feeding in adult mice but can be ablated in neonates. Science 310, 683–685, doi: 10.1126/science.1115524 (2005). [DOI] [PubMed] [Google Scholar]
- 23.Harris RB et al. A leptin dose-response study in obese (ob/ob) and lean (+/?) mice. Endocrinology 139, 8–19, doi: 10.1210/endo.139.1.5675 (1998). [DOI] [PubMed] [Google Scholar]
- 24.Munzberg H et al. Appropriate inhibition of orexigenic hypothalamic arcuate nucleus neurons independently of leptin receptor/STAT3 signaling. The Journal of neuroscience : the official journal of the Society for Neuroscience 27, 69–74, doi: 10.1523/JNEUROSCI.3168-06.2007 (2007). [DOI] [PMC free article] [PubMed] [Google Scholar]
- 25.Ottaway N et al. Diet-induced obese mice retain endogenous leptin action. Cell metabolism 21, 877–882, doi: 10.1016/j.cmet.2015.04.015 (2015). [DOI] [PMC free article] [PubMed] [Google Scholar]
- 26.Yu S et al. Preoptic leptin signaling modulates energy balance independent of body temperature regulation. eLife 7, doi: 10.7554/eLife.33505 (2018). [DOI] [PMC free article] [PubMed] [Google Scholar]
- 27.Dhillon H et al. Leptin directly activates SF1 neurons in the VMH, and this action by leptin is required for normal body-weight homeostasis. Neuron 49, 191–203, doi: 10.1016/j.neuron.2005.12.021 (2006). [DOI] [PubMed] [Google Scholar]
- 28.Flak JN et al. A leptin-regulated circuit controls glucose mobilization during noxious stimuli. The Journal of clinical investigation 127, 3103–3113, doi: 10.1172/JCI90147 (2017). [DOI] [PMC free article] [PubMed] [Google Scholar]
- 29.Senn SS et al. Unsilencing of native LepRs in hypothalamic SF1 neurons does not rescue obese phenotype in LepR-deficient mice. Am J Physiol Regul Integr Comp Physiol 317, R451–R460, doi: 10.1152/ajpregu.00111.2019 (2019). [DOI] [PubMed] [Google Scholar]
- 30.Zhang X & van den Pol AN Hypothalamic arcuate nucleus tyrosine hydroxylase neurons play orexigenic role in energy homeostasis. Nature neuroscience 19, 1341–1347, doi: 10.1038/nn.4372 (2016). [DOI] [PMC free article] [PubMed] [Google Scholar]
- 31.Kong D et al. GABAergic RIP-Cre neurons in the arcuate nucleus selectively regulate energy expenditure. Cell 151, 645–657, doi: 10.1016/j.cell.2012.09.020 (2012). [DOI] [PMC free article] [PubMed] [Google Scholar]
- 32.Wu Q, Whiddon BB & Palmiter RD Ablation of neurons expressing agouti-related protein, but not melanin concentrating hormone, in leptin-deficient mice restores metabolic functions and fertility. Proceedings of the National Academy of Sciences of the United States of America 109, 3155–3160, doi: 10.1073/pnas.1120501109 (2012). [DOI] [PMC free article] [PubMed] [Google Scholar]
- 33.Wu Q, Howell MP & Palmiter RD Ablation of neurons expressing agouti-related protein activates fos and gliosis in postsynaptic target regions. The Journal of neuroscience : the official journal of the Society for Neuroscience 28, 9218–9226, doi: 10.1523/JNEUROSCI.2449-08.2008 (2008). [DOI] [PMC free article] [PubMed] [Google Scholar]
- 34.Sweeney P, Qi Y, Xu Z & Yang Y Activation of hypothalamic astrocytes suppresses feeding without altering emotional states. Glia 64, 2263–2273, doi: 10.1002/glia.23073 (2016). [DOI] [PubMed] [Google Scholar]
- 35.Kalra SP & Kalra PS NPY and cohorts in regulating appetite, obesity and metabolic syndrome: beneficial effects of gene therapy. Neuropeptides 38, 201–211, doi: 10.1016/j.npep.2004.06.003 (2004). [DOI] [PubMed] [Google Scholar]
- 36.Tong Q, Ye CP, Jones JE, Elmquist JK & Lowell BB Synaptic release of GABA by AgRP neurons is required for normal regulation of energy balance. Nature neuroscience 11, 998–1000, doi: 10.1038/nn.2167 (2008). [DOI] [PMC free article] [PubMed] [Google Scholar]
- 37.Qian S et al. Neither agouti-related protein nor neuropeptide Y is critically required for the regulation of energy homeostasis in mice. Mol Cell Biol 22, 5027–5035, doi: 10.1128/mcb.22.14.5027-5035.2002 (2002). [DOI] [PMC free article] [PubMed] [Google Scholar]
- 38.Wu Q, Boyle MP & Palmiter RD Loss of GABAergic signaling by AgRP neurons to the parabrachial nucleus leads to starvation. Cell 137, 1225–1234, doi: 10.1016/j.cell.2009.04.022 (2009). [DOI] [PMC free article] [PubMed] [Google Scholar]
- 39.Meng F et al. New inducible genetic method reveals critical roles of GABA in the control of feeding and metabolism. Proceedings of the National Academy of Sciences of the United States of America 113, 3645–3650, doi: 10.1073/pnas.1602049113 (2016). [DOI] [PMC free article] [PubMed] [Google Scholar]
- 40.Uner AG et al. Role of POMC and AgRP neuronal activities on glycaemia in mice. Sci Rep 9, 13068, doi: 10.1038/s41598-019-49295-7 (2019). [DOI] [PMC free article] [PubMed] [Google Scholar]
- 41.Madisen L et al. A robust and high-throughput Cre reporting and characterization system for the whole mouse brain. Nat Neurosci 13, 133–140, doi: 10.1038/nn.2467 (2010). [DOI] [PMC free article] [PubMed] [Google Scholar]
- 42.Platt RJ et al. CRISPR-Cas9 knockin mice for genome editing and cancer modeling. Cell 159, 440–455, doi: 10.1016/j.cell.2014.09.014 (2014). [DOI] [PMC free article] [PubMed] [Google Scholar]
- 43.Xu Y et al. Identification of a neurocircuit underlying regulation of feeding by stress-related emotional responses. Nat Commun 10, 3446, doi: 10.1038/s41467-019-11399-z (2019). [DOI] [PMC free article] [PubMed] [Google Scholar]
- 44.Frontini A et al. Leptin-dependent STAT3 phosphorylation in postnatal mouse hypothalamus. Brain research 1215, 105–115, doi: 10.1016/j.brainres.2008.03.078 (2008). [DOI] [PubMed] [Google Scholar]
Associated Data
This section collects any data citations, data availability statements, or supplementary materials included in this article.
Supplementary Materials
Detailed statistics information for comparisons in all Figures.
Statistical Source Data
Statistical Source Data
Statistical Source Data
Statistical Source Data
Statistical Source Data
Statistical Source Data
Statistical Source Data
Statistical Source Data
Statistical Source Data
Statistical Source Data
Statistical Source Data
Statistical Source Data
Statistical Source Data
Statistical Source Data
Statistical Source Data
Statistical Source Data
Data Availability Statement
The data that support the findings of this study are available from the corresponding author upon request.


