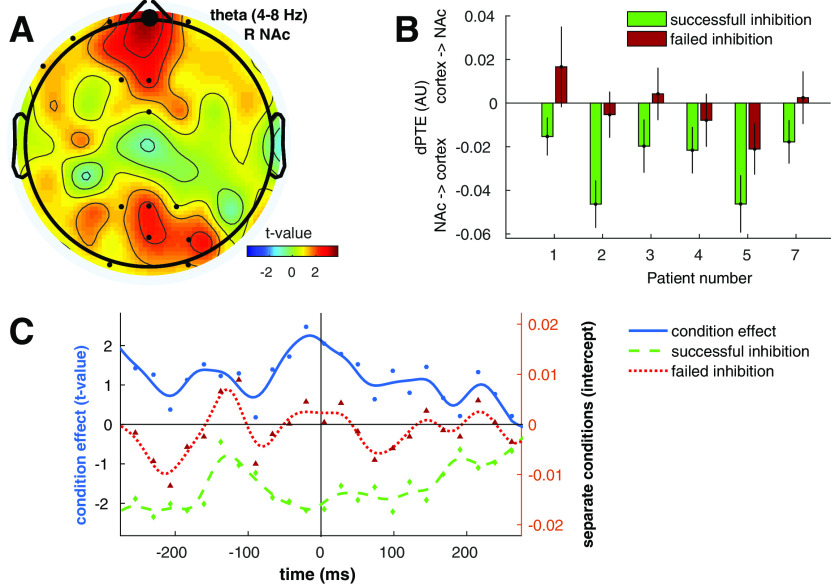
Figure 2.
Effect of inhibition success on dPTE between right NAc and scalp electrodes. A, dPTE between right NAc and EEG electrode Fpz (large dot) showed a condition effect in the θ-band on successful versus failed inhibition trials (−550−550 ms relative to stop stimulus onset). LMM t values are plotted with small dots indicating tested channels. B, Mean dPTE (arbitrary units, centered) for conditions and patients separately. Positive and negative values indicate cortex→NAc and NAc→cortex information flow, respectively. Error bars indicate SEM. C, Post hoc sliding window analysis showed the effect was highest just before stop stimulus onset (time = 0). Condition effect t values (solid line) were smoothed and plotted on the left y-axis, whereas the right y-axis reflects centered smoothed dPTE intercepts (dashed lines) for the separate conditions, with negative values again indicating effective connectivity from the NAc toward the cortex and vice versa. Since dPTE was calculated for a sliding window, with each dot representing 500 ms, the approximately −290−290 ms shown on the x-axis represents the entire −550- to 550-ms trial length.

