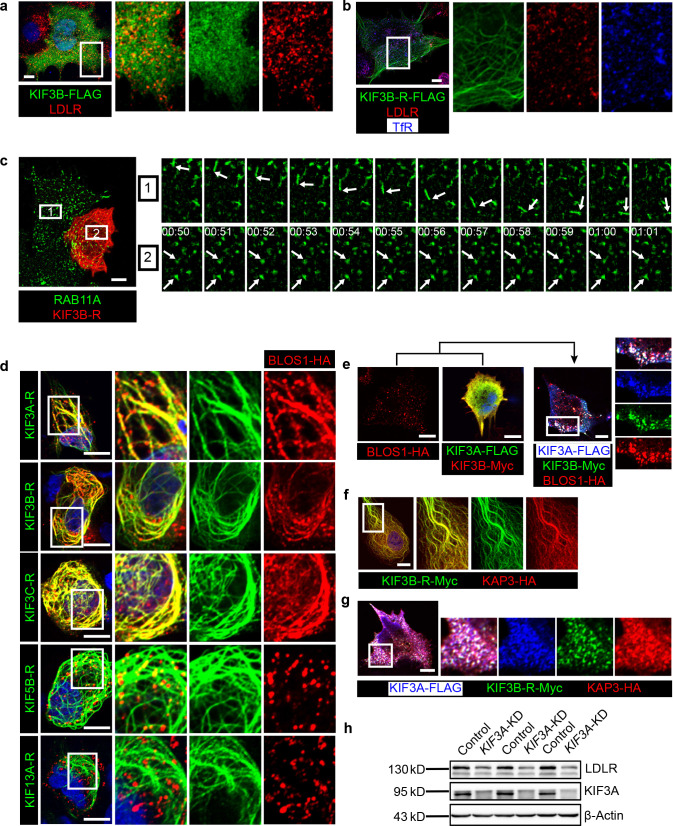
Figure 5. BLOS1 acts as an adaptor protein of KIF3 complex in the regulation of RE anterograde transport.
(a) Immunofluorescence staining of LDLR in KIF3B-FLAG expressing Hep G2 cells. Merged and single labeling images of magnified insets of boxed areas are shown on right. (b) Puncta distribution of LDLR and TfR in KIF3B-R expressing Hep G2 cells. Merged and single labeling images of magnified insets of boxed area are shown on right. (c) Confocal live-cell microscopy of RAB11A-GFP labeled recycling endosomes in KIF3B-R expressing and non-transfected Hep G2 cells. Magnified insets (of box 1 and 2 in the same time points) of consecutive time-lapse images (image/1 s) showed that recycling endosomes in control cells had active motion, while this movement was impaired in KIF3B-R expressing cells (see Figure 5—video 1). White arrows indicate representative recycling endosomes in control and KIF3B-R-expressing cells. Time stamps are in the format of minutes: seconds. (d) Retention of BLOS1 on microtubules caused by co-expressed KIF3A, KIF3B and KIF3C rigor mutants, but not KIF5B or KIF13A rigor mutants in Hep G2 cells. Merged and single labeling images of magnified insets of boxed areas are shown on right. (e) Co-expression of BLOS1 with both KIF3A and KIF3B redistributed KIF3A/B to BLOS1-positive puncta in Hep G2 cells. Merged and single labeling images of magnified insets of boxed area are shown on right. (f, g) Similar retention of KAP3 on microtubules caused by KIF3B-R (f) and redistribution of KIF3A/B resulting from the co-expression of KAP3 (g) in Hep G2 cells. Merged and single labeling images of magnified insets of boxed area are shown on right. (h) Immunoblot of LDLR in KIF3A stable knockdown Hep G2 cells (KIF3A-KD cells). Scale bars in all pictures, 10 μm. See also Figure 5—video 1 and 2, Figure 5—source data 1.

