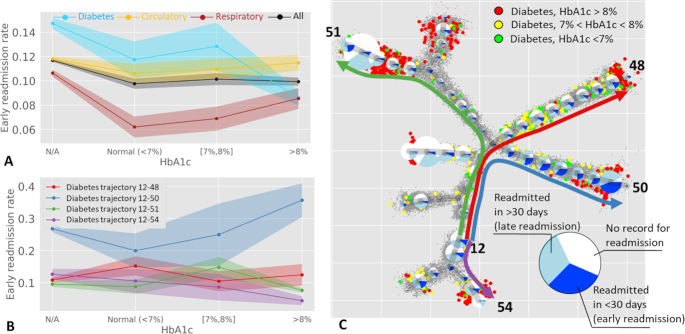
Figure 8.
Relation between early readmission and measured glycated hemoglobin HbA1c. A, Global frequencies of early readmission (in <30 days) as a function of HbA1c measure. B, Frequencies of early readmission along 4 representative trajectories (shown in C), computed only for the patients with diabetes as primary diagnosis. Standard deviation interval is shown by shaded area for each curve in A and B. C, Pie charts show readmission frequencies along the clinical trajectories. The size of the pie charts reflects the number of patients with diabetes as primary diagnosis associated with each node of the principal tree. Bigger color data points show patients with diabetes as primary diagnosis, with known measured level of HbA1c (normal in green, medium in yellow, and high in red). Note that more severe cases of diabetes confirmed by HbA1c tend to be at the end of the clinical trajectories. The colors of the trajectories in C match those in the plots in B.

