

Abstract
Lipid membranes are ubiquitous biological organizers, required for structural and functional compartmentalization of the cell and sub-cellular organelles. Membranes in living cells are compositionally complex, comprising hundreds of dynamically regulated, distinct lipid species. Cellular physiology requires tight regulation of these lipidomic profiles to achieve proper membrane functionality. While some general features of tissue- and organelle-specific lipid complements have been identified, less is known about detailed lipidomic variations caused by cell-intrinsic or extrinsic factors. Here, we use shotgun lipidomics to report detailed, comprehensive lipidomes of a variety of cultured and primary mammalian membrane preparations to identify trends and sources of variation. Unbiased principle component analysis (PCA) shows clear separation between cultured and primary cells, with primary erythrocytes, synaptic membranes, and other mammalian tissue lipidomes sharply diverging from all cultured cell lines and also from one other. Most broadly, cultured cell membrane preparations were distinguished by their paucity of polyunsaturated lipids. Cultured mammalian cell lines were comparatively similar to one another, although we detected clear, highly reproducible lipidomic signatures of individual cell lines and plasma membrane (PM) isolations thereof. These measurements begin to establish a comprehensive lipidomic atlas of mammalian cells and tissues, identifying some major sources of variation. These observations will allow investigation of the regulation and functional significance of mammalian lipidomes in various contexts.
Keywords: membrane composition, lipidomics, culture, fatty acid, unsaturation, plasma membrane, cholesterol
Graphical Abstract
Introduction
Cellular membranes (CMs) are comprised of lipid mixtures whose complexity and diversity are becoming appreciated through the development of technologies for comprehensive lipidomics. While the identity and quantity of broad lipid classes (e.g. glycerolipids defined by hydrophilic headgroup) have been accessible for decades, mammalian membranes comprise hundreds of unique phospholipid species specified by the length, unsaturation, and linkage of their hydrophobic chains. While a small number of these individual species have very specific signaling roles, the purpose of this vast lipid complexity remains poorly understood. Importantly, the overall composition of a given membrane determines various functional physical properties, which have essential roles in various cellular functions1–3.
Lipidomic profiles differ notably across various tissues4,5, as well as across intracellular membranes6,7. One of the most striking examples is that mammalian neuronal membranes are rich in polyunsaturated acyl chains8,9, many of them bearing omega-3 acyl chains that cannot be synthesized de novo by mammalian cells. The overall composition of any given cell membrane results from the interplay of many parallel pathways including lipid synthesis, degradation, and trafficking. These pathways depend to a large extent on the abundance and composition of raw materials required for lipid synthesis, most notably fatty acids, many of which are not produced de novo, but rather consumed as part of the diet10. Each of these mechanisms is regulated in time and space, with intricate feedback between them. For example, we recently observed that supplementing cells with polyunsaturated fatty acids leads to wholesale remodeling of membrane lipidomes with important consequences on cellular phenotypes2,3. Given these many layers of complexity, we are only scratching the surface of understanding the details of lipidomic regulation, while meaningful predictions about lipidome dynamics are practically impossible with the current state of knowledge.
To begin to quantitatively survey the sources of contrast and variation across mammalian lipidomes, we have used electrospray ionization tandem mass spectrometry (ESI-MS/MS) to quantify lipid complements of various mammalian membrane samples11. Here, we investigated lipidomic variation across cultured cell types, membrane preparations, and culture conditions. We find that membranes in vivo are clearly distinct from cultured cells, but also that individual cell types possess unique and stable lipidomic features. These features are dependent on the specific protocols used for membrane preparations, with isolated PMs being clearly distinct from whole cell membranes, and even subtle distinctions between different whole membrane preps.
Results and Discussion
ESI-MS/MS, also called ‘shotgun lipidomics’, reports detailed, near-comprehensive lipidomes of complex samples without chromatographic separation12,13. With this technique, we measured 400–800 individual lipid species per sample, spanning in abundance from 0.001 mol% of the complete lipidome for minor phospholipids up to 40 mol% for cholesterol. We report measurements of two primary membrane isolations (human erythrocytes and rat synaptic membranes), three different mouse tissues (brain, liver, and heart), six different cultured cell types (CHO, HCC1806, HEK, hMSC, HMLE, MDCK, and RBL-2H3), and three different membrane extraction procedures (isolated PMs, whole cell membranes, and nuclear-free membranes). The manuscript is structured around several distinct comparisons: (i) different primary cell membrane isolations are compared to each other and to membranes from cultured cells; (ii) whole membrane preps are compared to isolated plasma membranes (PM); (iii) various cultured lines are compared to one another. Notable trends are observed across all comparisons, revealing cell-, tissue-, and preparation-specific lipidomes.
Lipidomes of primary cellular membranes are highly distinct from cultured cells
To simplify comparisons between these complex lipidomic datasets, we used an unbiased, dimensionality-reducing approach called principal component analysis (PCA) to compress the variation among all measured samples into two linearly uncorrelated dimensions (PC1 and PC2). Rather than focusing on absolute abundances of individual lipids, which can be noisy for inabundant species and likely not meaningful for functional membrane phenotypes, the input data used for PCA were collectives comprising many species into self-similar groups. Specifically, phospholipid headgroups (e.g. phosphatidylcholine or phosphatidylserine) and total lipid unsaturation (i.e. number of double bounds per molecule) were chosen to capture relevant lipid features. Any given lipid specie will thus belong to two different groups (defined by its headgroup and acyl chains), while groups are comprised of dozens of different species. For the analysis described in this section, cholesterol was not measured for all samples, therefore it was omitted from the calculations.
PCA performed on all measured samples yielded two components that together defined >40% of the lipidomic variation across the samples, with PC1 comprising 31% of that variance (Fig. 1A). The most notable segregation observed in this dataset was primary isolates (e.g. erythrocytes, synaptosomes, and primary tissues) from cultured cell lines. Surprisingly, all lipidomes from cultured cell preparations, including those of isolated PMs (open symbols), clustered together and away from erythrocytes (e.g. RBCs), synaptosomes, and whole tissues (Fig. 1A). This observation indicates that lipidomes of freshly isolated membranes are highly distinct from those of cultured cells. The possible causes of this effect are discussed below.
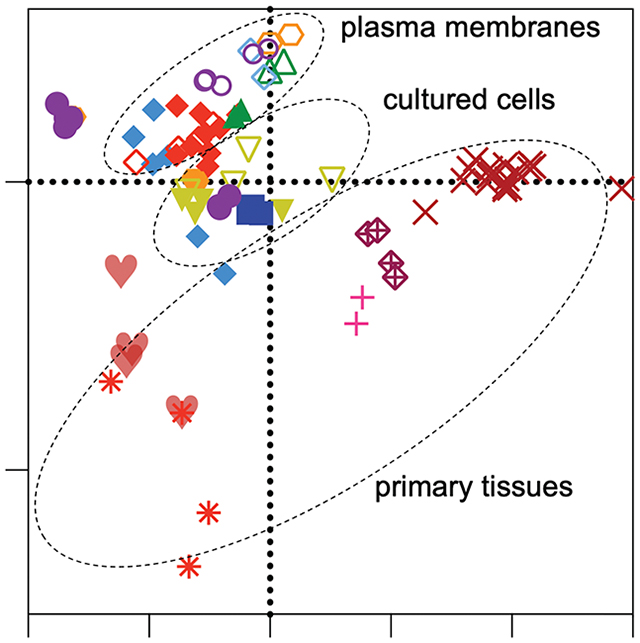
Figure 1-. Membrane lipidomes in vivo are distinct from cultured membranes.
(A) PCA of all lipidomes reveals clustering of all cultured cell preparations, including isolated PMs, away from the five primary membrane isolations (i.e. synaptosomes, RBCs, brain, liver, and heart). (B) Loadings plot for the PCA plot. (C) Lipid unsaturation and (D) headgroup profiles of primary tissue samples and whole membrane preparations of cultured cells. Bars represent means ± SD for 2–6 samples per condition. Abbreviations: PM – Plasma Membrane; CM – Cellular Membranes; DB – double bond. All lipidomic raw data is included as a Supplemental File.
PCA reports not only the clustering between samples, but also defines the variables that comprise the principal components, denoted as PCA ‘loadings’ (Fig. 1B). For example, samples on the right side of Fig. 1A (high in PC1) are distinguished by being rich in sphingomyelin (SM), phosphatidylserine (PS), and lipids with 4 or more double bounds (DB 4+) (i.e. loadings on the right side of Fig. 1B) and poor in plasmenyl phosphatidylcholine (PCp, also called PC plasmalogen) headgroups and lipids containing one or two double bonds (DB1 or DB2) (i.e. left side of Fig. 1B). These loadings can provide specific insights into the lipidomic features that segregate the various preparations. Specifically, primary cells (RBCs and synaptosomes) and tissues were highest in PC1 and lower in PC2 than the cultured cells. Consistently, primary membranes had more than double the abundance of highly unsaturated phospholipids compared to most cultured cell preparations (Fig. 1C, pink bars). In contrast, mono- and di-unsaturated lipids (1–2 double bonds per lipid) were highly abundant in all cultured cell samples (Fig. 1C, orange and green bars). These differences in lipid acyl chains were the most notable segregating features of this dataset; however, there were also consistent headgroup differences. Primary samples were all relatively poor in PCp (Fig. 1D, pink)14. Also, while RBCs are enriched in sphingolipids (SL), synaptosomes and livers were relatively depleted (Fig. 1D, light blue).
The unnatural fatty acid profiles of lipids from cultured cells have been recently highlighted15, and our observations are fully consistent with those reports. All primary membrane preparations were rich in polyunsaturated lipids, while all cultured cells seemed to replace these lipids with mono- or di-unsaturated versions. Previous work has implicated the low abundance of fatty acids (FAs), and particularly polyunsaturated FAs (PUFAs), in standard culture media, as the driver of the unnatural composition of cultured cell lipids. Our work extends these observations by defining the specific lipid species that are mis-represented in cultured cells. Ultimately, it will be interesting to definitively determine the effects of in vitro conditions by following the course of lipidomic remodeling after isolation and long-term culture of primary cells. It is likely that many cellular behaviors are affected by the unnatural membrane lipidomes produced by culture conditions, and it may be useful to develop media formulations that more closely recapitulate in vivo lipidomes.
PM preparations are defined by higher cholesterol, sphingolipids, and more saturated lipids
The distinct protein and lipid complements of various organellar membranes and the trafficking mechanisms responsible for maintaining them have been the focus of extensive research in cell biology7,16. Many important insights have been gleaned from isolation protocols designed to enrich the membranes of specific sub-compartments, including the endoplasmic reticulum (as microsomes), sorting intermediates between compartments13,17, plasma membranes18, and endocytic organelles19,20. Although there are widely recognized trends defining membrane compositions of various organelles6, these have rarely been evaluated comprehensively and systematically across cell types.
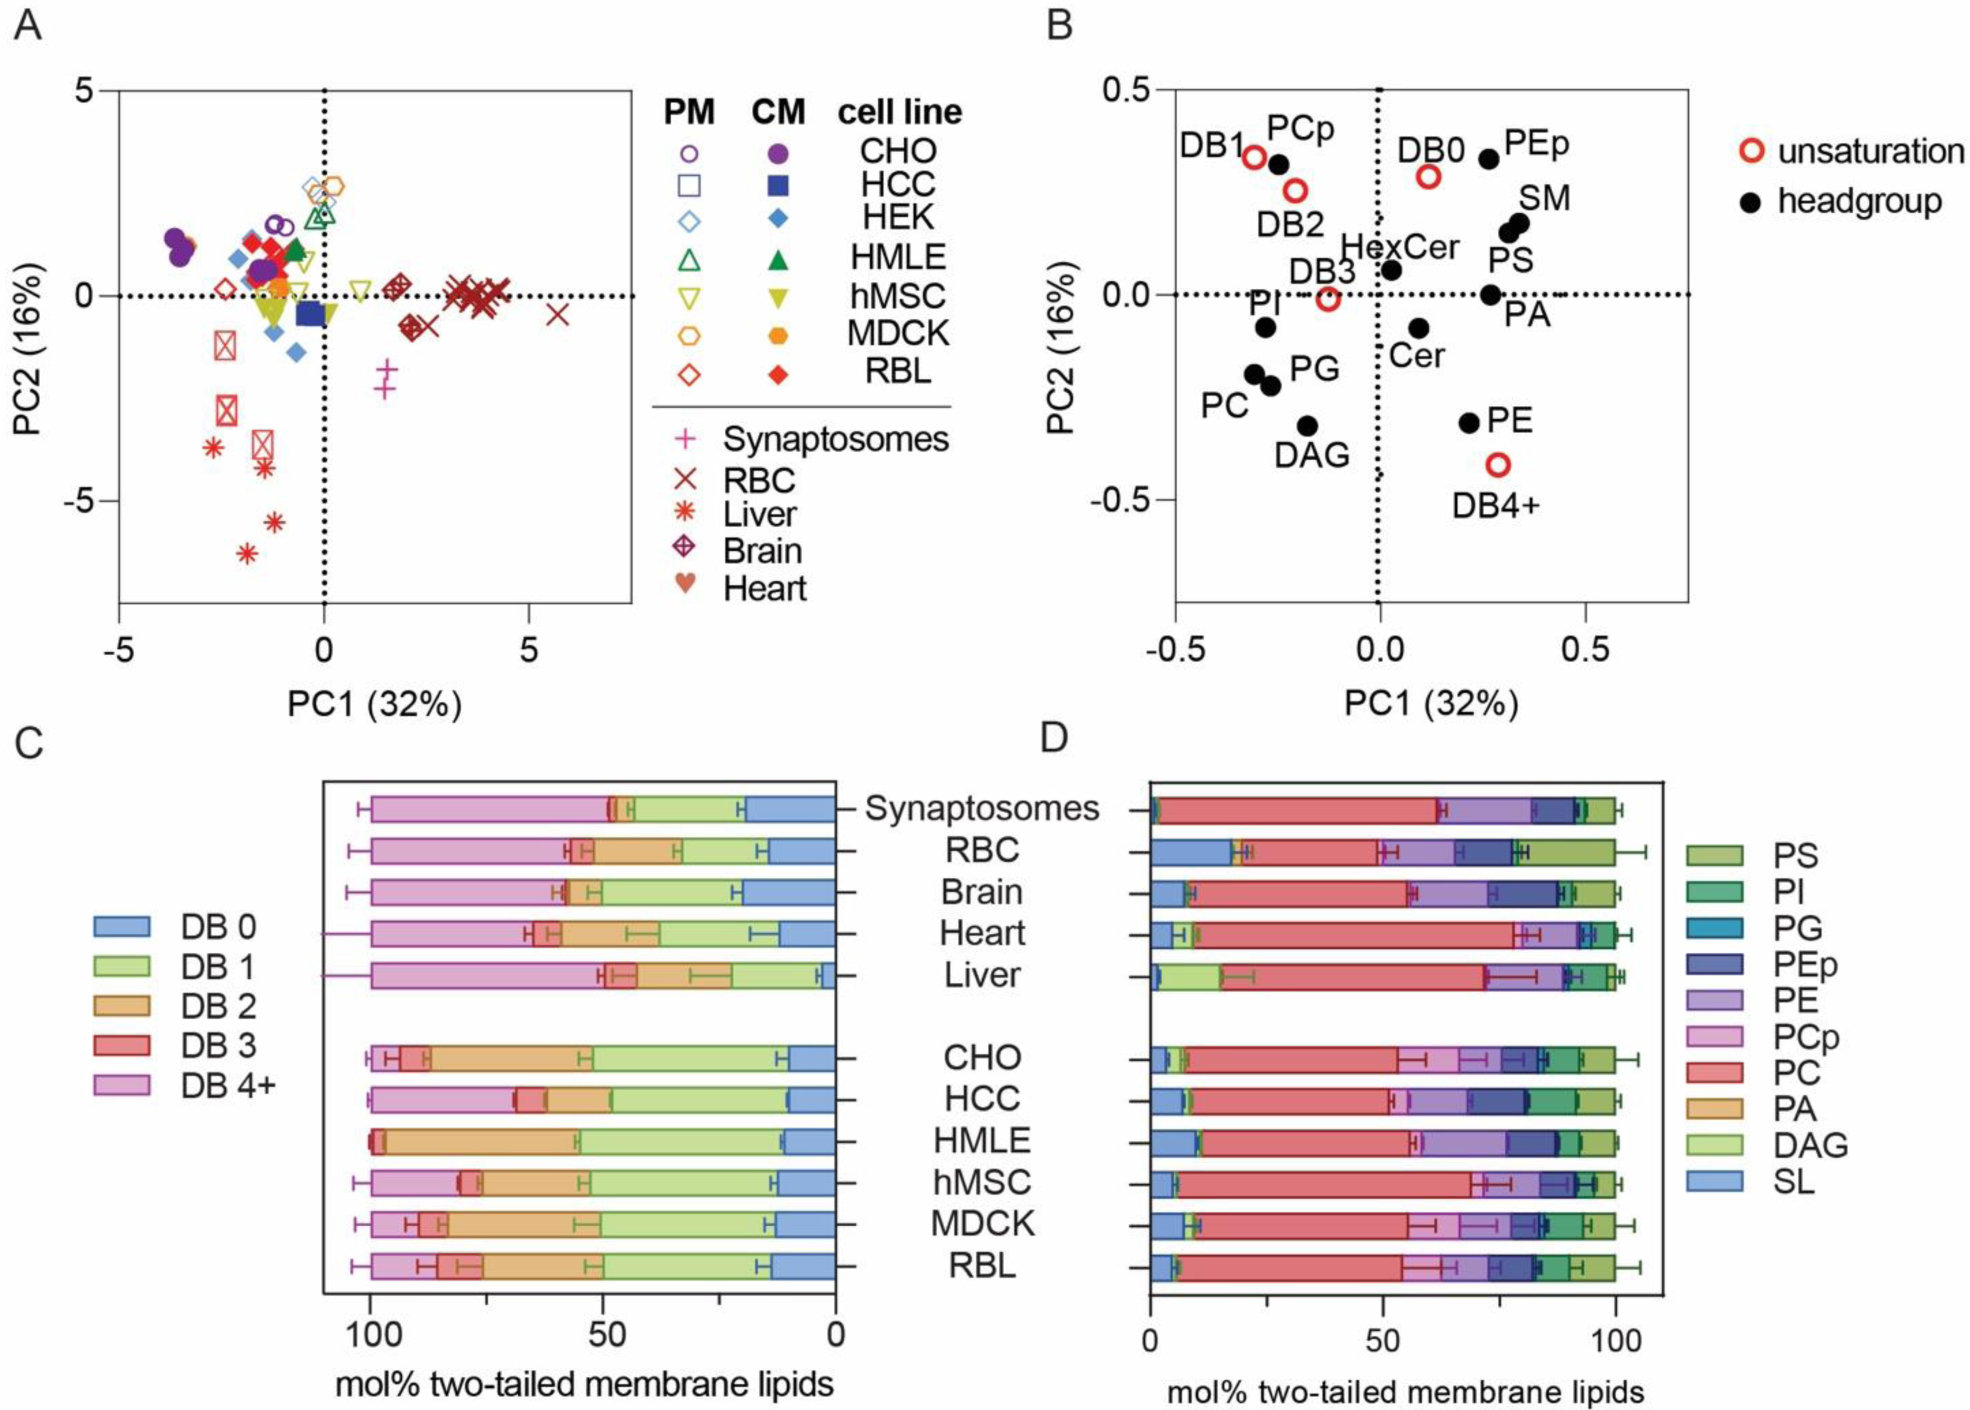
In this section, we restrict our analysis to cultured cell types and compare isolated PM lipidomes to two different “total” cellular membrane (CM) preparations: nuclei-free (NF) membranes and whole cell (WC) membranes. PMs are expected to possesses unique lipidomic profiles compared to other membrane-bound organelles, with enrichment of cholesterol and sphingolipids being a defining feature of the mammalian plasma membrane7. To investigate these and other lipid features differentially expressed between PMs and other cell membranes, we performed PCA analysis on all cultured cell preparations. PMs were isolated as Giant Plasma Membrane Vesicles (GPMVs)21 from six different cell lines and compared to two different types of whole membrane preparations: (1) whole cells (WC) and (2) nucleus-free (NF) membrane preparations (see methods for details). The loading variables for PCA were as above (molar fractions of various unsaturations and phospholipid headgroups) but also included abundance of cholesterol.
We observed clear clustering within repeats for a given cell type and preparation, which reinforces the high repeatability of the lipidomics analyses and validates the PCA approach (Fig 2A). The clearest segregation in this dataset was between isolated PMs and the whole cell membrane (CM) preps, with all PM samples trending toward the upper right quadrant of Figure 2A, with positive PC1 and PC2 values and vice versa for CM. High PC1/PC2 values corresponded to more abundant cholesterol, SM, PS, and PE plasmalogens (PEp) and fewer acyl chain unsaturations (Fig 2B), all features consistent with expectations for PMs6,22. Accordingly, cholesterol (Fig 2C), SM, and PEp were generally enriched in PM versus crude membrane preparations within any given cell type (Fig 2E–F). Similarly, lipid unsaturation quantified by unsaturation index (concentration-weighted average lipid unsaturation, see Methods) was generally lower in PMs compared to whole cell membrane preparations (Fig 2D). Conversely, phosphatidylyglcerol (PG) and phosphatidylinositol (PI) tended to be more abundant in crude membrane preparations (NF and WC) than in PMs (Fig 2H–J). PG is associated with mitochondria6 whereas PI tends to be found in the endoplasmic reticulum (ER)6, explaining their exclusion from PM preparations. Finally, some lipid features were lineage-specific: PS was quite enriched in PMs of HEK, CHO, and MDCK, but less so for other lines (Fig 2K–G), suggesting differences in the abundance or efficiencies of machineries for enriching certain lipids in the PM23,24.
Figure 2 -. Isolated PMs have distinct lipidomes from crude membrane preparations.
(A) PCA of lipidomes from cultured cell preparations reveals that isolated PMs were consistently distinct from cellular membrane (CM) extractions. (B) Loadings plot for the PCA scores suggests that PMs are generally characterized by higher cholesterol, SM, PS, and fully saturated or monounsaturated lipids. (C) Cholesterol is generally enriched in PMs compared to cellular membranes, (D) unsaturation indices compared between PM, NF (nuclei-free crude membranes), and WC (whole cell membranes) for various cell types, (E-F) PEp and SM are enriched in PMs relative to either whole membrane preparation, (G-I) PG, PCp, and PI are enriched in whole membrane preparations, (J-L) PS, PE, and PC enrichments in PM versus CM/WC were variable between cell types. Bars represent means ± SD. Symbols represent independent preparations.
Distinctions between PMs and crude membranes are cell type specific
While the striking differences between PM and crude membrane lipidomes were generally observed across cell types, there was one notable exception for the rat basophilic leukemia (RBL) cell line where there were few statistically significant differences in lipid features between whole cell and PM preparations (Fig 2, red). We propose two non-exclusive explanations: (i) PM isolation may be less efficient for RBL cells, and/or (ii) RBLs may have a relatively high PM-to-internal membrane ratio, such that crude membranes are more similar to PMs.
There are two important caveats to these comparisons of PM versus CM preparations. First, several lipid classes are not analyzed in our lipidomics pipeline that are also likely enriched in PMs. These include complex glycosphingolipids and phosphorylated phosphatidylinositols, which are both poorly amenable to high-throughput shotgun lipidomics because they are relatively low abundance and inefficiently extracted using protocol optimized for more common polar lipids. Second, the PMs here are isolated as GPMVs, which may have important differences to PMs of living cells. There are several available protocols for isolating GPMVs18,25,26 and we intentionally chose to induce vesiculation using N-ethylmaleimide (NEM), a sulfhydryl-alkylating agent that is not known to react with any lipid moieties. Nevertheless, it is likely that some lipidome remodeling occurs in cells during GPMVs isolation. On the other hand, the lipidomic profiles reported (e.g. high cholesterol and sphingomyelin, low PG) here are supportive of a highly PM enriched preparation. Moreover, it was previously shown that PM-resident proteins are enriched in GPMVs while resident proteins of other subcellular organelles (e.g. endoplasmic reticulum, mitochondria, Golgi, etc) are highly depleted2,27. Thus, despite important caveats, we believe that GPMVs are an effective PM preparation.
Differences between crude membrane isolation protocols
Expected observations of robust differences between lipidomes of isolated PMs and crude membrane preparations confirm the efficiency of PM preparation and the utility of lipidomic analysis for defining the compositions of specific organellar membranes. However, we also encountered unexpected variation between “crude” membrane extraction protocols. Specifically, total cell membranes derived by scraping and extracting whole cells (WC) had somewhat distinct lipidomes from cellular membranes isolated by first removing nuclei from cellular homogenates, then pelleting the remaining, nuclei-free (NF) membranes from the post-nuclear supernatant (see Fig 2D–G). In general, features of NF lipidomes were intermediate between isolated PMs and WC, suggesting that removal of nuclei also depletes meaningful amounts of nuclei-associated membranes, which likely represent a significant fraction of the ER and perhaps other intracellular membranes. This observation highlights that caution must be taken when evaluating even “crude” lipidome preparations, as seemingly minor variations in protocols can lead to significant, and cell type-specific, differences in the outcomes.
Robust differences between whole cell lipidomes of cultured cell lines
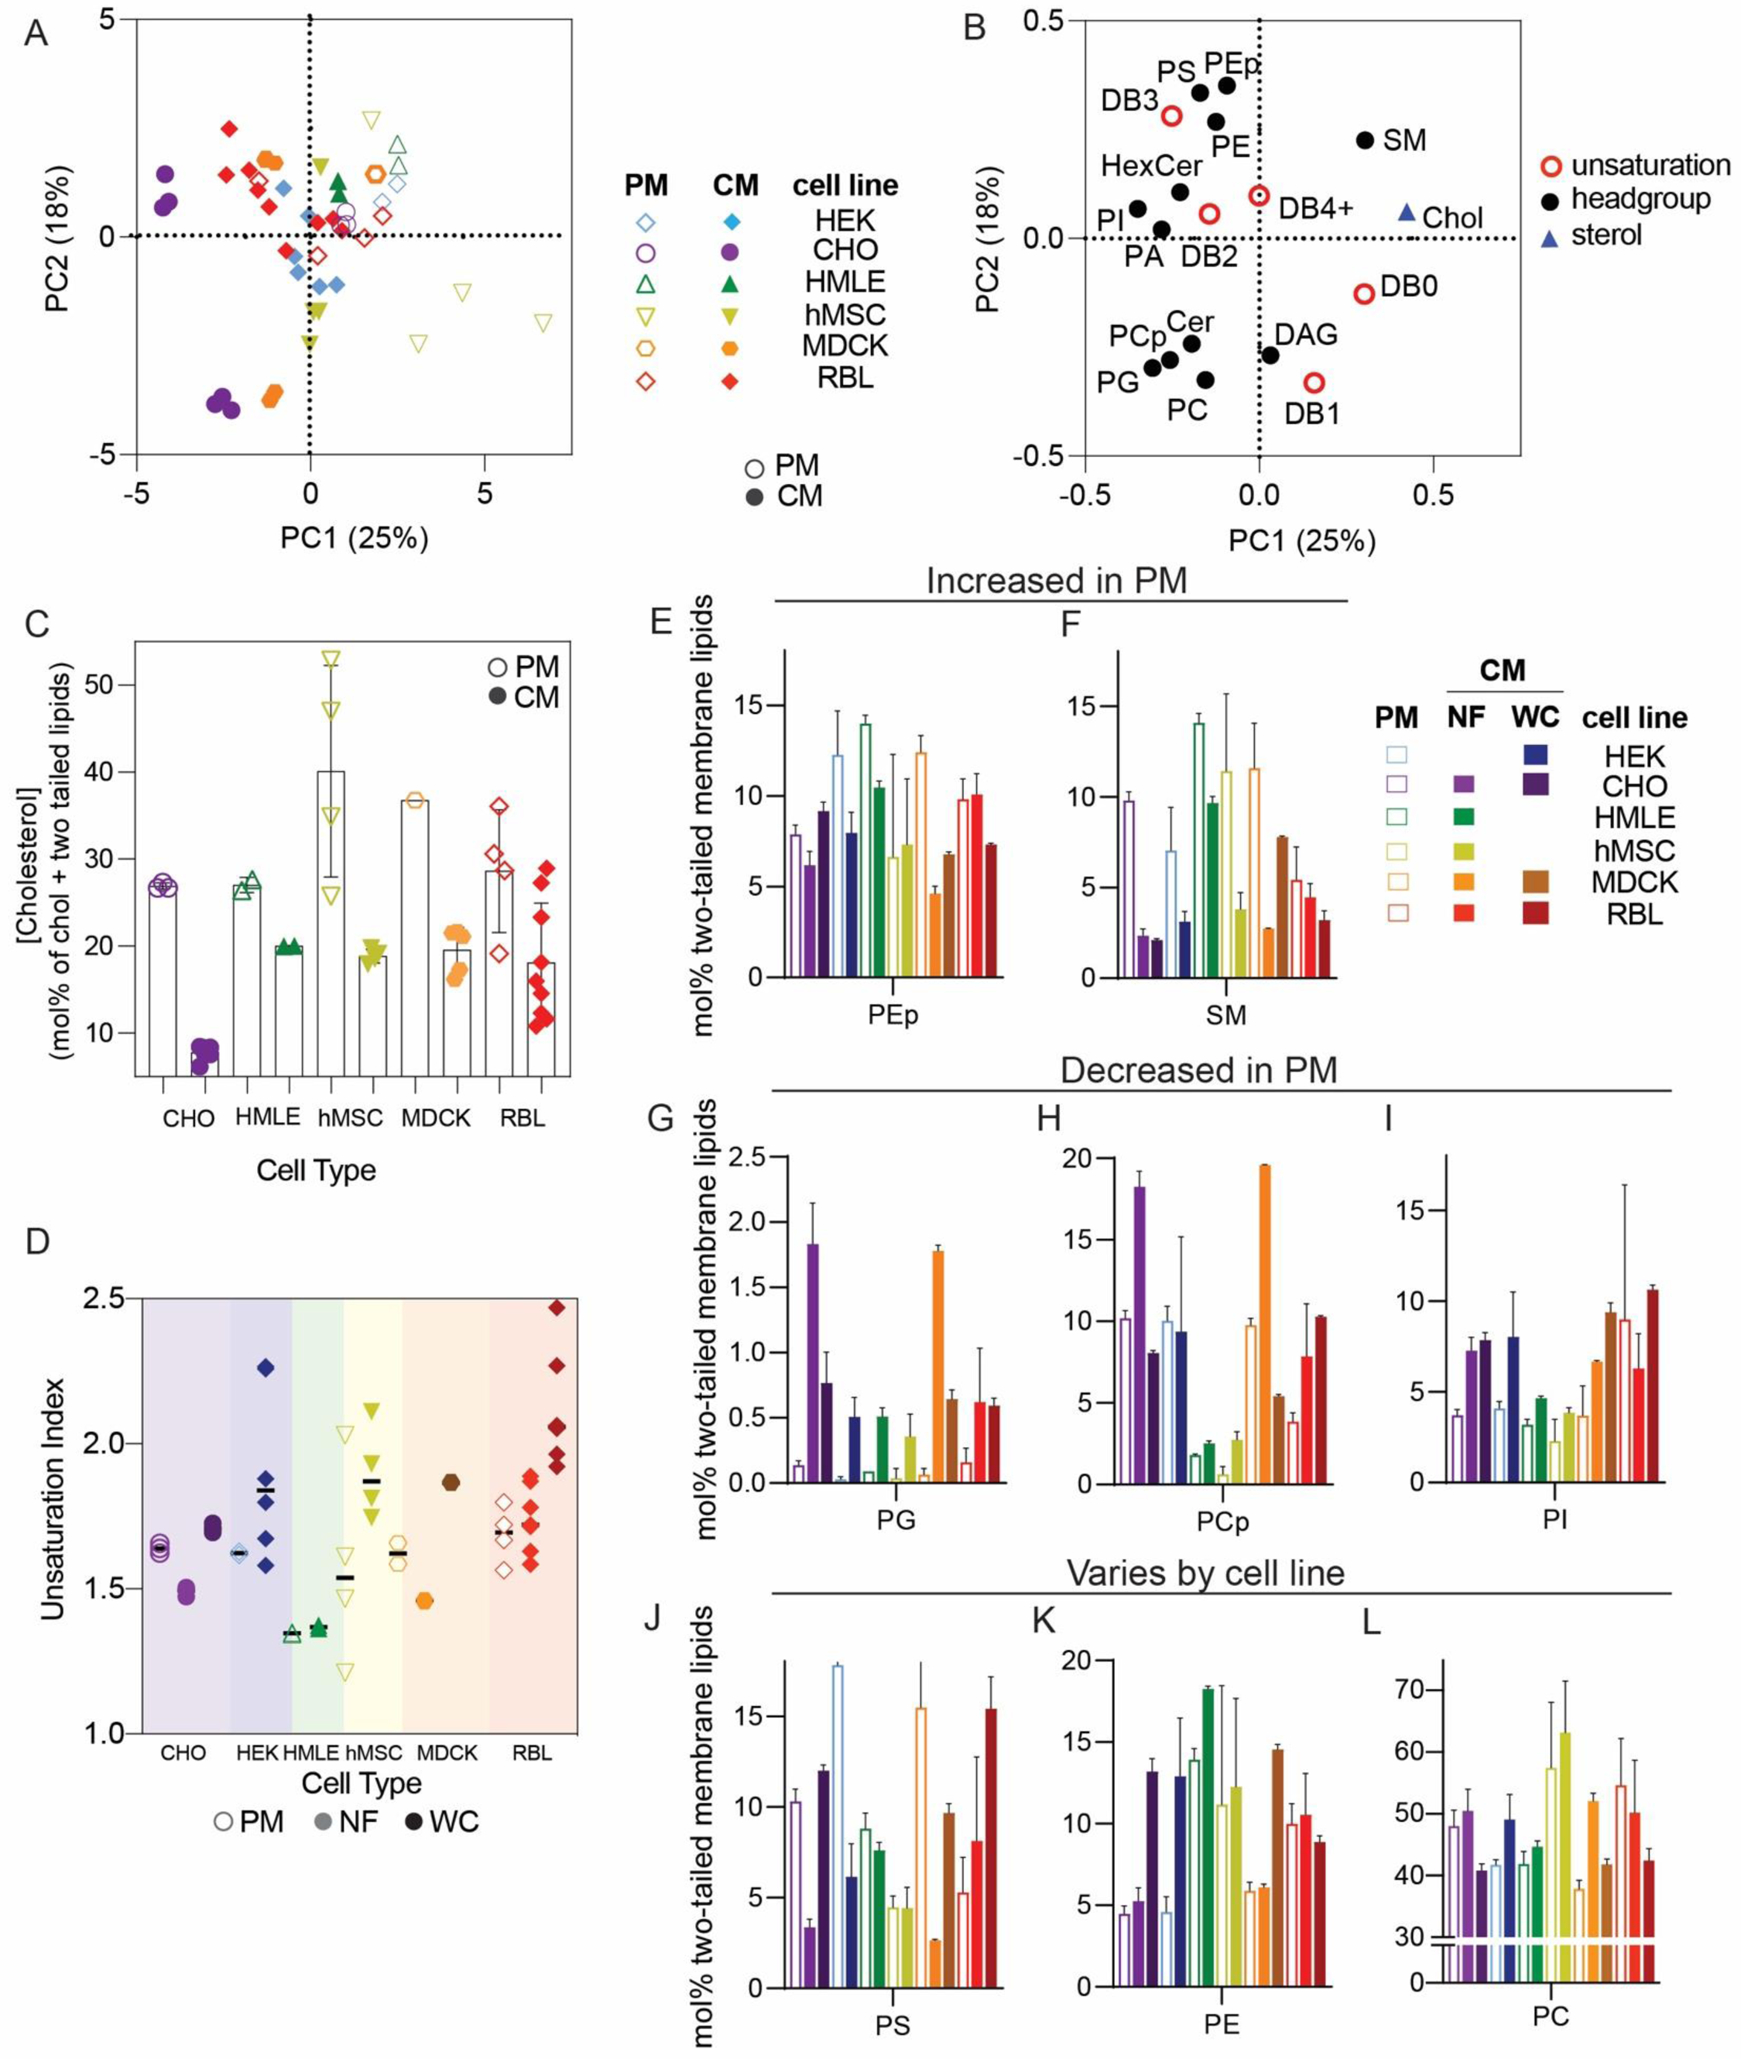
It has been widely demonstrated that various animal tissues have distinct lipidomic profiles5,28; however, there have been few systematic comparisons between various lineages of cultured cells. In this section, we compare crude and PM lipidomes from five unrelated cultured cell lines. In PCA of whole cell (WC) membrane lipidomes, we generally observed tight clusters representing repeats of specific cell types that were well separated from any other cell types (Fig. 3A). Put another way, while certain cell types showed similarities to one another (e.g. CHO and RBL), individual cell lineages usually had distinct lipidomic profiles, with sample-to-sample variation smaller than the differences between most cell types. An exception were HEKs, which showed significant sample-to-sample variability, the possible sources of which are discussed below.
Figure 3 -. Isolated PMs have distinct lipidomes from crude membrane preparations.
(A) PCA of whole cell (WC) membrane lipidomes shows separation between cultured cell types. (B) Loadings plot for PCA. (C) Variation in SL and PS abundances between cell types. (D) Variations in lipid unsaturation levels between cell types. (E) PCA of lipidomes from PM preparations shows clear separation between various cultured cell types. PM lipids from different cultured cells vary in both (F) headgroup distribution and (G) unsaturation of lipid acyl chains. (H) PCA of lipidomes from nuclei-free (NF) preparations from various cultured cells shows significant variation between cell types but also significant variation within certain cell types. (I-J) Serum effects on HEK and RBL WC lipids are minimal as shown in little change in headgroup (I) or acyl chain unsaturation (J) distributions. Bars represent means ± SD. Symbols represent individual preparations.
Although there were numerous characteristic features of particular cell types, notable examples include high SL levels in MDCKs and enrichment of PS in RBL and CHO cells (Fig. 3C). Additionally, MDCK cells contained substantially more di-unsaturated lipids while also having less fully saturated lipids, whereas HEKs were distinguishable by high monounsaturated lipid levels. These observations emphasize that despite in vitro conditions producing major impacts on the lipidomes of cultured cells in general (see Fig. 1), notable and significant lipidomic differences persist between various cultured cell lineages. A potential intrinsic source of lipidomic variation that has not been investigated here is the degree of polarization that can occur in epithelial-derived cells like MDCKs. Profound polarization-driven changes in MDCK lipidomes have been previously reported in whole cells12. However, the MDCK cells used here were not polarized, because they were grown to sub-confluence on plastic dishes (rather than confluent on porous filters).
PM lipidomes are cell-type specific
PCA analysis of isolated PMs from five different cell lines generally led to similar cell type-specific clustering as for whole membranes (Fig. 3E). For example, RBL PMs were poorer in SLs than MDCK, HMLE, and CHO cells. MDCK and HEK PMs were also rich in PS lipids, which were nearly absent from MSC and RBL PMs (Fig. 3F). MSC PMs were notably rich in fully saturated and PUFA-containing lipids at the expense of di-unsaturated lipids, while HMLE PMs had essentially no PUFA-containing lipids (Fig. 3G). These observations demonstrate notable intrinsic differences within PMs of different cultured cell lineages. It will be particularly interesting to investigate such features in polarized cells that present distinct PM domains, as for epithelial (apical-basolateral) or neuronal (axonal-somatodendritic) cells. While apical PM lipidomes have been reported in MDCKs29, there has yet been no direct comparison to basolateral PMs. The data presented here represent a snapshot of unpolarized MDCK PMs.
Nuclear extraction contributes to lipidomic variability
NF preparations occasionally showed significant variability between biological replicates (Fig 3H). Most notably, NFs from RBL cells varied almost as much as all other cell types combined, practically defining their own principal component. These samples were produced several years apart by different researchers, leading us to hypothesize several possible causes for this variability: (1) drifts of lipid metabolism in cells over culture time; (2) the dependence of lipidome on culture conditions, including cell cycle, variations in confluency, timing of medium change prior to isolation, and/or specific medium formulations; (3) subtle differences in preparations, most likely different homogenization efficiency, leading to variations in removal of nuclei-associated membranes; (4) different serum lots, which may contribute different lipid sources for cells in culture. The relevance of some of these features is supported by previous reports implicating cell cycle, serum concentrations, and confluency as determinants of PM biophysical properties30,31, which have been previously related to lipidomic remodeling2,27,32. The lipidomic consequences of these variables have not been extensively explored; however, we investigated the influence of serum lots on lipidomic variation in WCs prepared from two cell lines (RBL and HEK). We observed no notable effects on most lipidomic characteristics (Fig. 3I–J), suggesting that inter-lot serum variation does not have a major effect on whole cell lipidomes. An important caveat to this analysis is that the two serum lots used could have contained similar lipoprotein and/or fatty acid profiles. We did not systematically investigate the other possibilities but hypothesize that these may yield major lipidomic variability and should be considered for future studies.
Conclusions
The major conclusions from these observations are that membrane lipidomes are highly diverse between samples but potentially quite stable within them. That is, each cell type appears to possess a unique lipidomic fingerprint that can be reproducibly observed upon repeated measurement. However, differences between cell types are smaller than differences between organellar membranes within a given cell, with PMs from any given cell type being highly distinct from whole cells. Other organellar membranes likely have their own unique lipidomes, thus care must be taken when interpreting lipidomic data from specific membrane isolations, as even subtle variations in efficiency are likely to produce significant variability. Finally, and most importantly, the most notable trend in our dataset was that membranes from cultured cells differ dramatically from primary samples, suggesting that culture conditions strongly impact membrane compositions. This observation reveals the need for standardization and optimization of conditions to more accurately recapitulate in vivo relevant lipidomes.
Methods
Cell Culture Conditions
Unless stated otherwise, all cells were grown at 37°C under humidified 5% CO2 conditions.
CHO: Chinese hamster ovary (CHO) cells, kindly provided by Anne Robinson (Carnegie Mellon University), were maintained in DMEM:F12 (Dulbecco’s Modified Eagle Medium: Nutrient Mixture F-12) containing 5% fetal bovine serum (FBS), 100 units/mL penicillin, and 100 μg/mL streptomycin. HCC1806: HCC1806 were obtained from American Type Culture Collection (Manassas, VA, USA). HCC1806 cells were cultured in RPMI-1640 medium supplemented with heat-inactivated 10% fetal bovine serum. HEK: Human embryonic kidney (HEK) cells were maintained in medium containing 90% Eagle’s minimum essential medium (EMEM), 10% fetal calf serum, 100 units/mL penicillin, and 100 μg/mL streptomycin. HMLE: HMLE cells were grown in a 1:1 ratio of DMEM:F12 and Mammary Epithelial Cell Growth Medium (MEGM) Bullet Kit (Lonza) with 100 units/mL penicillin, and 100 μg/mL streptomycin. hMSC: Human adult bone marrow MSCs were obtained as a gift from M. Andreeff (MD Anderson). They were isolated by bone marrow aspirates from the iliac crest of normal, healthy volunteers after informed consent. Samples were acquired in accordance with the regulations and protocols approved by the Investigational Review Board of MD Anderson Cancer Center. Mononuclear cells were collected by gradient centrifugation and seeded at a density of 1 × 10⁵ cells/cm2 in growth medium containing minimum essential medium α, 20% heat-inactivated FBS, and 1% L-glutamine. Nonadherent cells were removed after 2 days. Medium was changed every 3 to 4 days thereafter. When the cells reached 70 to 80% confluence, adherent cells were trypsinized and expanded for 3 to 5 weeks. MSCs were checked for positivity of CD105, CD73, and CD90 and the lack of expression of CD45 and CD34. The purity of MSC preparation was >99%. Cells were maintained in growth medium containing Dulbecco’s modified Eagle’s medium with 1% L-glutamine, 10% FBS, and 1% penicillin-streptomycin and analyzed up to passage 6. MDCK: Madin-Darby canine kidney (MDCK) epithelial cells were grown in Dulbecco’s modified Eagle’s medium (DMEM) with 2 mM L-glutamine, and 10% FBS. RBL: Rat basophilic leukemia (RBL) cells were maintained in medium containing 60% Minimum Essential Medium (MEM), 30% RPMI, 10% fetal calf serum, 100 units/mL penicillin, and 100 μg/mL streptomycin.
Primary isolations:
Erythrocytes: RBCs were isolated from healthy donors with informed consent via the Institutional Biosafety Committee of the University of Texas Health Science Center, as described33. Synaptic membranes: Synaptosomes were prepared as described8. All animal protocols were in compliance with the National Institutes of Health Guide for Care and Use of Laboratory Animals and were approved by the Institutional Animal Care and Use Committee of the University of Texas Health Science Center. Briefly, subcellular fractions were obtained from rat brains by using a slight modification of published protocol34. Mixed-gender Sprague Dawley rats were fed standard chow (Harlan Tech, Indianapolis, IN) ad libitum and killed at P7. Forebrains were harvested within 30 s of decapitation and placed in ice-cold sucrose solution (0.5 mM 4-(2-hydroxyethyl)-1-piperazineethanesulfonic acid [HEPES], pH 7.4, 0.32 M sucrose, 1 mM MgCl2, 0.5 mM CaCl2, and 1 μg/ml leupeptin) followed by disruption with 12 strokes of a motor-driven glass/Teflon homogenizer at 900 rpm on ice. After clarification of the homogenate by centrifugation at 1400 × g for 10 min, the supernatant was centrifuged at 13,800 × g for 10 min, and the pellet was suspended in isotonic solution (0.5 mM HEPES, pH 7.4, 0.32 M sucrose, and 1 μg/ml leupeptin) with five strokes in a glass/Teflon homogenizer. The synaptosomal preparation was obtained by layering the suspended samples on discontinuous sucrose density gradient (0.8/1.0/1.4 M) and centrifuging at 110,000 × g for 2 h at 4°C. The synaptosomal fraction was recovered from the interface between the 1.0 and 1.4 M sucrose and either stored as frozen aliquots at −80°C for subsequent analysis. For lipidomics, membranes were isolated from synaptosomal preparations by hypotonic lysis. Specifically, 25 μg of protein (determined by bicinchoninic acid [BCA] assay) from synaptosomal preparations was diluted in 1 ml of H2O to lyse synaptosomes and then centrifuged at 60,000 × g for 2 h in 4°C to pellet the membranes, which were resuspended in 150 mM ammonium bicarbonate.
Tissue isolation
All experimental procedures using laboratory animals were approved by the Public Health Service and the Institutional Animal Care and Use Committee at Texas A&M University. Pathogen-free female C57BL/6 mice (n=8) weighing 16–18 g had free access to a corn oil-enriched diet (at 5 g/100 g) which was adequate in all nutrients 36. The basic diet composition, expressed as g/100 g was: casein, 20; sucrose, 42; cornstarch, 22; cellulose, 6; AIN-76 mineral mix, 3.5; AIN-76 vitamin mix, 1, DL-methionine, 0.3; choline chloride, 0.2; Tenox 20A, 0.1; and oil, 5. Mice were sacrificed by CO2 asphyxiation after two weeks of feeding the CO/FO diet, and the livers and hearts were frozen in liquid nitrogen. 20–50 mg of tissue was mechanically homogenized in Dulbecco’s PBS (without Ca2+ and Mg2+). Samples were further diluted to 5 mg/mL in Dulbecco’s PBS (without Ca2+ and Mg2+), and lipidomics analysis was performed as below.
Cell culture lipidome preparations
Whole cell membrane preparation:
For preparation of whole cell (WC) membranes, cells were trypsinized, washed two times with Dulbecco’s phosphate buffered saline (D-PBS), and 450,000 cells were resuspended in 300 μL D-PBS and frozen in liquid nitrogen for lipidomic analysis.
Nuclei-free (NF) membrane preparation:
For NF membrane preparations, cells washed with phosphate buffered saline (D-PBS), scraped in hypotonic buffer (10 mM Tris at pH 7.4), and then homogenized with a 27-gauge needle 15 times. Nuclei were then pelleted by centrifugation at 300 xg for 5 min. Membranes from the post-nuclear supernatant were sedimented by centrifugation at 100,000 xg for 1h at 4°C. The membrane pellet was then washed and resuspended in 150 mM ammonium bicarbonate.
PM preparation:
PMs were isolated as GPMVs, as described21. Briefly, cells were grown to 60–80% confluence and washed in GPMV buffer (10 mM HEPES, 150 mM NaCl, 2 mM CaCl2 , pH 7.4). PMs were prepared by treating cells with GPMV buffer supplemented with 2 mM N-ethylmaleimide (NEM) for 1 hour at 37°C. The supernatant containing GPMVs was collected and centrifuged at 4°C for 1 hour at 20,000 xg. The GPMV pellet was then resuspended in 100 μL 150 mM ammonium bicarbonate.
General Lipidomics
The details of the lipidomics workflow have been described in previous publications2,11,33.
Nomenclature:
The following lipid names and abbreviations are used: ceramide (Cer), cholesterol (Chol), sphingomyelin (SM), diacylglycerol (DAG), lactosyl ceramide (DiHexCer), glucosyl/galactosyl ceramide (HexCer), sterol ester (SE), and triacylglycerol (TAG), as well as phosphatidic acid (PA), phosphatidylcholine (PC), phosphatidylethanolamine (PE), phosphatidylglycerol (PG), and phosphatidylinositol (PI), phosphatidylserine (PS), and their respective lysospecies (lysoPA, lysoPC, lysoPE, lysoPI, and lysoPS) and ether derivatives (PC O-, PE O-, LPC O-, and LPE O-). Lipid species were annotated according to their molecular composition as follows: [lipid class]-[sum of carbon atoms in the FAs]:[sum of double bonds in the FAs];[sum of hydroxyl groups in the long chain base and the FA moiety] (e.g., SM-32:2;1). Where available, the individual FA composition according to the same rule is given in brackets (e.g., 18:1;0–24:2;0).
Lipid standards:
Synthetic lipid standards were purchased from Sigma-Aldrich (Chol D6), Larodan (Solna, Sweden) Fine Chemicals (DAG and TAG), and Avanti Polar Lipids (all others).
Lipid extraction for mass spectrometry lipidomics:
Lipids were extracted using a two-step chloroform/methanol procedure35. Samples were spiked with internal lipid standard mixture containing: cardiolipin 16:1/15:0/15:0/15:0 (CL), ceramide 18:1;2/17:0 (Cer), diacylglycerol 17:0/17:0 (DAG), hexosylceramide 18:1;2/12:0 (HexCer), lyso-phosphatidate 17:0 (LPA), lyso-phosphatidylcholine 12:0 (LPC), lyso-phosphatidylethanolamine 17:1 (LPE), lyso-phosphatidylglycerol 17:1 (LPG), lyso-phosphatidylinositol 17:1 (LPI), lyso-phosphatidylserine 17:1 (LPS), phosphatidate 17:0/17:0 (PA), phosphatidylcholine 17:0/17:0 (PC), phosphatidylethanolamine 17:0/17:0 (PE), phosphatidylglycerol 17:0/17:0 (PG), phosphatidylinositol 16:0/16:0 (PI), phosphatidylserine 17:0/17:0 (PS), cholesterol ester 20:0 (CE), sphingomyelin 18:1;2/12:0;0 (SM), triacylglycerol 17:0/17:0/17:0 (TAG) and cholesterol D6 (Chol). After extraction, the organic phase was transferred to an infusion plate and dried in a speed vacuum concentrator. 1st step dry extract was re-suspended in 7.5 mM ammonium acetate in chloroform/methanol/propanol (1:2:4, V:V:V) and 2nd step dry extract in 33% ethanol solution of methylamine in chloroform/methanol (0.003:5:1; V:V:V). All liquid handling steps were performed using Hamilton Robotics STARlet robotic platform with the Anti Droplet Control feature for organic solvents pipetting.
MS data acquisition:
Samples were analyzed by direct infusion on a QExactive mass spectrometer (Thermo Scientific) equipped with a TriVersa NanoMate ion source (Advion Biosciences). Samples were analyzed in both positive and negative ion modes with a resolution of Rm/z=200=280000 for MS and Rm/z=200=17500 for MS/MS experiments, in a single acquisition. MS/MS was triggered by an inclusion list encompassing corresponding MS mass ranges scanned in 1 Da increments11. Both MS and MS/MS data were combined to monitor CE, DAG and TAG ions as ammonium adducts; PC, PC O-, as acetate adducts; and CL, PA, PE, PE O-, PG, PI and PS as deprotonated anions. MS only was used to monitor LPA, LPE, LPE O-, LPI and LPS as deprotonated anions; Cer, HexCer, SM, LPC and LPC O- as acetate adducts and cholesterol as ammonium adduct of an acetylated derivative.
Lipid identification and quantification:
Data were analyzed with in-house developed lipid identification software based on LipidXplorer36. Data post-processing and normalization were performed using an in-house developed data management system. Only lipid identifications with a signal-to-noise ratio >5, and a signal intensity 5-fold higher than in corresponding blank samples were considered for further data analysis.
Lipidomics data processing:
The lipidomic analysis yields a list of >600 individual lipid species and their picomolar abundances. These were processed by first transforming into mol% of all lipids detected. Next, the TAG and sterol esters were removed from the analysis, and the remaining data was analyzed as mol% of membrane lipids. These mol% data tables were the input for direct comparisons of mol% phospholipid data and all principle component analysis methods. PCA scores, loadings, and variances were calculated in RStudio software with prcomp and variance functions and are included as a supplemental file.
Supplementary Material
Acknowledgements
We gratefully acknowledge Robert Chapkin and Yang-Yi Fan for mouse tissue samples and John Magnotti for discussions regarding biostatistical strategies. Funding for this work was provided by the NIH/National Institute of General Medical Sciences (GM114282, GM124072, GM120351, GM134949), the Volkswagen Foundation (grant 93091), and the Human Frontiers Science Program (RGP0059/2019). All authors have no competing interests.
References
- 1.Ernst R, Ejsing CS & Antonny B Homeoviscous adaptation and the regulation of membrane lipids. Journal of molecular biology 428, 4776–4791, doi: 10.1016/j.jmb.2016.08.013 (2016). [DOI] [PubMed] [Google Scholar]
- 2.Levental KR et al. omega-3 polyunsaturated fatty acids direct differentiation of the membrane phenotype in mesenchymal stem cells to potentiate osteogenesis. Science advances 3, eaao1193, doi: 10.1126/sciadv.aao1193 (2017). [DOI] [PMC free article] [PubMed] [Google Scholar]
- 3.Levental KR et al. Lipidomic and biophysical homeostasis of mammalian membranes counteracts dietary lipid perturbations to maintain cellular fitness. Nature communications 11, 1339, doi: 10.1038/s41467-020-15203-1 (2020). [DOI] [PMC free article] [PubMed] [Google Scholar]
- 4.Levental I & Veatch SL The continuing mystery of lipid rafts. Journal of molecular biology 428, 4749–4764 (2016). [DOI] [PMC free article] [PubMed] [Google Scholar]
- 5.Jain M et al. A systematic survey of lipids across mouse tissues. Am J Physiol Endocrinol Metab 306, E854–868, doi: 10.1152/ajpendo.00371.2013 (2014). [DOI] [PMC free article] [PubMed] [Google Scholar]
- 6.van Meer G, Voelker DR & Feigenson GW Membrane lipids: where they are and how they behave. Nat Rev Mol Cell Biol 9, 112–124, doi: 10.1038/nrm2330 (2008). [DOI] [PMC free article] [PubMed] [Google Scholar]
- 7.Diaz-Rohrer B, Levental KR & Levental I Rafting through traffic: Membrane domains in cellular logistics. Biochim. Biophys. Acta-Biomembr 1838, 3003–3013 (2014). [DOI] [PubMed] [Google Scholar]
- 8.Tulodziecka K et al. Remodeling of the postsynaptic plasma membrane during neural development. Mol Biol Cell 27, 3480–3489, doi: 10.1091/mbc.E16-06-0420 (2016). [DOI] [PMC free article] [PubMed] [Google Scholar]
- 9.Innis SM Dietary (n-3) fatty acids and brain development. The Journal of nutrition 137, 855–859 (2007). [DOI] [PubMed] [Google Scholar]
- 10.Weiss L et al. Fatty-acid biosynthesis in man, a pathway of minor importance. Purification, optimal assay conditions, and organ distribution of fatty-acid synthase. Biol Chem Hoppe Seyler 367, 905–912 (1986). [DOI] [PubMed] [Google Scholar]
- 11.Surma MA et al. An automated shotgun lipidomics platform for high throughput, comprehensive, and quantitative analysis of blood plasma intact lipids. European journal of lipid science and technology : EJLST 117, 1540–1549, doi: 10.1002/ejlt.201500145 (2015). [DOI] [PMC free article] [PubMed] [Google Scholar]
- 12.Sampaio JL et al. Membrane lipidome of an epithelial cell line. Proc Natl Acad Sci U S A 108, 1903–1907, doi: 10.1073/pnas.1019267108 (2011). [DOI] [PMC free article] [PubMed] [Google Scholar]
- 13.Klemm RW et al. Segregation of sphingolipids and sterols during formation of secretory vesicles at the trans-Golgi network. J Cell Biol 185, 601–612, doi: 10.1083/jcb.200901145 (2009). [DOI] [PMC free article] [PubMed] [Google Scholar]
- 14.Braverman NE & Moser AB Functions of plasmalogen lipids in health and disease. Biochim Biophys Acta 1822, 1442–1452, doi: 10.1016/j.bbadis.2012.05.008 (2012). [DOI] [PubMed] [Google Scholar]
- 15.Else PL The highly unnatural fatty acid profile of cells in culture. Progress in lipid research 77, 101017, doi: 10.1016/j.plipres.2019.101017 (2020). [DOI] [PubMed] [Google Scholar]
- 16.Sprong H, van der Sluijs P & van Meer G How proteins move lipids and lipids move proteins. Nat Rev Mol Cell Biol 2, 504–513 (2001). [DOI] [PubMed] [Google Scholar]
- 17.Surma MA, Klose C, Klemm RW, Ejsing CS & Simons K Generic sorting of raft lipids into secretory vesicles in yeast. Traffic 12, 1139–1147, doi: 10.1111/j.1600-0854.2011.01221.x (2011). [DOI] [PubMed] [Google Scholar]
- 18.Levental KR & Levental I Isolation of giant plasma membrane vesicles for evaluation of plasma membrane structure and protein partitioning. Methods in molecular biology 1232, 65–77, doi: 10.1007/978-1-4939-1752-5_6 (2015). [DOI] [PubMed] [Google Scholar]
- 19.Xiong J et al. Rapid affinity purification of intracellular organelles using a twin strep tag. J Cell Sci 132, doi: 10.1242/jcs.235390 (2019). [DOI] [PMC free article] [PubMed] [Google Scholar]
- 20.Tharkeshwar AK et al. A novel approach to analyze lysosomal dysfunctions through subcellular proteomics and lipidomics: the case of NPC1 deficiency. Sci Rep 7, 41408, doi: 10.1038/srep41408 (2017). [DOI] [PMC free article] [PubMed] [Google Scholar]
- 21.Sezgin E et al. Elucidating membrane structure and protein behavior using giant plasma membrane vesicles. Nat Protoc 7, 1042–1051, doi: 10.1038/nprot.2012.059 (2012). [DOI] [PubMed] [Google Scholar]
- 22.Levental I, Levental KR & Heberle FA Lipid rafts: controversies resolved, mysteries remain. Trends in cell biology 30, 341–353, doi: 10.1016/j.tcb.2020.01.009 (2020). [DOI] [PMC free article] [PubMed] [Google Scholar]
- 23.Chung J et al. PI4P/phosphatidylserine countertransport at ORP5- and ORP8-mediated ER-plasma membrane contacts. Science 349, 428–432, doi: 10.1126/science.aab1370 (2015). [DOI] [PMC free article] [PubMed] [Google Scholar]
- 24.Mesmin B et al. A four-step cycle driven by PI(4)P hydrolysis directs sterol/PI(4)P exchange by the ER-Golgi tether OSBP. Cell 155, 830–843, doi: 10.1016/j.cell.2013.09.056 (2013). [DOI] [PubMed] [Google Scholar]
- 25.Levental I, Grzybek M & Simons K Raft domains of variable properties and compositions in plasma membrane vesicles. Proc Natl Acad Sci U S A 108, 11411–11416, doi: 10.1073/pnas.1105996108 (2011). [DOI] [PMC free article] [PubMed] [Google Scholar]
- 26.Levental I, Lingwood D, Grzybek M, Coskun U & Simons K Palmitoylation regulates raft affinity for the majority of integral raft proteins. Proc Natl Acad Sci U S A 107, 22050–22054, doi: 10.1073/pnas.1016184107 (2010). [DOI] [PMC free article] [PubMed] [Google Scholar]
- 27.Levental KR et al. Polyunsaturated lipids regulate membrane domain stability by tuning membrane order. Biophys J 110(8), 1800–1810, doi: 10.1016/j.bpj.2016.03.012 (2016). [DOI] [PMC free article] [PubMed] [Google Scholar]
- 28.Harayama T & Riezman H Understanding the diversity of membrane lipid composition. Nat Rev Mol Cell Biol 19, 281–296, doi: 10.1038/nrm.2017.138 (2018). [DOI] [PubMed] [Google Scholar]
- 29.Gerl MJ et al. Quantitative analysis of the lipidomes of the influenza virus envelope and MDCK cell apical membrane. J Cell Biol 196, 213–221, doi: 10.1083/jcb.201108175 (2012). [DOI] [PMC free article] [PubMed] [Google Scholar]
- 30.Steinkuhler J, Sezgin E, Urbancic I, Eggeling C & Dimova R Mechanical properties of plasma membrane vesicles correlate with lipid order, viscosity and cell density. Commun Biol 2, 337, doi: 10.1038/s42003-019-0583-3 (2019). [DOI] [PMC free article] [PubMed] [Google Scholar]
- 31.Gray EM, Diaz-Vazquez G & Veatch SL Growth Conditions and Cell Cycle Phase Modulate Phase Transition Temperatures in RBL-2H3 Derived Plasma Membrane Vesicles. PloS one 10, e0137741, doi: 10.1371/journal.pone.0137741 (2015). [DOI] [PMC free article] [PubMed] [Google Scholar]
- 32.Burns M, Wisser K, Wu J, Levental I & Veatch SL Miscibility Transition Temperature Scales with Growth Temperature in a Zebrafish Cell Line. Biophys J 113, 1212–1222, doi: 10.1016/j.bpj.2017.04.052 (2017). [DOI] [PMC free article] [PubMed] [Google Scholar]
- 33.Lorent JH et al. Plasma membranes are asymmetric in lipid unsaturation, packing, and protein shape. Nat Chem Biol in press, doi: 10.1101/698837 (2020). [DOI] [PMC free article] [PubMed] [Google Scholar]
- 34.Cohen RS, Blomberg F, Berzins K & Siekevitz P The structure of postsynaptic densities isolated from dog cerebral cortex. I. Overall morphology and protein composition. J Cell Biol 74, 181–203 (1977). [DOI] [PMC free article] [PubMed] [Google Scholar]
- 35.Ejsing CS et al. Global analysis of the yeast lipidome by quantitative shotgun mass spectrometry. Proc Natl Acad Sci U S A 106, 2136–2141, doi: 10.1073/pnas.0811700106 (2009). [DOI] [PMC free article] [PubMed] [Google Scholar]
- 36.Herzog R et al. LipidXplorer: a software for consensual cross-platform lipidomics. PloS one 7, e29851, doi: 10.1371/journal.pone.0029851 (2012). [DOI] [PMC free article] [PubMed] [Google Scholar]
Associated Data
This section collects any data citations, data availability statements, or supplementary materials included in this article.