Abstract
Background:
Slow gastrointestinal (GI) transit occurs in moderate-to-severe malnutrition. Mechanisms underlying malnutrition-associated dysmotility remain unknown, partially due to lack of animal models. This study sought to characterize GI dysmotility in mouse models of malnutrition.
Methods:
Neonatal mice were malnourished by timed maternal separation. Alternatively, low-protein, low-fat diet was administered to dams, with malnourished neonates tested at two weeks or weaned to the same chow and tested as young adults. We determined total GI transit time by carmine red gavage, colonic motility by rectal bead latency, and both gastric emptying and small bowel motility with fluorescein isothiocyanate-conjugated dextran. We assessed histology with light microscopy, ex vivo contractility and permeability with force-transduction and Ussing chamber studies, and gut microbiota composition by 16S rDNA sequencing.
Key Results:
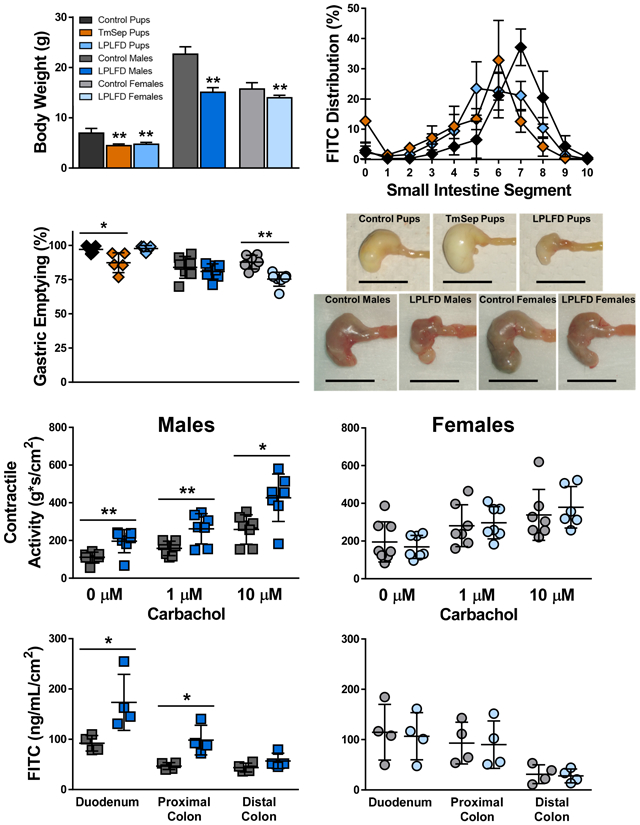
Both models of neonatal malnutrition and young adult malnourished males but not females exhibited moderate growth faltering, stunting, and grossly abnormal stomachs. Progression of fluorescent dye was impaired in both neonatal models of malnutrition, whereas gastric emptying was delayed only in maternally separated pups and malnourished young adult females. Malnourished young adult males but not females had atrophic gastrointestinal mucosa, exaggerated contractile responses, and increased gut barrier permeability. These sex-specific abnormalities were associated with altered gut microbial communities.
Conclusions & Inferences:
Multiple models of early-life malnutrition exhibit delayed upper GI transit. Malnutrition affects young adult males more profoundly than females. These models will facilitate future studies to identify mechanisms underlying malnutrition-induced pathophysiology and sex-specific regulatory effects.
Keywords: Malnutrition, gastroparesis, gastrointestinal motility, permeability, microbiome, sex differences
Graphical Abstract
1. INTRODUCTION
Malnutrition accounts for 1.7 million child deaths per year.1 Over 50 million children under age five years (8%) show signs of wasting and 151 million (22%) are stunted.2 Malnutrition creates a “vicious cycle”3,4 of gastrointestinal (GI) pathophysiologies that further erode health. Among the least understood comorbidities is GI dysmotility, which is observed in children with severe acute malnutrition,5-7 small-for-gestational-age neonates,8,9 and young adults with anorexia nervosa.10-14 Slow GI motility might impair weight gain, given that previously non-malnourished patients with gastroparesis15,16 and chronic intestinal pseudo-obstruction17,18 lose weight. Mechanisms underlying these associations are poorly understood, in part due to lack of animal models.
This study aimed to characterize GI dysmotility in early-life malnutrition. Two neonatal models – timed maternal separation (TmSep)19 and introduction to dams of a low-protein, low-fat diet (LPLFD) mimicking the macronutrient composition of diets typical in rural Northeast Brazil20 – as well as a young adult LPLFD model21 were employed to ensure that dysmotility was not specific to the means by which malnutrition was modeled. We assessed total GI transit time with carmine red gavage, colonic motility by rectal bead latency, and gastric emptying and small bowel transit by quantifying the distribution of fluorescein isothiocyanate (FITC)-conjugated dextran after gavage. Although many central, peripheral, and other endogenous and exogenous factors affect GI motility,22-25 we focused our initial investigation of possible mechanisms underlying malnutrition-induced dysmotility by determining whether muscle tone and contractility, intestinal barrier permeability, and fecal microbial communities are affected in our mouse models. We assessed tone and contractility with ex vivo force-transduction experiments, permeability with Ussing chamber studies, and gut microbiota alterations with 16S rDNA sequencing. Each malnutrition protocol affected the gross appearance of the stomach, decreased the length of the small intestine, impaired gastric emptying or small bowel transit, and altered the gut microbiota. Findings in malnourished young adult mice, including abnormal contractile responses to cholinergic stimulation and increased gut barrier permeability, were sex-specific. These results suggest novel interactions between nutritional status and sex that influence GI motility.
2. MATERIALS AND METHODS
2.1. Modeling malnutrition in mice
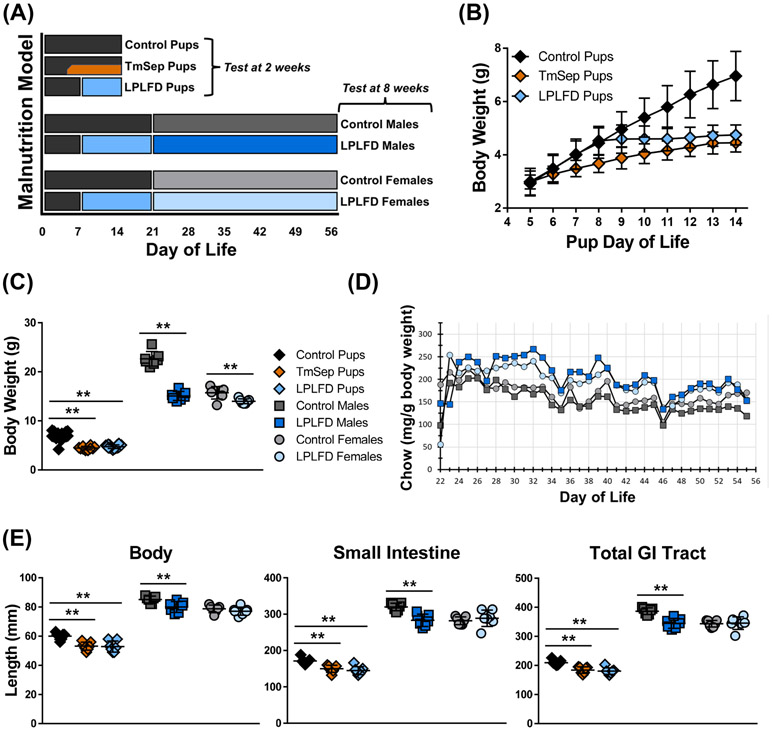
The Institutional Animal Care and Use Committee at Baylor College of Medicine approved all aspects of this study. C57BL/6J mice were obtained from the Center for Comparative Medicine at Baylor College of Medicine and maintained on control chow containing 20% kcal protein, 15% kcal fat, and 65% kcal carbohydrate (#D09051102, Research Diets, New Brunswick, NJ). Malnutrition was induced as previously described19,26,27 by TmSep of the same half of litters for 4 hours on day of life (DOL) 5, 8 hours on DOL 6, and 12 hours DOL 7-14, with overnight nursing ad libitum. In accordance with our previously published studies, separated pups from multiple litters were combined within one large nest to obviate the need for external warming prior to random redistribution to dams for overnight feeding. Alternatively, LPLFD chow containing 7% kcal protein, 5% kcal fat, and 88% kcal carbohydrate (#D09081701B, Research Diets), specially formulated to be isocaloric to the control chow, was introduced to dams on DOL 8. Previous studies have modeled malnutrition by introducing this LPLFD to dams on DOL 321 or DOL 10.28 We introduced LPLFD on DOL 8 so that TmSep pups and LPLFD pups were equally underweight and stunted when they underwent motility testing at 2 weeks. Alternatively, on DOL 21, mice were weaned to the same diets as their dams (either control diet or LPLFD) and were maintained on these diets for another 6 weeks (Fig. 1A).
FIGURE 1.
Multiple mouse models of early-life malnutrition induce characteristic whole-body and GI tract changes. A, Dietary manipulation begins in the neonatal period by feeding dams LPLFD (blue) or control diet (gray) with or without TmSep (orange); pups are tested at 2 wk of life in the fed state or are weaned to their dams’ diet and tested as 8 wk old young adults. B, TmSep pups and LPLFD pups are equally underweight when tested at 2 wk. C, At the time of testing all malnourished models are underweight. D, Decreased chow consumption does not occur in malnourished young adult mice. E, All malnourished models except LPLFD young adult females exhibit decreased length of body, small bowel, and total GI tract. Individual data points are shown along with mean ± SD; **P < .01; n = 7 mice per group; TmSep = timed maternal separation; LPLFD = low-protein low-fat diet.
Daily chow consumption by cage was calculated by determining the weight of chow consumed over a 24 hr period divided by the summed daily body weight for mice in that cage. Testing was performed for neonatal mice at 2 weeks of life, one day after ending TmSep. Eight-week old young adult mice were tested after an overnight fast of 15 hours. Each experiment included mice (with n ranging from 4 per group for Ussing chamber studies to 10 per group for microbiota studies) originating from two or more randomized litters. Each experiment was repeated twice on different occasions using mice derived from distinct mating groups. Female estrous cycles were not tracked. Although our data did not reveal litter-specific effects, previously we have reported subtle changes in motility that depend on the time of day;29 thus, all motility testing was performed between the hours of 09:00-13:00. Nose-to-rump body length was measured in the prone position, and intestinal length measurements were made by gently stretching intact, freshly harvested tissue.
2.2. Assessing GI motility in vivo
Upper GI tract motility was assessed as previously reported29 by determining the distribution of 100 μL of 10 mg mL−1 FITC conjugated to 70 kDa dextran (Sigma, St. Louis, MO) 30 minutes after gastric gavage, with no food or water access post-gavage. Following euthanization for 2 minutes in CO2, 14 GI luminal samples (stomach, 10 small intestinal segments of equal length, cecum, and proximal and distal colon) were collected and flushed with 3 mL phosphate-buffered saline (PBS). After centrifugation, fluorescence from each flushing was quantified (excitation 485 nm, emission 525 nm), and mean geometric center (MGC) and % gastric emptying were computed.29 The assay for neonatal mice was modified as previously reported. Briefly, nursing was permitted up until gavage with 50 μL FITC-dextran, after which pups were isolated from dams to prevent further nursing.29 Thirty minutes later, following cervical dislocation, GI segments were harvested immediately from pups. In young adults, total GI transit time was recorded as the number of minutes between gastric gavage of 100 μL carmine red (6% weight volume−1 in 0.5% methylcellulose; Sigma) and first appearance of red dye in the stool.30 Rectal bead latency31 was recorded as the number of minutes needed to expel a 2 mm-diameter glass bead (Sigma) inserted to a depth of 2.5 cm under light isoflurane anesthetization.
2.3. Evaluating GI histology
For histology, a separate set of mice that had not undergone motility testing were used. All of these animals, including TmSep pups, had fed ad libitum overnight and until sample harvest. Tissues were fixed in formalin, embedded in paraffin, cut, and stained with hematoxylin and eosin. Images were captured on an Eclipse 90i Ni-E microscope (Nikon, Tokyo). Measurements were made by an observer blinded to the treatment group using NIS-Elements software (Nikon) for villus height (small bowel) or mucosa thickness (stomach and colon), crypt depth, and muscularis thickness using ImageJ. For each histologic parameter, 5-20 measurements per GI region were averaged for each animal.
2.4. Quantifying intestinal contractility
Intestinal contractile activity was measured in the longitudinal axis as previously described32,33 with some minor modifications. Briefly, 1 cm segments of duodenum, jejunum, proximal colon, and distal colon were harvested and immediately mounted in organ baths filled with 25 mL Krebs solution (in mM: 120.9 NaCl, 5.9 KCl, 2.5 CaCl2, 14.4 NaHCO3, 1.2 NaH2PO4, 1.2 MgCl2, 11.5 glucose) and infused continuously with 95% O2/5% CO2 gas. Isometric force was monitored by an external force displacement transducer connected to a PowerLab recorder (ADInstruments, Colorado Springs, CO). Tension of 0.4 g or 0.5 g was applied to small bowel or colonic segments, respectively. After 30 min of equilibration, baseline contractile activity was recorded for 5 min. Responses to increasing doses of cholinergic stimulation were determined, first by adding 1 μM carbachol (Sigma) to each organ bath with activity recorded for 5 min, then by increasing the dose to 10 μM with activity recorded for another 5 min. Subsequently, the length of each intestinal segment was measured, and tissue was removed, dried, and weighed. Contractile activity was calculated as the integral from minimum, and the amplitude and frequency of contractions were determined by normalizing readings to tissue cross-sectional areas using the measured weight and length and an assumed tissue density of 1.05 g cm−3 using LabChart software (ADInstruments).
2.5. Measuring intestinal permeability
Intestinal permeability was quantified in a P2300 Ussing chamber system (Physiologic Instruments, San Diego, CA). Briefly, full-thickness sections of duodenum, proximal colon, and distal colon segments were harvested and immediately flushed with KBR buffer (in mM: 115 NaCl, 1.2 CaCl2, 25 NaHCO3, 2.4 K2HPO4, 0.4 KH2PO4, 1.2 MgCl2, 10 glucose). Each segment was opened along its mesenteric border, rinsed, and mounted on a slide with an exposure area of .30 cm2. The mucosal and serosal chambers each were filled with 5 mL KBR buffer maintained at 37 °C and infused with 95% O2/5% CO2 gas. Permeability was assessed by flux of 4 kDa FITC-dextran (Sigma) and transepithelial resistance (TER). After an equilibration period of 10 min, FITC-dextran was added to the mucosal chamber to a final concentration of 2.2 mg mL−1 and sampled from the serosal side after 0, 30, 60, 90, and 120 min. The fluorescent intensity of each sample was measured by a Cytation5 Imaging Reader (BioTek Instruments, Winooski, VT). TER was calculated from the spontaneous potential difference and short-circuit current via Ohm’s law. Aggregate data for FITC-dextran flux and TER were normalized to the average measurements over all time points.
2.6. Evaluating gut microbial communities
Stool was obtained from individual mice that had not undergone motility testing, and 16S rDNA sequencing was performed in the Baylor College of Medicine Alkek Center for Metagenomics and Microbiome Research as described in detail previously.27 Briefly, DNA was extracted using MoBIO PowerSoil DNA Isolation Kit (Qiagen, Germantown, MD) according to the manufacturer’s protocol. The 16S V4 region was amplified by polymerase chain reaction and sequenced on the MiSeq platform (Illumina, San Diego, CA) using the 2 x 250-bp protocol. A custom pipeline, using the QIIME software package,34 was used for analysis. Reads were trimmed, quality-filtered, clustered into operational taxonomic units (OTUs) with a 97% similarity cutoff using the UPARSE algorithm,35 and aligned using the SILVA database.36 The Fisher index was used to compare taxonomic diversity between samples.
2.7. Statistical analysis
All data were confirmed to be normally distributed by the Shapiro-Wilk test, and are presented as mean ± standard deviation (SD). Data from control, TmSep, and LPLFD pups were analyzed by one-way ANOVA and, when the global test was significant (P < .05), by Tukey’s multiple comparisons test. Only adjusted P values are presented for the three groups of mouse pups. Alternatively, male or female LPLFD young adults were compared to their respective controls by two-tailed t test. Associations between gastric emptying and MGC were identified using two-tailed Pearson correlation tests. All data are representative of at least two identical experiments performed on different sets of animals on different dates.
3. RESULTS
3.1. Malnutrition causes sex-specific changes in weight and length
Impaired weight gain was observed immediately after initiating TmSep (DOL 5) or LPLFD chow (DOL 8, Fig. 1B). At 2 weeks of life, both TmSep pups and LPLFD pups weighed < 70% of control pups (adjusted P < .001). However, young adult males and females were affected differently by malnutrition (Fig. 1C); LPLFD males weighed just 67% of control males (P < .0001), whereas LPLFD females weighed 89% of control females (P < .01). Growth impairment was not due to decreased food intake; compared to controls, malnourished young adult males and females consistently consumed a greater amount of chow relative to body weight (Fig. 1D). Similarly, nose-to-rump length, small bowel length, and total GI tract length were decreased in TmSep pups, LPLFD pups, and LPLFD males (Fig. 1E, adjusted P < .01 for each comparison) but not LPLFD females. Colon length was not altered by malnutrition in any model, and consistent with our previous findings,29 sex-specific differences among neonatal mice were not identified.
3.2. Malnutrition causes GI dysmotility
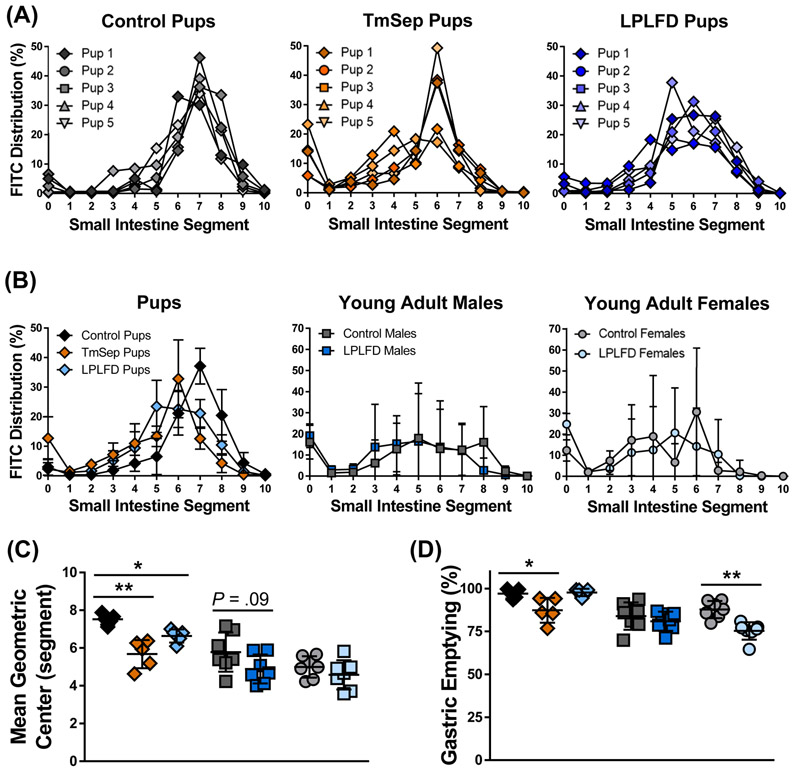
Total GI transit time and colonic motility could not be assessed reproducibly in neonates, which rely on maternal stimulation to defecate. In young adults, neither whole GI transit (Fig. 2A) nor rectal bead latency (Fig. 2B) times differed significantly between malnourished and control mice, although a trend toward prolonged bead expulsion was observed in LPLFD vs control females (P = .09). To more precisely assess upper GI tract motility, we determined the distribution of FITC-dextran 30 minutes after gavage. Congruent with our previous findings,29 our modified neonatal mouse protocol yielded markedly reduced variance in comparison to the standard adult FITC-dextran protocol (Fig. 3A-B and Supporting Fig. S1). Relative to control pups, MGC was decreased in TmSep pups (−1.8 segments, adjusted P < .001) and in LPLFD pups (−.9 segment, adjusted P < .05; Fig. 3C). No significant changes in MGC were observed in LPLFD young adults. Mean gastric emptying was decreased from 97% to 87% in TmSep pups (adjusted P < .05) and from 88% to 75% in LPLFD young adult females (P < .001, Fig. 3D). Correlational analysis revealed an association between gastric emptying and MGC only in TmSep pups (P < .05), suggesting that decreased MGC in LPLFD models cannot be attributed exclusively to delayed gastric emptying. These data indicate that multiple models of early-life malnutrition are associated with impaired upper GI motility in a sexually dimorphic manner.
FIGURE 2.
Malnourished young adults do not exhibit significant changes in whole gut transit time or distal colon motility. A, Elapsed time between carmine red gavage and appearance of the first red fecal pellet. B, Elapsed time between rectal insertion of a glass bead under light isoflurane anesthesia and expulsion of the bead onto the cage floor. Individual data points are shown along with mean ± SD; n = 5-9 mice per group; LPLFD = low-protein low-fat diet.
FIGURE 3.
Multiple malnutrition models demonstrate impaired progression of FITC-dextran 30 minutes after gavage. A, Modified neonatal gavage technique reveals minimal variance. B, The small intestinal segment containing peak mean intensity is more distal in control pups compared to TmSep pups and LPLFD pups, but no differences are observed among young adults. C, Progression of the MGC of FITC-dextran is impaired in both malnourished pup models. D, Gastric emptying is delayed in TmSep pups and LPLFD young adult females. Individual data points are shown along with mean ± SD; **P < .01; *P < .05; n = 5 pups and 7 young adult mice per group; FITC = fluorescein isothiocyanate; LPLFD = low-protein low-fat diet; MGC = mean geometric center; TmSep = timed maternal separation; segment 0 = stomach, 1 = proximal duodenum, 10 = terminal ileum. No dye was observed in the cecum or colon.
3.3. Malnutrition alters gross stomach appearance and GI mucosal structure
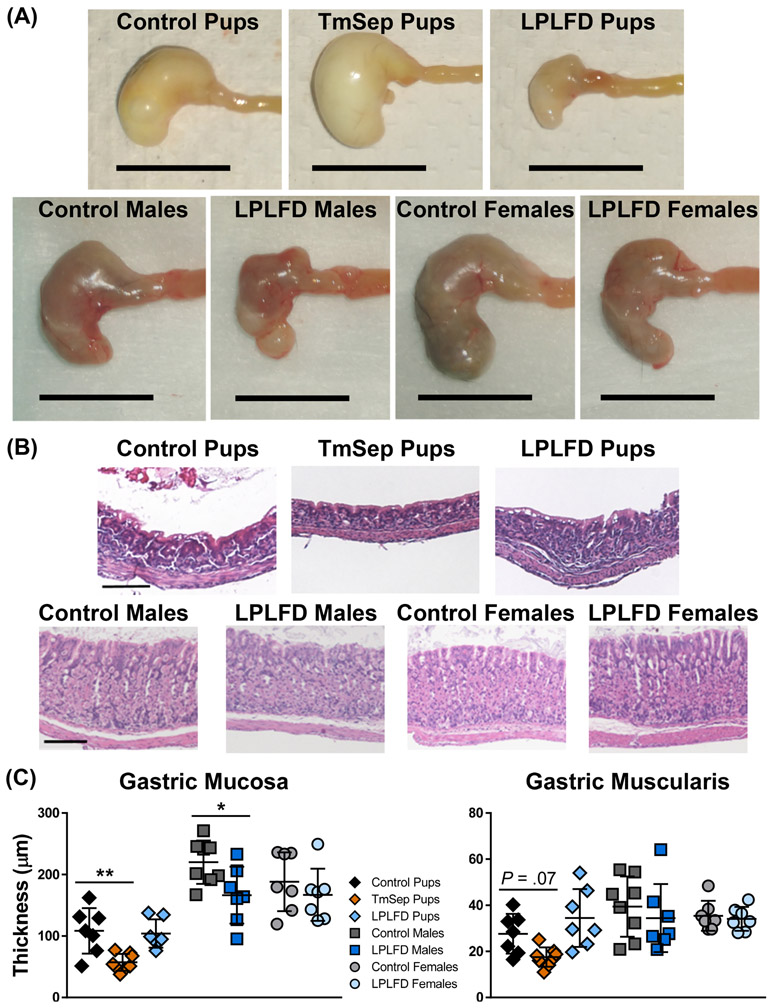
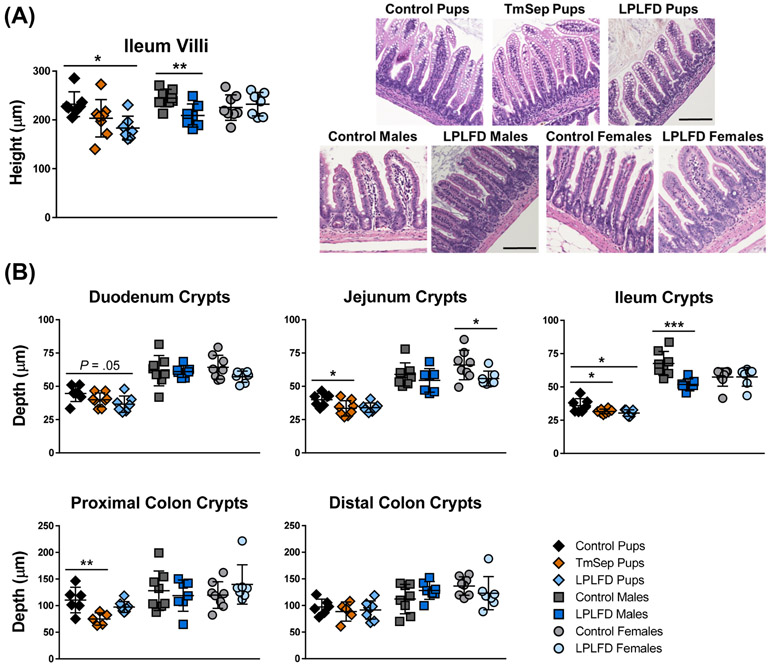
To gain initial insights into mechanisms by which malnutrition-associated dysmotility occurs, we examined the gross and microscopic appearance of the malnourished GI tract. Stomachs from TmSep pups were grossly dilated, whereas stomachs from LPLFD pups and LPLFD young adult males were shrunken and nodular (Fig. 4A). Stomachs from LPLFD young adult females appeared less abnormal. Examination by light microscopy (Fig. 4B-C) revealed thinning of the gastric mucosa in two of the malnutrition models. Mucosa was atrophic in stomachs of both TmSep pups (57.2 vs 108.5 μm, adjusted P < .01) and LPLFD males (166.5 vs 220.1 μm, P < .05). Although gastric muscularis thickness was not significantly altered in any model, we observed a trend toward smooth muscle atrophy in TmSep pups (17.6 vs 27.6 μm, adjusted P = .07). Likewise, a broad histologic survey of the duodenum, jejunum, ileum, and proximal and distal colon (Supporting Fig. S2) revealed that malnutrition spared muscularis thickness while impacting mucosal histology. Ileal villi were blunted in LPLFD pups (79% vs control pups, adjusted P < .05) and LPLFD males (85% vs control males, P < .01) but not LPLFD females (Fig. 5A). Similarly, crypt depth was diminished in jejunum, ileum, and proximal colon in multiple malnutrition models (Fig. 5B). A preliminary examination using whole mount immunostaining did not reveal obvious changes in the density or relative proportions of glia or neurons expressing Hu, nNOS, or calbindin in the myenteric plexus of the duodenum or colon (Supporting Figs. S3-S4). A more detailed quantitative analysis of the malnourished enteric nervous system, which is outside the scope of the present study, needs to be conducted. Taken together, these findings indicate that malnutrition grossly alters gastric and intestinal mucosal morphology, but smooth muscle layer thickness and enteric nervous system structures were not affected to the same extent.
FIGURE 4.
Multiple malnutrition models affect gross and histologic stomach structure. A, Representative stomachs photographed immediately after harvest reveal grossly abnormal appearance in each malnutrition model; scale bar = 1 cm. B, Representative hematoxylin- and eosin-stained gastric sections reveal well-delineated mucosa and muscularis; scale bar = 100 μm. C, Malnutrition thins the gastric mucosa in TmSep pups and LPLFD males relative to respective controls. Individual data points are shown along with mean ± SD; **P < .01; *P < .05; n = 7-8 mice per group; LPLFD = low-protein low-fat diet; TmSep = timed maternal separation.
FIGURE 5.
Malnutrition alters the intestinal mucosa. A, Malnutrition blunts ileal villus height in LPLFD pups and LPLFD males relative to respective controls. B, Multiple malnutrition models exhibit decreased crypt depth in jejunum, ileum, and proximal colon. Individual data points are shown along with mean ± SD; **P < .01; *P < .05; n = 7-8 mice per group; LPLFD = low-protein low-fat diet; TmSep = timed maternal separation.
3.4. Malnutrition increases spontaneous and cholinergic-mediated contractile activity
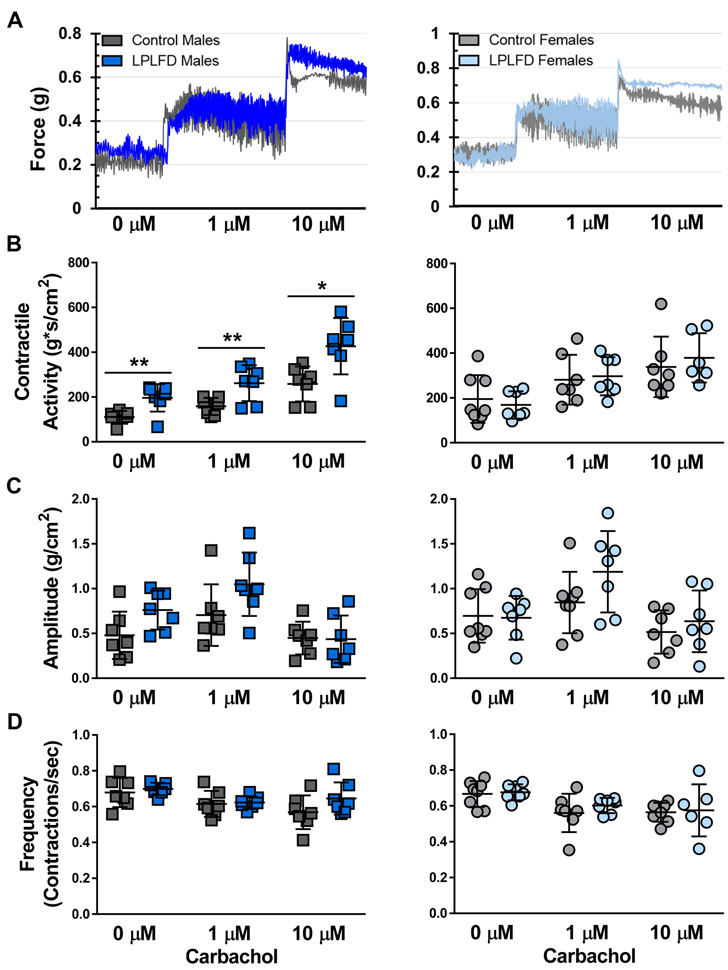
To determine whether additional functional changes are present in the malnourished intestine, we measured ex vivo contractile activity at baseline and in response to increasing concentrations of cholinergic stimulation (Fig. 6A). Unexpectedly, duodenal segments from LPLFD young adult males demonstrated increased contractility compared to controls. Spontaneous contractile activity was increased 1.8-fold (P < .01), and contractile responses to 1 μM and 10 μM carbachol were each increased 1.7-fold (P < .05) in duodenum from LPLFD males but not females compared to controls (Fig. 6B). In contrast, malnutrition did not induce changes in contraction amplitude (Fig. 6C) or frequency (Fig. 6D). This result was specific to the duodenum; increased contractility was not observed in the malnourished male jejunum, proximal colon, or distal colon (Supporting Fig. S5-S7). Rather, in the distal colon, malnourished females exhibited decreased contractile responses to cholinergic stimulation (Supporting Fig. S7). These results indicate that cholinergic contractile responses are intact in malnutrition, with sex-specific differences including exaggerated contractile activity in the duodenum of males and decreased contractile activity in the distal colon of females.
FIGURE 6.
Malnutrition increases ex vivo contractility of duodenal segments. A, Representative force-transduction tracings showing equilibration at baseline and after exposure of first 1 μM then 10 μM carbachol. B, Contractile activity, calculated as the integral from minimum, is increased in duodenum from LPLFD males at baseline and in response to 1 μM and 10 μM carbachol. C, Average contraction amplitude of duodenal segments does not differ between experimental groups. D, Frequencies of spontaneous or cholinergic-stimulated contractions of duodenal segments are not different between experimental groups. Individual data points are shown along with mean ± SD; **P < .01; *P < .05; n = 7-8 mice per group; LPLFD = low-protein low-fat diet.
3.5. Intestinal permeability is increased in malnourished males
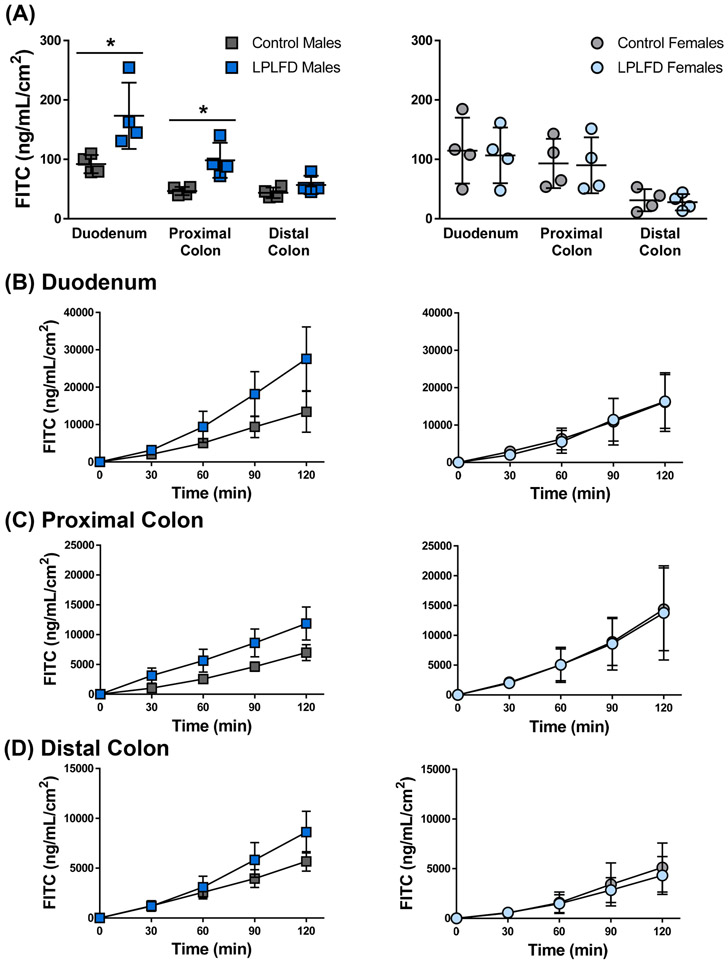
Malnutrition impairs gut barrier function in humans and animal models,37 and our histological survey revealed decreased thickness of the intestinal mucosa. Thus, we assessed barrier function by quantifying the translocation of FITC-dextran across full-thickness sections of duodenum, proximal colon, and distal colon mounted in Ussing chambers. Consistent with previous studies that fed LPLFD to weanling mice,28 we observed increased permeability in intestine harvested from LPLFD males. Translocation was increased across the duodenum 1.9-fold (P < .05; Fig. 7A-B) and across the proximal colon 2.1-fold (P < .05; Figs 7A, 7C). Increased permeability occurred without a significant decrease in TER (Supporting Fig. S8). Although translocation appeared to increase across the distal colon in LPLFD males (Fig. 7D), this trend was not significant. Strikingly, gut permeability was not increased in LPLFD females. Taken together, these results demonstrate that malnutrition increases gut barrier permeability in the proximal intestine in a sex-specific manner.
FIGURE 7.
Malnutrition increases intestinal permeability to 4-kDa FITC-dextran in Ussing chambers. A, Average translocation across all time points reveals increased permeability in duodenum and proximal colon harvested from LPLFD males. B-D, Real-time measurements of translocation throughout the two-hour experiment for duodenum, proximal colon, and distal colon sections. Individual data points are shown along with mean ± SD; *P < .05; n = 4 mice per group; FITC = fluorescein isothiocyanate; LPLFD = low-protein low-fat diet.
3.6. Gut microbial communities are altered in malnutrition
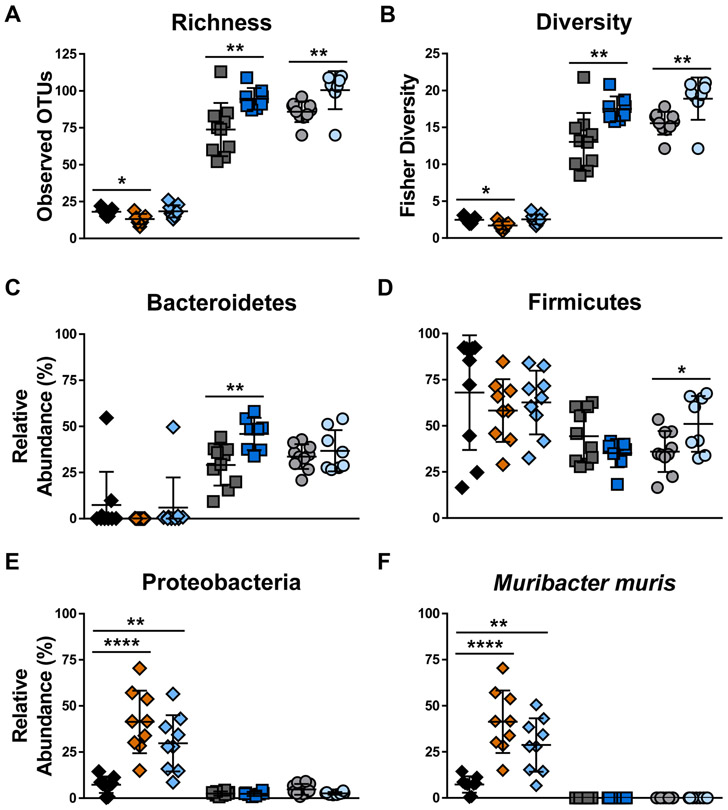
Given that altered gut microbiota are associated with changes in GI motility and permeability,23 we sought to determine whether fecal microbial community changes are present in our malnourished models with 16S rDNA sequencing. Consistent with our previous findings,26,27 stool from TmSep pups contained fewer unique taxa (adjusted P < .05, Fig. 8A) and decreased microbial community diversity (adjusted P < .05, Fig. 8B) compared to stool from control pups. Conversely, stool from LPLFD males and females had a greater number of unique taxa and increased gut microbial community diversity relative to their respective controls (P < .01 for each comparison), which could reflect the increased carbohydrate content of the LPLFD chow. At the phylum level, a greater relative abundance of Bacteroidetes was observed in LPLFD males (P < .01, Fig. 8C) and a greater abundance of Firmicutes was observed in LPLFD females (P < .05, Fig. 8D). Strikingly, both neonatal malnutrition models exhibited increased abundance of Proteobacteria (Fig. 8E), a phylum which contains numerous proinflammatory taxa. Compared to control pups, the relative abundance of Proteobacteria was increased 5.6-fold in TmSep pups (adjusted P < .0001) and 4.1-fold in LPLFD pups (adjusted P < .01). This increase in Proteobacteria was driven by expansion of a single species, Muribacter muris (Fig. 8F), a rodent commensal bacterium in the family Pasteurellaceae.38 These results indicate that malnutrition-induced changes in GI motility, morphology, contractility, and permeability are associated with altered gut microbial communities and are dependent on host sex.
FIGURE 8.
Gut microbial community composition is altered in multiple models of malnutrition. A, Microbial community richness, defined as the number of unique operational taxonomic units, is decreased in TmSep pups but increased in LPLFD males and females relative to controls. B, Fisher’s diversity index reveals a similar pattern. C, Relative abundance of the phylum Bacteroidetes is increased in LPLFD males. D, Relative abundance of the phylum Firmicutes is increased in LPLFD females. E, Relative abundance of the phylum Proteobacteria is increased in both neonatal models of malnutrition. F, Relative abundance of the species Muribacter muris drives the observed changes of Proteobacteria. Individual data points are shown along with mean ± SD; ****P < .0001; **P < .01; *P < .05; n = 7-10 mice per group; LPLFD = low-protein low-fat diet; OTU = operational taxonomic unit; TmSep = timed maternal separation.
4. DISCUSSION
The goals of this study were to recapitulate malnutrition-induced GI dysmotility in mouse models and to gain initial insights into potential underlying mechanisms by identifying associated histologic and physiologic changes. Our results demonstrate that multiple mouse models of early-life malnutrition exhibit GI dysmotility, namely delayed gastric emptying and small bowel progression of gavaged FITC-dextran. Our data also demonstrate that malnutrition alters mucosal structure (to a greater extent than smooth muscle or enteric nervous system structure), increases the baseline tone and contractility of intestinal segments, increases barrier permeability, and alters the gut microbiota. Most strikingly, our data show that the effects of malnutrition on intestinal physiology in young adults are dependent on the sex of the animal.
Among the key findings of these studies is that malnutrition slows GI motility, mimicking features observed in small-for-gestational-age neonates,8,9 children with severe acute malnutrition,5-7 and young adults with anorexia nervosa.10-14 Although the influence of high-fat diet and obesity on GI motility is well documented,39-42 this study is the first to our knowledge to recapitulate undernutrition-associated dysmotility in the laboratory. We employed multiple models to ensure that our results are independent of the means by which malnutrition is induced. TmSep pups receive the same diet as control pups, with the amount of breast milk limited to what is consumed during nocturnal nursing. Given the wide variation in timing and duration of existing maternal separation protocols,43 the motility impairment observed in our TmSep pups might not be recapitulated in similar models. Recent studies of maternal separation in rodents reveal subtle alterations in both maternal caregiving44 and offspring stress response.45 Although we did not observe any obvious behavioral changes, we did not study maternal and offspring behaviors systematically. Thus, because we cannot rule out separation-induced stress as contributing to the dysmotility, we also modeled malnutrition through dietary manipulation without separation. In young adult mice, testing was performed following a prolonged overnight fast to minimize the possibility that luminal differences in macronutrient concentrations between LPLFD and control diet drives the dysmotility. We performed our investigations in mice because the two neonatal mouse models of malnutrition are well characterized and are equally underweight and stunted when testing is performed, and because of the greater number of genetic tools that will facilitate further mechanistic investigations in mice as opposed to rats.
The two techniques most often used to assess GI motility, carmine red gavage and rectal bead latency, did not reveal significant differences between malnourished and healthy young adult mice. Given the previously reported role of rodent sex steroid hormones on gastric emptying and GI transit,46 we might have increased our ability to detect subtle motility changes among young adult female mice had we controlled for estrous cycle fluctuations. Nonetheless, first appearance of red in a fecal pellet and expulsion time of a bead from the distal colon are crude and incomplete evaluations of whole GI transit and large bowel motility, respectively. We used an adaptation of the FITC-dextran technique recently validated in neonatal mice29 to facilitate the detection of subtle changes in upper GI motility. These models highlight a novel role of host nutritional status in the regulation of GI motility and will serve as important tools to further explore mechanisms underlying these effects.
Smooth muscle atrophy was not observed in any of our malnourished models, except for the trend toward thin gastric muscularis in TmSep pups. Similarly, preliminary examination of stained myenteric plexus did not reveal any obvious neurochemical or architectural differences between our malnourished models and their controls. Given that sufficient smooth muscle mass and an intact enteric nervous system are required for normal propulsive transit, these results are consistent with our unexpected finding of increased contractile activity at baseline and following cholinergic stimulation in duodenal segments from LPLFD males. It is possible that increased cholinergic responses compensate for other prokinetic signals that are diminished. For example, we previously reported that plasma serotonin and luminal bile acids are depleted in TmSep pups.19 We cannot exclude the possibility that strong but poorly-coordinated contractions contribute to malnutrition-induced dysmotility. Because the smooth muscle and enteric ganglia appear to be intact, one might hypothesize that refeeding the malnourished mice would normalize the dysmotility as soon as the underlying metabolic, hormonal, or other signaling abnormalities are corrected. If true, this finding would provide hope that treating malnutrition-induced dysmotility might not require extensive smooth muscle mass accumulation or restructuring of the enteric nervous system. However, our broad initial characterization might have missed subtle changes in enteric nervous system structure; more detailed analyses of the various neurochemical subtypes of the enteric nervous system and their activity are required in future studies to adequately address the involvement of the enteric nervous system in malnutrition-associated dysmotility.
Our finding that malnutrition increases gut barrier permeability confirms a previous study that reported increased translocation of FITC across jejunal sections from malnourished mice using a similar model of malnutrition.28 Our results extend these findings to duodenal and proximal colon (but not distal colon) segments, and to young adult males but not females. It remains unclear whether increased gut permeability influences motility in our LPLFD models, although increased gut permeability is associated with increased symptom severity in a recent study of adults with irritable bowel syndrome.47
Unsurprisingly, we found gut microbial community composition to be altered in each mouse model of malnutrition, confirming our previous results with TmSep pups26,27 and extending these data to our LPLFD pup and young adult malnourished models. Gut microbiota changes are associated with increased barrier permeability, altered GI transit times, and numerous other pathophysiologies that underlie functional GI disorders.23 Whether microbiota alterations promote or simply result from the altered intestinal niche in malnutrition, and whether our observed sex-specific gut microbiota alterations drive any aspect of malnutrition-associated GI pathophysiology, remains unknown. We are further investigating these models with mechanistic studies that seek to define a potentially causative role of gut microbiota changes in malnutrition-induced GI pathophysiology.
It has been hypothesized that dysmotility in malnutrition may reduce food intake by promoting abdominal pain and decreasing hunger. We did not observe this phenomenon in our young adult models of malnutrition. Consistent with previous reports using similarly aged C57BL/6J mice,48 we observed relatively constant chow consumption over time, with the exception of a small number of outlying days on which all groups simultaneously had decreased chow intake in the absence of an identifiable stressor. Surprisingly, LPLFD young adults consumed increased feed per gram body weight compared to mice receiving isocaloric control chow, suggesting that other metabolic abnormalities contribute to growth faltering in these models. We cannot exclude the possibility that malnourished pups consume less milk than control pups, given the impaired gastric emptying in TmSep pups and the shrunken stomachs in LPLFD pups which might not be able to accommodate a full feed. Additional techniques must be developed to monitor rates of milk intake in malnourished neonatal mice. Alternatively, slow GI motility might act as a host adaptation to malnutrition, given that slowing the rate of transit of ingested food could increase its contact time with the intestinal epithelium, thereby increasing opportunities for absorption of scarce nutrients. Furthermore, preservation of female body mass to maintain healthy endocrine and reproductive axes,49 thereby maintaining species fitness during periods of famine, offers a possible evolutionary explanation for our observation of delayed gastric emptying in malnourished young adult females but not males. This intriguing hypothesis requires additional investigation.
The most striking and unexpected finding from these studies is the sexual dimorphism that results from malnutrition. Our data show that sex differences are present with respect to anthropometric indices, gastric emptying, and gross and histologic stomach appearance. The exaggerated contractile activity and increased barrier permeability observed in LPLFD males is completely absent in LPLFD females. These sex differences are prominent even without controlling experiments for various stages of the estrous cycle. It is unclear why LPLFD females have delayed gastric emptying, yet do not exhibit the same alterations in contractile activity and barrier permeability found in LPLFD males. Females have a higher prevalence of irritable bowel syndrome and certain motility disorders including gastroparesis compared to males,50,51 although mechanisms underlying these sex differences are poorly understood. In mice, GI transit times of female and male mice differ not only at baseline, but also in their responses to high-fat chow and to the 5-HT3 receptor antagonist, alosetron.52 We recently showed that motility indices are identical in healthy male and female neonatal mice, that sex differences emerge soon after puberty, and that motility is more sensitive to numerous variables including the time of day at which motility testing is performed in females compared to males.29 Future studies will use these models to help determine the mechanistic basis of these sex differences, the specific role host nutritional status plays in GI dysmotility including any structural or neurochemical or functional changes in the malnourished enteric nervous system, and the potential contributions of sex and nutritional status to pathophysiology in functional GI disorders.
Supplementary Material
ACKNOWLEDGEMENTS
This study was supported by the American Neurogastroenterology and Motility Society Research Grants Program (Research Grant to GAP), the American Gastroenterological Association/Rome Foundation (Functional GI and Motility Disorders Pilot Research Award to GAP), the Public Health Service, USA (P30 DK056338, which funds the Texas Medical Center Digestive Diseases Center), and the National Institutes of Health, USA (K08 DK113114 to GAP; T32 DK007664 training grant to PND and PTE). Portions of this work have been published previously in abstract form.53-55
Footnotes
DISCLOSURES
No competing interests declared.
REFERENCES
- 1.Global Burden of Disease Risk Factor Collaborators, Forouzanfar MH, Alexander L, et al. Global, regional, and national comparative risk assessment of 79 behavioural, environmental and occupational, and metabolic risks or clusters of risks in 188 countries, 1990-2013: a systematic analysis for the Global Burden of Disease Study 2013. Lancet 2015;386:2287–323. [DOI] [PMC free article] [PubMed] [Google Scholar]
- 2.United Nations Children's Fund (UNICEF), World Health Organization (WHO), The World Bank Group Joint child malnutrition estimates - Levels and trends (2018 edition). Geneva: UNICEF-WHO-The World Bank Group; 2018. [Google Scholar]
- 3.Guerrant RL, Oria RB, Moore SR, Oria MO, Lima AA. Malnutrition as an enteric infectious disease with long-term effects on child development. Nutr Rev 2008;66:487–505. [DOI] [PMC free article] [PubMed] [Google Scholar]
- 4.Velly H, Britton RA, Preidis GA. Mechanisms of cross-talk between the diet, the intestinal microbiome, and the undernourished host. Gut Microbes 2017;8:98–112. [DOI] [PMC free article] [PubMed] [Google Scholar]
- 5.Kowalski R Roentgenologic studies of the alimentary tract in kwashiorkor. Am J Roentgenol Radium Ther Nucl Med 1967;100:100–12. [DOI] [PubMed] [Google Scholar]
- 6.Redmond AO, Kaschula RO, Freeseman C, Hansen JD. The colon in kwashiorkor. Arch Dis Child 1971;46:470–3. [DOI] [PMC free article] [PubMed] [Google Scholar]
- 7.Viteri FE, Schneider RE. Gastrointestinal alterations in protein-calorie malnutrition. Med Clin North Am 1974;58:1487–505. [DOI] [PubMed] [Google Scholar]
- 8.Robel-Tillig E, Vogtmann C, Bennek J. Prenatal hemodynamic disturbances -- pathophysiological background of intestinal motility disturbances in small for gestational age infants. Eur J Pediatr Surg 2002;12:175–9. [DOI] [PubMed] [Google Scholar]
- 9.Robel-Tillig E, Knupfer M, Pulzer F, Vogtmann C. Blood flow parameters of the superior mesenteric artery as an early predictor of intestinal dysmotility in preterm infants. Pediatr Radiol 2004;34:958–62. [DOI] [PubMed] [Google Scholar]
- 10.Dubois A, Gross HA, Ebert MH, Castell DO. Altered gastric emptying and secretion in primary anorexia nervosa. Gastroenterology 1979;77:319–23. [PubMed] [Google Scholar]
- 11.McCallum RW, Grill BB, Lange R, Planky M, Glass EE, Greenfeld DG. Definition of a gastric emptying abnormality in patients with anorexia nervosa. Dig Dis Sci 1985;30:713–22. [DOI] [PubMed] [Google Scholar]
- 12.Stacher G, Kiss A, Wiesnagrotzki S, Bergmann H, Hobart J, Schneider C. Oesophageal and gastric motility disorders in patients categorised as having primary anorexia nervosa. Gut 1986;27:1120–6. [DOI] [PMC free article] [PubMed] [Google Scholar]
- 13.Abell TL, Malagelada JR, Lucas AR, et al. Gastric electromechanical and neurohormonal function in anorexia nervosa. Gastroenterology 1987;93:958–65. [DOI] [PubMed] [Google Scholar]
- 14.Kamal N, Chami T, Andersen A, Rosell FA, Schuster MM, Whitehead WE. Delayed gastrointestinal transit times in anorexia nervosa and bulimia nervosa. Gastroenterology 1991;101:1320–4. [DOI] [PubMed] [Google Scholar]
- 15.Parkman HP, Yates KP, Hasler WL, et al. Dietary intake and nutritional deficiencies in patients with diabetic or idiopathic gastroparesis. Gastroenterology 2011;141:486–98, 98 e1–7. [DOI] [PMC free article] [PubMed] [Google Scholar]
- 16.Bharadwaj S, Meka K, Tandon P, et al. Management of gastroparesis-associated malnutrition. J Dig Dis 2016;17:285–94. [DOI] [PubMed] [Google Scholar]
- 17.Byrne WJ, Cipel L, Euler AR, Halpin TC, Ament ME. Chronic idiopathic intestinal pseudo-obstruction syndrome in children--clinical characteristics and prognosis. J Pediatr 1977;90:585–9. [DOI] [PubMed] [Google Scholar]
- 18.Goulet O, Talbotec C, Jan D, Ricour C. Nutritional management of pediatric patients with chronic intestinal pseudo-obstruction syndrome. J Pediatr Gastroenterol Nutr 2001;32 Suppl 1:S44–7. [DOI] [PubMed] [Google Scholar]
- 19.Preidis GA, Keaton MA, Campeau PM, Bessard BC, Conner ME, Hotez PJ. The undernourished neonatal mouse metabolome reveals evidence of liver and biliary dysfunction, inflammation, and oxidative stress. J Nutr 2014;144:273–81. [DOI] [PMC free article] [PubMed] [Google Scholar]
- 20.Teodosio NR, Lago ES, Romani SA, Guedes RC. A regional basic diet from northeast Brazil as a dietary model of experimental malnutrition. Arch Latinoam Nutr 1990;40:533–47. [PubMed] [Google Scholar]
- 21.Maier EA, Weage KJ, Guedes MM, et al. Protein-energy malnutrition alters IgA responses to rotavirus vaccination and infection but does not impair vaccine efficacy in mice. Vaccine 2013;32:48–53. [DOI] [PMC free article] [PubMed] [Google Scholar]
- 22.Browning KN, Travagli RA. Central control of gastrointestinal motility. Curr Opin Endocrinol Diabetes Obes 2019;26:11–6. [DOI] [PMC free article] [PubMed] [Google Scholar]
- 23.Shin A, Preidis GA, Shulman R, Kashyap PC. The Gut Microbiome in Adult and Pediatric Functional Gastrointestinal Disorders. Clin Gastroenterol Hepatol 2019;17:256–74. [DOI] [PMC free article] [PubMed] [Google Scholar]
- 24.Sanders KM, Koh SD, Ro S, Ward SM. Regulation of gastrointestinal motility--insights from smooth muscle biology. Nat Rev Gastroenterol Hepatol 2012;9:633–45. [DOI] [PMC free article] [PubMed] [Google Scholar]
- 25.Hoogerwerf WA. Role of clock genes in gastrointestinal motility. Am J Physiol Gastrointest Liver Physiol 2010;299:G549–55. [DOI] [PMC free article] [PubMed] [Google Scholar]
- 26.Preidis GA, Ajami NJ, Wong MC, Bessard BC, Conner ME, Petrosino JF. Composition and function of the undernourished neonatal mouse intestinal microbiome. J Nutr Biochem 2015;26:1050–7. [DOI] [PubMed] [Google Scholar]
- 27.Preidis GA, Ajami NJ, Wong MC, Bessard BC, Conner ME, Petrosino JF. Microbial-Derived Metabolites Reflect an Altered Intestinal Microbiota during Catch-Up Growth in Undernourished Neonatal Mice. J Nutr 2016;146:940–8. [DOI] [PMC free article] [PubMed] [Google Scholar]
- 28.Ueno PM, Oria RB, Maier EA, et al. Alanyl-glutamine promotes intestinal epithelial cell homeostasis in vitro and in a murine model of weanling undernutrition. Am J Physiol Gastrointest Liver Physiol 2011;301:G612–22. [DOI] [PMC free article] [PubMed] [Google Scholar]
- 29.Soni KG, Halder T, Conner ME, Preidis GA. Sexual dimorphism in upper gastrointestinal motility is dependent on duration of fast, time of day, age, and strain of mice. Neurogastroenterol Motil 2019;31:e13654. [DOI] [PMC free article] [PubMed] [Google Scholar]
- 30.Tasselli M, Chaumette T, Paillusson S, et al. Effects of oral administration of rotenone on gastrointestinal functions in mice. Neurogastroenterol Motil 2013;25:e183–93. [DOI] [PubMed] [Google Scholar]
- 31.Gombash SE, Cowley CJ, Fitzgerald JA, et al. SMN deficiency disrupts gastrointestinal and enteric nervous system function in mice. Hum Mol Genet 2015;24:3847–60. [DOI] [PMC free article] [PubMed] [Google Scholar]
- 32.Lichtenberger LM, Bhattarai D, Phan TM, Dial EJ, Uray K. Suppression of contractile activity in the small intestine by indomethacin and omeprazole. Am J Physiol Gastrointest Liver Physiol 2015;308:G785–93. [DOI] [PMC free article] [PubMed] [Google Scholar]
- 33.Chu J, Miller CT, Kislitsyna K, et al. Decreased myosin phosphatase target subunit 1(MYPT1) phosphorylation via attenuated rho kinase and zipper-interacting kinase activities in edematous intestinal smooth muscle. Neurogastroenterol Motil 2012;24:257–66, e109. [DOI] [PMC free article] [PubMed] [Google Scholar]
- 34.Caporaso JG, Kuczynski J, Stombaugh J, et al. QIIME allows analysis of high-throughput community sequencing data. Nat Methods 2010;7:335–6. [DOI] [PMC free article] [PubMed] [Google Scholar]
- 35.Edgar RC. UPARSE: highly accurate OTU sequences from microbial amplicon reads. Nat Methods 2013;10:996–8. [DOI] [PubMed] [Google Scholar]
- 36.Quast C, Pruesse E, Yilmaz P, et al. The SILVA ribosomal RNA gene database project: improved data processing and web-based tools. Nucleic Acids Res 2013;41:D590–6. [DOI] [PMC free article] [PubMed] [Google Scholar]
- 37.Genton L, Cani PD, Schrenzel J. Alterations of gut barrier and gut microbiota in food restriction, food deprivation and protein-energy wasting. Clin Nutr 2015;34:341–9. [DOI] [PubMed] [Google Scholar]
- 38.Nicklas W, Bisgaard M, Aalbaek B, Kuhnert P, Christensen H. Reclassification of Actinobacillus muris as Muribacter muris gen. nov., comb. nov. Int J Syst Evol Microbiol 2015;65:3344–51. [DOI] [PubMed] [Google Scholar]
- 39.Little TJ, Horowitz M, Feinle-Bisset C. Modulation by high-fat diets of gastrointestinal function and hormones associated with the regulation of energy intake: implications for the pathophysiology of obesity. Am J Clin Nutr 2007;86:531–41. [DOI] [PubMed] [Google Scholar]
- 40.Fu XY, Li Z, Zhang N, Yu HT, Wang SR, Liu JR. Effects of gastrointestinal motility on obesity. Nutr Metab (Lond) 2014;11:3. [DOI] [PMC free article] [PubMed] [Google Scholar]
- 41.Baudry C, Reichardt F, Marchix J, et al. Diet-induced obesity has neuroprotective effects in murine gastric enteric nervous system: involvement of leptin and glial cell line-derived neurotrophic factor. J Physiol 2012;590:533–44. [DOI] [PMC free article] [PubMed] [Google Scholar]
- 42.Izzo AA, Piscitelli F, Capasso R, et al. Peripheral endocannabinoid dysregulation in obesity: relation to intestinal motility and energy processing induced by food deprivation and refeeding. Br J Pharmacol 2009;158:451–61. [DOI] [PMC free article] [PubMed] [Google Scholar]
- 43.Tractenberg SG, Levandowski ML, de Azeredo LA, et al. An overview of maternal separation effects on behavioural outcomes in mice: Evidence from a four-stage methodological systematic review. Neurosci Biobehav Rev 2016;68:489–503. [DOI] [PubMed] [Google Scholar]
- 44.Orso R, Wearick-Silva LE, Creutzberg KC, et al. Maternal behavior of the mouse dam toward pups: implications for maternal separation model of early life stress. Stress 2018;21:19–27. [DOI] [PubMed] [Google Scholar]
- 45.Prusator DK, Greenwood-Van Meerveld B. Sex-related differences in pain behaviors following three early life stress paradigms. Biol Sex Differ 2016;7:29. [DOI] [PMC free article] [PubMed] [Google Scholar]
- 46.Chen TS, Doong ML, Chang FY, Lee SD, Wang PS. Effects of sex steroid hormones on gastric emptying and gastrointestinal transit in rats. Am J Physiol 1995;268:G171–6. [DOI] [PubMed] [Google Scholar]
- 47.Shulman RJ, Jarrett ME, Cain KC, Broussard EK, Heitkemper MM. Associations among gut permeability, inflammatory markers, and symptoms in patients with irritable bowel syndrome. J Gastroenterol 2014;49:1467–76. [DOI] [PMC free article] [PubMed] [Google Scholar]
- 48.Lang P, Hasselwander S, Li H, Xia N. Effects of different diets used in diet-induced obesity models on insulin resistance and vascular dysfunction in C57BL/6 mice. Sci Rep 2019;9:19556. [DOI] [PMC free article] [PubMed] [Google Scholar]
- 49.Boutari C, Pappas PD, Mintziori G, et al. The effect of underweight on female and male reproduction. Metabolism 2020;107:154229. [DOI] [PubMed] [Google Scholar]
- 50.Chang L, Toner BB, Fukudo S, et al. Gender, age, society, culture, and the patient’s perspective in the functional gastrointestinal disorders. Gastroenterology 2006;130:1435–46. [DOI] [PubMed] [Google Scholar]
- 51.Zia JK, Heitkemper MM. Upper Gastrointestinal Tract Motility Disorders in Women, Gastroparesis, and Gastroesophageal Reflux Disease. Gastroenterol Clin North Am 2016;45:239–51. [DOI] [PubMed] [Google Scholar]
- 52.France M, Skorich E, Kadrofske M, Swain GM, Galligan JJ. Sex-related differences in small intestinal transit and serotonin dynamics in high-fat-diet-induced obesity in mice. Exp Physiol 2016;101:81–99. [DOI] [PMC free article] [PubMed] [Google Scholar]
- 53.Soni KG, Edwards PT, Halder T, Conner ME, Preidis GA. Early postnatal malnutrition causes gastrointestinal dysmotility that is sexually dimorphic. Neurogastroenterol Motil 2019;31. [DOI] [PMC free article] [PubMed] [Google Scholar]
- 54.Preidis G, Soni K, Halder T, Conner M. Gastrointestinal dysmotility in neonatal malnutrition. Neurogastroenterol Motil 2018;30. [DOI] [PMC free article] [PubMed] [Google Scholar]
- 55.Preidis GA, Halder T, Shulman RJ, Conner ME. Mechanisms of intestinal dysmotility in undernutrition. Neurogastroenterol Motil 2016;28:92. [Google Scholar]
Associated Data
This section collects any data citations, data availability statements, or supplementary materials included in this article.


