Abstract.
Significance: Prenatal exposure to ethanol causes several morphological and neurobehavioral deficits. While there are some studies on the effects of ethanol exposure on blood flow, research focusing on acute changes in the microvasculature is limited.
Aim: The first aim of this study was to assess the dose-dependent changes in murine fetal brain microvasculature of developing fetuses in response to maternal alcohol consumption. The second aim was to quantify changes in vasculature occurring concurrently in the mother’s hindlimb and the fetus’s brain after maternal exposure to alcohol.
Approach: Correlation mapping optical coherence angiography was used to evaluate the effects of prenatal exposure to different doses of ethanol (3, 1.5, and ) on murine fetal brain vasculature in utero. Additionally, simultaneous imaging of maternal peripheral vessels and the fetal brain vasculature was performed to assess changes of the vasculature occurring concurrently in response to ethanol consumption.
Results: The fetal brain vessel diameters (VDs) decreased by , 30%, and 14% in response to ethanol doses of 3, 1.5, and , respectively. However, the mother’s hindlimb VD increased by 63% in response to ethanol at a dose of .
Conclusions: Results showed a dose-dependent reduction in vascular blood flow in fetal brain vessels when the mother was exposed to ethanol, whereas vessels in the maternal hindlimb exhibited concurrent vasodilation.
Keywords: optical coherence tomography, murine embryos, ethanol, brain vasculature
1. Introduction
No amount of alcohol is considered safe for developing fetuses,1–3 but the consumption of alcoholic beverages during pregnancy is still very common.4–7 Prenatal exposure to alcohol in any amount damages the developing fetus and cause congenital defects. In 1973, the stereotypic cluster of the craniofacial, brain, and growth deficits, collectively termed “fetal alcohol syndrome” was identified in infants born to mothers with heavy alcohol exposure during pregnancy.8,9 Since then, research has shown that prenatal exposure to alcohol causes a broad range of developmental defects, which are now termed fetal alcohol spectrum disorders (FASD) that refer to a range of abnormalities caused by prenatal alcohol exposure (PAE).10
The estimated global prevalence of FASD is 22.7 per 1000 births, and regional estimates can vary from 33.5 per 1000 births in the United States to 113.22 per 1000 births in South Africa.11 In general, 15% of all pregnancies end in spontaneous abortions, but that rate is as high as 45% for women who are heavy drinkers.12 Similarly, the number of stillbirths is six-times higher when the fetus is exposed to alcohol as compared to the healthy population.13 The severity of the defect or disorder depends on a variety of factors,14 but most importantly, the amount of alcohol consumed and the period of gestation during which alcohol was consumed. Other factors that can potentially increase the severity of the defect include concurrent smoking, environmental toxins, and socioeconomic factors.
Due to the prevalence of unplanned pregnancies in the United States15 and binge patterns of alcohol consumption,16 PAE in the first trimester is common. However, many women continue to consume alcohol well into their second trimester of pregnancy,17 which is a consumption pattern that includes the critical periods of both neurogenesis and angiogenesis. The majority of neurons of the adult brain are born during this period.18 Although PAE has significant detrimental effects on different organ systems, the central nervous system (CNS) is affected the most due to the extent of its developmental period and sensitivity to ethanol. Thus, to understand the effects of PAE on the developing brain, studying second-trimester exposure to alcohol is crucial. Several aspects of brain development altered by PAE that have been extensively studied include morphological, behavioral, and cognitive effects.19–29 In addition to neurons, the microvasculature in the brain also experiences significant development and growth during the second trimester. The microvasculature supports the nutritional needs of the developing fetus,30 provide endocrine control of fetal growth,31 and promote neural development.32 Although studies have evaluated changes in blood flow after PAE,33,34 acute changes in fetal brain vasculature have not been well documented due to the lack of techniques with sufficient resolution and penetration depth.
Over the past decade, optical coherence tomography (OCT)35 has rapidly gained popularity for small animal embryonic imaging.36 Due to its noninvasive nature, relatively high spatial and temporal resolutions, and its ability to provide cross-sectional images of live embryos with no exogenous contrast agents, OCT has been preferred over other imaging modalities such as histological staining,37,38 ultrasound biomicroscopy, micro-computed tomography, and micro-magnetic resonance imaging for live imaging of small mammal embryos.39 Angiographic OCT is a functional extension of OCT that was developed to image microvasculature.40–46 We have utilized angiographic OCT to assess the effects of prenatal exposure to one dose of ethanol,47 a synthetic cannabinoid,48 and nicotine on the fetal brain.49
This study uses correlation mapping optical coherence angiography (cm-OCA)50 to assess dose-dependent fetal brain vasculature changes due to maternal exposure to ethanol in a mouse model in utero. Results showed that the severity of vasoconstriction increased with dose. In addition, we also demonstrate assessment of both maternal and fetal vasculature changes due to maternal exposure to ethanol, where peripheral vessels in the mother showed vasodilation in contrast to fetal brain vasculature vasoconstriction.
2. Materials and Methods
2.1. OCT System
A phase-stabilized swept source OCT system (PhS-SSOCT) was used for angiographic imaging. In summary, the system composed of a broadband swept source laser source of central wavelength 1310 nm, scan rage of 150 nm, scan rate of 30 kHz, output power of 39 mW, axial resolution of in air, and lateral resolution of . A complete description of the system can be found in our previous publications.47,51
2.2. Animal Manipulation and Dosing
Detailed animal manipulation procedures are described in our previous work.49 In summary, pregnant CD-1 IGS mice (Crl: CD1{ICR}, Charles River Laboratories, Inc. Wilmington, MA) at gestational day 14.5 were anesthetized and placed on a heated surgical platform to maintain body temperature throughout the imaging procedure. Abdominal fur was removed, and an incision was made on the abdomen exposing the uterine horn for imaging. After stabilization, initial OCT images of the fetal brain were recorded. The mother was then administered the corresponding dose of ethanol via intragastric gavage. Subsequent OCT measurements were taken for a period of 45 min at 5-min intervals. The uterus was hydrated with phosphate-buffered saline 1 min before every measurement.
Our first study evaluating the effects of ethanol on the fetal brain used ethanol at a dose of 47 to simulate binge drinking in humans. At this dose, severe vasoconstriction was observed in the fetal brain within 45 min of exposure. Hence, in this study, two lower doses of ethanol, 1.5 and , were used to evaluate the effects of dose on the murine fetal brain vasculature. Sham (control) experiments were performed utilizing distilled water because the ethanol was diluted in distilled water.
There were a total number of six samples in the sham group, three samples in the ethanol group, four samples in the of ethanol group, and five samples in the of ethanol group. The number of the samples refers to the number of separate fetuses from separate pregnancies. Additionally, three mice were used to study the effect of a dose of on the maternal peripheral and fetal brain blood vessels simultaneously.
2.3. Mother and Fetus Comparisons
Since there is a paucity of research on the acute changes in the developing fetal brain vasculature after maternal ethanol consumption, we simultaneously assessed the effects of maternal alcohol consumption on both the mother and the fetus. Ethanol has different effects on blood vessels based on the location of the vessel in the body, so vessels on the skin of the hind limb of the mother were imaged with the mother in a supine position. This location was chosen because the peripheral vessels on the forearm in humans are known to dilate when exposed to alcohol.52 Since the forelimb of the mother was relatively difficult to image due to the surgical procedures on the abdominal cavity, the peripheral vessels on the hindlimb were imaged instead.
A dose of of ethanol was tested on three mice. Instead of the aforementioned procedure where the fetal brain was imaged every 5 min for 45 min after maternal ethanol consumption, imaging was performed after 30 min to ensure proper imaging of the peripheral blood vessels of the mother and fetal brain. Results from this group were compared to the sham group, where the mother was administered lactated Ringer’s instead of ethanol.
2.4. Imaging, Quantifications, and Statistics
The 3D OCT images consisted of B-scans with 600 A-scans each, and a total of 600 B-scans per volume. Five B-scans were recorded at each spatial position to perform angiographic imaging. A total area of of the fetal brain was imaged. The total acquisition time for each dataset was 84 s, including scanning mirror flyback time. A correlation mapping cm-OCA algorithm was used to obtain the vasculature maps from the acquired OCT images.50 A discrete Fourier transform-based sub-pixel registration technique was used to correct the axial shift caused due to bulk motion between each pair of 5 B-scans that were recorded at the same spatial position.53 The temporal correlation for each frame with the reference frame was calculated and averaged. The threshold was then determined as the average of the mean correlation values minus the standard deviations of the mean correlations. The SNR-dependent artifacts were corrected using the temporal variance of the background noise as a function of imaging depth.50 The 3D vasculature maps were obtained by mapping the temporal correlation coefficients of the entire 3D image. A maximum intensity projection (MIP) was calculated to obtain the en face images of the dorsal surface arterial blood vessels on the fetal brain. A frequency rejection filter54 was applied to the 2D MIPs to remove bulk motion artifacts due to maternal respiration and heartbeat. Amira software (EFI Co., Portland, Oregon) was used for denoising and to form final MIPs.
All quantifications were performed on the MIP images, and vessel diameter (VD) was used to quantify the changes in vasculature. Amira was used to perform the quantifications. All VD quantifications were performed on the main branch of the vessel. The results in this study also include images and quantifications from fetuses that were exposed to ethanol at a dose of from our previously published data.47 However, since this study uses a different angiography algorithm, the data were reprocessed using the current cm-OCA algorithm.
For the dose-response study, two nonparametric Kruskal–Wallis ANOVAs were performed to assess the effects of different doses and time on the vasculature. This was followed by two-sided Mann–Whitney tests that were performed to test for statistically significant changes between every ethanol group and the sham group (three pairs) and between the three ethanol groups (three pairs). Thus, there were a total of six pairwise Mann–Whitney tests that were performed. Bonferroni correction was included in this case for multiple pair-wise tests.
For the mother and fetus comparisons, Mann–Whitney tests were performed to test for statistically significant changes between the ethanol and sham groups of the mother and between the ethanol and sham groups of the fetuses.
3. Results
3.1. Dose-Response Analysis
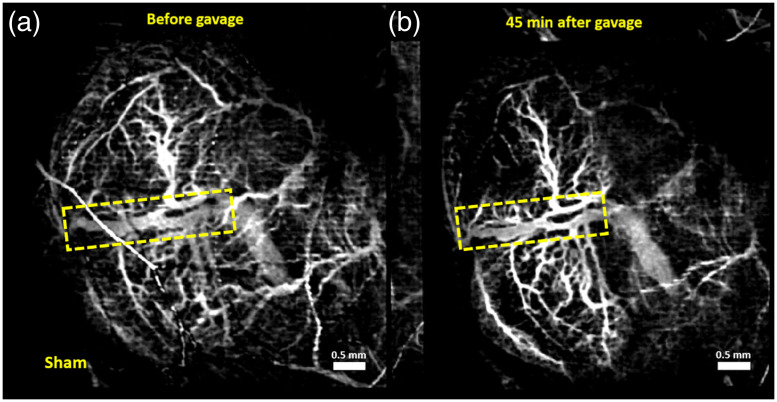
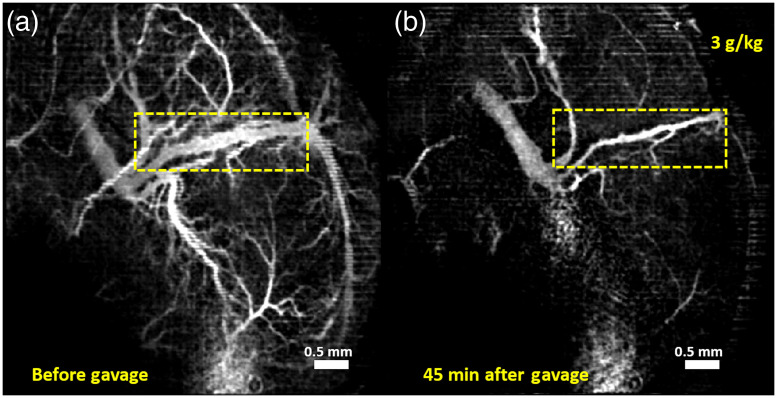
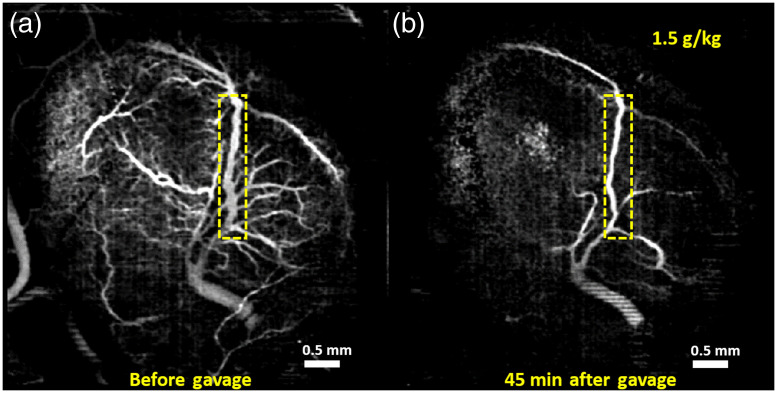
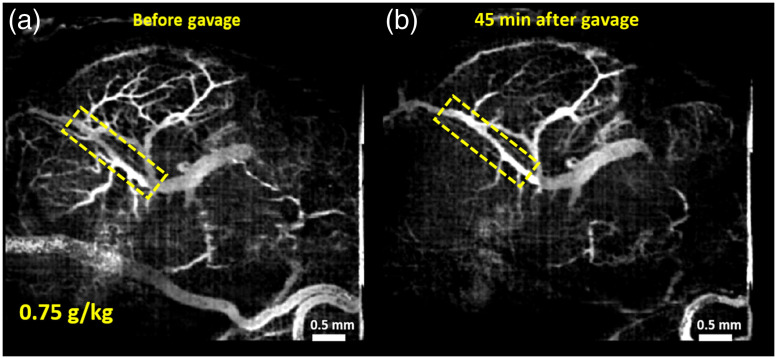
Vasculature images of one typical example from each of the groups are shown here. Figures 1–4 show MIPs of 3D cm-OCA images before and 45 min after gavage with distilled water (sham), and ethanol at doses of 3, 1.5, and , respectively.
Fig. 1.
MIPs of cm-OCA images of murine fetal brain vasculature (a) before and (b) 45 min after maternal exposure to distilled water. The dashed rectangle shows the main branch of the vessel on which the quantifications were performed.
Fig. 2.
MIPs of cm-OCA images of murine fetal brain vasculature (a) before and (b) 45 min after maternal exposure to ethanol at a dose of . The dashed rectangle shows the main branch of the vessel on which the quantifications were performed.
Fig. 3.
MIPs of cm-OCA images of murine fetal brain vasculature (a) before and (b) 45 min after maternal exposure to ethanol at a dose of . The dashed rectangle shows the main branch of the vessel on which the quantifications were performed.
Fig. 4.
MIPs of cm-OCA images of murine fetal brain vasculature (a) before and (b) 45 min after maternal exposure to ethanol at a dose of . The dashed rectangle shows the main branch of the vessel on which the quantifications were performed.
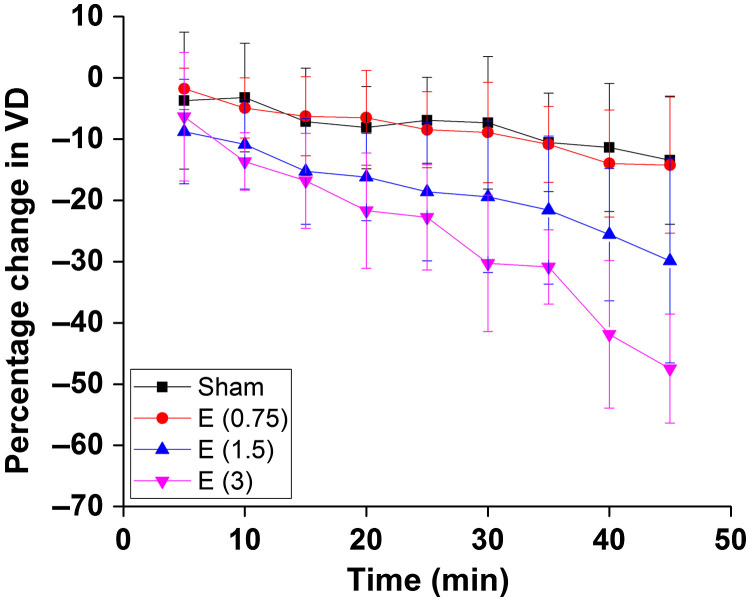
All three doses of ethanol showed dose-dependent vasoconstriction. Figure 5 shows the percentage change in VD for a period of 45 min at 5 min intervals where the pre-gavage measurement was used for comparison for that given dose. All samples from all four groups were used for these calculations. The plot depicts the inter-sample means and standard deviations. While the sham group and ethanol at a dose of showed similar trends, the greater doses of 1.5 and , ethanol exposure resulted in dose-dependent vasoconstriction.
Fig. 5.
Percentage change in VD after exposure, every 5 min for 45 min. The error bars represent the standard deviation.
The Kruskal–Wallis ANOVAs showed that the dose and time had statistically significant effects on the VD. The results of the Kruskal–Wallis ANOVAs are given in Table 1.
Table 1.
Results of the Kruskal–Wallis ANOVAs. DF represents the degrees of freedom.
| DF | value | value | |
|---|---|---|---|
| Time | 8 | 34.84 | |
| Dose | 3 | 54.45 |
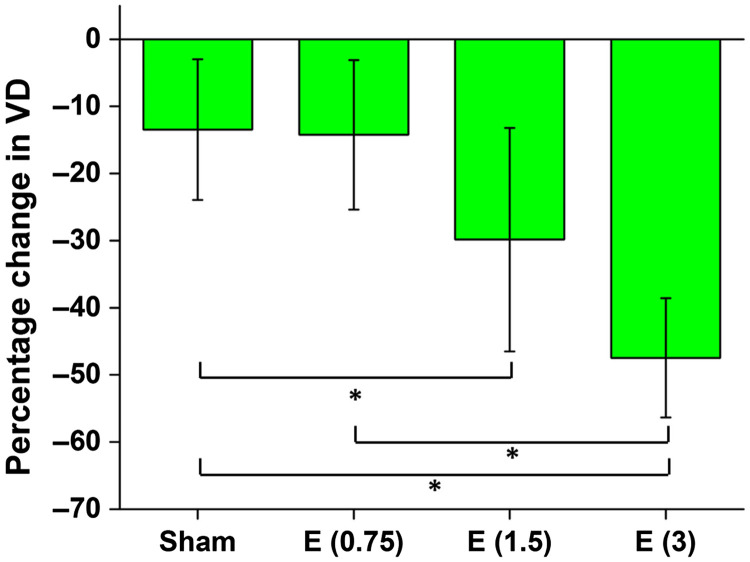
Figure 6 shows the dose-dependent changes in the fetal brain VD 45 min after maternal exposure. The inter-sample averages and standard deviations are plotted. The results from the ethanol groups were compared to results from distilled water (sham) and to each other, and the statistically significant results ( after Bonferonni correction) are shown by the asterisks.
Fig. 6.
Percentage change in VD 45 min after maternal exposure to water (sham), and 16.6% ethanol at doses 0.75, 1.5, and . The asterisk indicates using a two-sided Mann–Whitney test.
Six two-sided Mann–Whitney tests were performed between each of the groups for pair-wise testing. A statistically significant difference was found between the sham group and the ethanol group, between the sham group and the ethanol group, and between the 0.75 and ethanol groups. Table 2 shows the results from the six pair-wise Mann–Whitney tests. values in bold indicate statistical significance after Bonferroni correction for multiple tests ().
Table 2.
Summary of the Mann–Whitney tests. values in bold indicate statistical significance ( after Bonferroni correction for multiple tests). and are the number of samples in group 1 and 2 being compared. is the test statistic, and indicates the criterion for statistical significance.
| Test | ||||
|---|---|---|---|---|
| Sham versus 0.75 | 18 | 15 | 132 | 0.9 |
| Sham versus | 18 | 12 | 173.5 | 0.005 |
| Sham versus | 18 | 9 | 162 | |
| versus | 15 | 12 | 141 | 0.013 |
| versus | 15 | 9 | 135 | |
| versus | 12 | 9 | 86 | 0.025 |
3.2. Comparison of Acute Vasculature Changes in the Mother and the Fetus
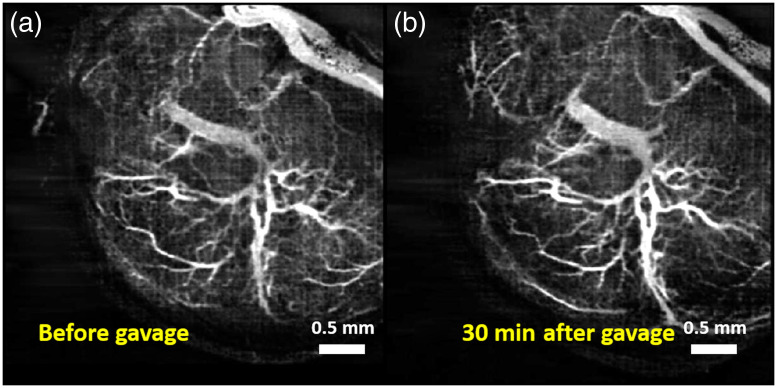
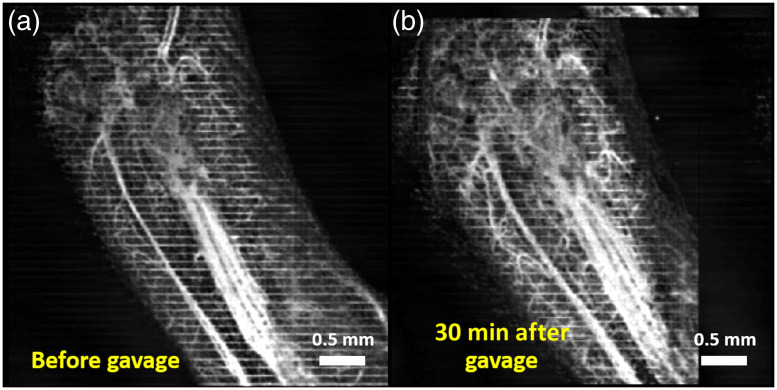
Figures 7(a) and 7(b) show MIPs of 3D cm-OCA images of the fetal brain before and 30 min after exposure to lactated Ringer’s, respectively. Figures 8(a) and 8(b) show MIPs of 3D cm-OCA images of the mother’s skin on her hindlimb before and 30 min after exposure to lactated Ringer’s, respectively. No significant change in vasculature was seen in the results from the fetus and the mother.
Fig. 7.
MIP of cm-OCA images of fetal brain vasculature (a) before and (b) 30 min after maternal exposure to lactated Ringer’s at a dose of .
Fig. 8.
MIP of cm-OCA images of the hindlimb of the mother (a) before and (b) 45 min after maternal exposure to lactated Ringer’s at a dose of .
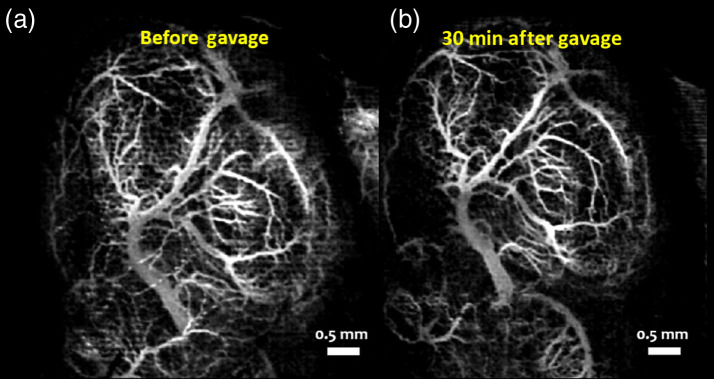
Figures 9(a) and 9(b) show MIPs of 3D cm-OCA images of the fetal brain before and 30 min after exposure to ethanol, respectively. Similar to results shown in Figs. 2 and 3, a drastic vasoconstriction was seen in the fetal brain within 30 min of ethanol exposure.
Fig. 9.
MIP of cm-OCA images of fetal brain vasculature (a) before and (b) 30 min after maternal exposure to ethanol.
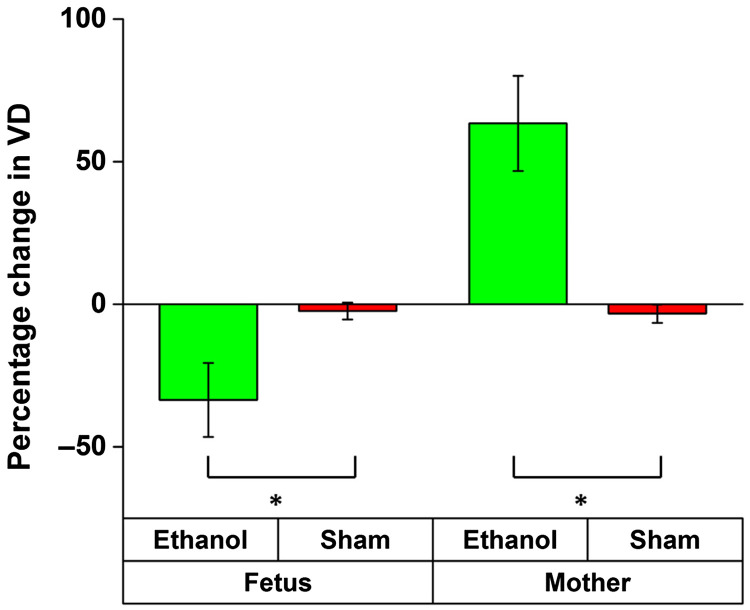
Figures 10(a) and 10(b) show MIPs of 3D cm-OCA images of the mother’s skin on her hindlimb before and 30 min after ethanol exposure, respectively. Drastic vasodilation was observed, which is in contrast to the vasoconstriction seen in the fetal brain. These results are similar to previous studies in humans where vasodilation was seen in forearm skin, whereas vasoconstriction was noticed in the underlying muscle.52
Fig. 10.
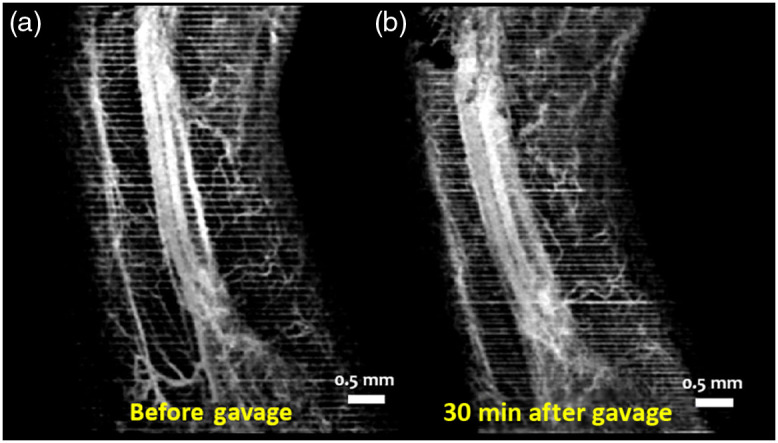
MIP of cm-OCA images of the hindlimb of the mother (a) before and (b) 45 min after maternal exposure to ethanol.
Figure 11 plots the comparison of percentage changes in VD at 45 min after exposure. The results from the ethanol groups were compared to results from the sham group from the mother and fetus, respectively. The inter-sample averages and standard deviations of percentage change in VD were plotted.
Fig. 11.
Comparison between percentage change in VD 30 min after exposure to ethanol and lactated Ringer’s. The asterisk indicates using a two-sided Mann–Whitney test.
Results from Mann–Whitney tests performed to compare results from the ethanol and sham samples in the mother and fetus groups, respectively, are shown in Table 3.
Table 3.
Summary of the Mann–Whitney tests. values in bold indicate statistical significance. and are the number of samples in the ethanol and sham groups. is the test statistic and indicates the criterion for statistical significance.
| Fetus | 9 | 9 | 81 | |
| Mother | 9 | 9 | 0 |
4. Discussion
Alcohol and a number of other teratogens inhibit CNS development, which is an effect that is often associated with inhibition of neurogenesis. However, since the neurogenic period is also a critical period of angiogenesis,30 neuro-vascular development may be equally drastically affected by teratogen exposure during this period of gestation. In this study, we assessed acute dose-dependent changes in the murine fetal brain vasculature after maternal exposure to ethanol. Two doses (0.75 and ), in addition to a dose reported in our earlier study (), were tested. Results showed an expected reduction in vasculature with higher doses, and overall, a reduction in vasoconstriction correlated with a reduction in the dose administered. In addition, this work also presented results comparing simultaneous vasculature changes in the peripheral vessels of the mother and the fetal brain vessels after maternal exposure to ethanol. Results showed a drastic reduction in fetal brain VD, whereas the peripheral vessels of the mother dilated.
Previous studies have shown that chronic alcohol exposure diminishes the relaxation of uterine artery in response to acetylcholine.55 However, the acute response of maternal blood vessels during pregnancy has not been assessed. Therefore, our data showing that maternal peripheral vessels undergo vasodilation whereas fetal cerebral vasculature undergoes acute vasoconstriction supports a hypothesis that acute alcohol exposure results in decreased blood pressure in the mother, which along with decreased blood flow to the fetal brain, is likely to significantly diminish nutrition supply during the critical window of fetal neurogenesis.
The decrease in VD observed in the sham group could be due to various factors such as prolonged exposure to isoflurane anesthesia or due to partial occlusion of the uterine vasculature while immobilizing the uterus and fetuses. However, since these factors are common procedures used in all samples, we can safely assume that the influence is similar in all samples and that any differences in results are due to the differences in administered drugs (or shams).
The previous study utilized a speckle variance algorithm to obtain vasculature maps,47 whereas this study utilized cm-OCA.50 Hence, the dose data, as shown in Fig. 1, were reprocessed using the cm-OCA algorithm for consistent comparisons. Since the effects of immobilizing the uterus and anesthesia sometimes led to the disappearance of smaller tributaries, the main branch of the vessel was chosen for quantifications to ensure that no bias was introduced.
This study assessed acute changes in fetal brain vasculature and showed results for a period of 45 minutes only. To determine if the effects of maternal ethanol exposure are persistent we are presently conducting longitudinal studies. Our future studies will also ascertain if changes in the fetal and uterine blood flow, if any, are correlated. Our previous work has focused on acute exposures to individual teratogens.47–49 However, drug co-abuse is common56,57 and can occur with other risk factors, including maternal stress,58,59 cardiovascular,60 and metabolic disease.61 Hence, our future work will also involve studying these co-occurring factors and co-abuse of different drugs.
It should be noted that there are limitations to the current imaging technique. For example, system sensitivity, and sensitivity roll-off affects phase stability,62 which in turn affects the quality of the cm-OCA map. To improve the sensitivity, similar to all of our other studies, we ensured that the fetus was oriented in such a way that there was good visualization of the dorsal vessels in the brain. Our future work will involve a projection resolved algorithm63 to reduce the shadowing artifacts and to image deeper vessels. To enhance vessel contrast and connectivity, we also plan to use a phase correction scheme,50,64 a 2D Gabor wavelet filter,65 and faster imaging speeds to reduce the presence of bulk motion.
5. Conclusion
This study evaluated dose-dependent murine fetal brain vasculature changes due to maternal exposure to ethanol using in utero cm-OCA. Vasoconstriction was observed, and the extent of the effect reduced with a decrease in dose. In addition to this, results from simultaneous imaging of the mother’s peripheral vessels and the fetal brain vasculature to assess the effects of ethanol showed vasodilation in the mother and vasoconstriction in the fetus.
Acknowledgments
This work was funded in part by the National Institutes of Health (Grant Nos. 1R01HD086765, 9R01HD096335, 1R01HL146745, and P30EY007551). Manmohan Singh is supported by a fellowship from the Gulf Coast Consortia, on the NLM Training Program in Biomedical Informatics and Data Science under Grant No. T15LM007093.
Biographies
Raksha Raghunathan received her PhD in 2020 in biomedical engineering from the University of Houston. Currently, she works as a postdoctoral fellow in Dr. Kirill Larin’s Biomedical Optics Laboratory at the University of Houston. Her research interests include understanding the process of embryonic development and the effects of different teratogens on it, using noninvasive imaging methods.
Chih-Hao Liu earned his PhD from Professor Kirill Larin’s lab in the Department of Biomedical Engineering at the University of Houston. He currently works as an electro-optical engineer in the medical device industry. His research interests focus on instrumentation of optical coherence tomography technique (elastography), automated fringe analysis, tissue biomechanics, and imaging processing.
Amur Kouka obtained her undergraduate degree in 2019 in the Department of Natural Science and Mathematics at the University of Houston. Her research mainly focused on using OCT, an optical imaging technique to study embryonic development.
Manmohan Singh is current a postdoctoral fellow in Dr. Kirill Larin’s Biomedical Optics Laboratory at the University of Houston. He received his PhD in 2018 in biomedical engineering from the University of Houston. His research interests are focused on developing optical elastography modalities and image processing techniques to noninvasively detect diseases.
Rajesh C. Miranda is a professor of neuroscience and experimental therapeutics at Texas A&M University Health Science Center, College of Medicine. His research focuses on developmental neurobiology, neural stem cells, epigenetics, and drug abuse, with a specific emphasis on FASD. He received his PhD in neurobiology and biopsychology at the University of Rochester, Rochester, New York, in 1989 and completed postdoctoral training in neuroendocrinology at Columbia University, New York, NY. He joined the faculty at Texas A&M University in 1995.
Kirill V. Larin is a professor of biomedical engineering at the University of Houston. He received his MS degree in laser physics and mathematics from Saratov State University in 1995 and PhD in biomedical engineering from the University of Texas Medical Branch in Galveston (2002). He has published more than 170 papers in the field of biomedical optics and biophotonics. Larin is a fellow of SPIE (2015), OSA (2016), and AIMBE (2020).
Disclosures
None of the authors has relevant financial interests for the data presented in this paper.
Contributor Information
Raksha Raghunathan, Email: raksha.raghunathan@gmail.com.
Chih-Hao Liu, Email: uhliu1988@gmail.com.
Amur Kouka, Email: askouka@Central.UH.EDU.
Manmohan Singh, Email: msingh@swbell.net.
Rajesh C. Miranda, Email: rmiranda@tamu.edu.
Kirill V. Larin, Email: klarin@central.uh.edu.
References
- 1.Mamluk L., et al. , “Evidence of detrimental effects of prenatal alcohol exposure on offspring birthweight and neurodevelopment from a systematic review of quasi-experimental studies,” Int. J. Epidemiol. dyz272 (2020). 10.1093/ije/dyz272 [DOI] [PMC free article] [PubMed] [Google Scholar]
- 2.Muggli E., et al. , “Association between prenatal alcohol exposure and craniofacial shape of children at 12 months of age,” JAMA Pediatr. 171(8), 771–780 (2017). 10.1001/jamapediatrics.2017.0778 [DOI] [PMC free article] [PubMed] [Google Scholar]
- 3.Moreno M. A., “Prenatal alcohol exposure: no safe amount,” JAMA Pediatr. 171(8), 820 (2017). 10.1001/jamapediatrics.2017.1093 [DOI] [PubMed] [Google Scholar]
- 4.Ethen M. K., et al. , “Alcohol consumption by women before and during pregnancy,” Matern. Child Health J. 13(2), 274–285 (2009). 10.1007/s10995-008-0328-2 [DOI] [PMC free article] [PubMed] [Google Scholar]
- 5.McCormack C., et al. , “Prenatal alcohol consumption between conception and recognition of pregnancy,” Alcohol. Clin. Exp. Res. 41(2), 369–378 (2017). 10.1111/acer.13305 [DOI] [PubMed] [Google Scholar]
- 6.Mårdby A.-C., et al. , “Consumption of alcohol during pregnancy—a multinational European study,” Women Birth 30(4), e207–e213 (2017). 10.1016/j.wombi.2017.01.003 [DOI] [PubMed] [Google Scholar]
- 7.Skagerstrom J., Chang G., Nilsen P., “Predictors of drinking during pregnancy: a systematic review,” J. Womens Health 20(6), 901–913 (2011). 10.1089/jwh.2010.2216 [DOI] [PMC free article] [PubMed] [Google Scholar]
- 8.Jones K. L., et al. , “Pattern of malformation in offspring of chronic alcoholic mothers,” Lancet 301(7815), 1267–1271 (1973). 10.1016/S0140-6736(73)91291-9 [DOI] [PubMed] [Google Scholar]
- 9.Jones K., Smith D., “Recognition of the fetal alcohol syndrome in early infancy,” The Lancet 302(7836), 999–1001 (1973). 10.1016/S0140-6736(73)91092-1 [DOI] [PubMed] [Google Scholar]
- 10.Williams J. F., Smith V. C., “Fetal alcohol spectrum disorders,” Pediatrics 136(5), e1395 (2015). 10.1542/peds.2015-3113 [DOI] [PubMed] [Google Scholar]
- 11.Roozen S., et al. , “Worldwide prevalence of fetal alcohol spectrum disorders: a systematic literature review including meta-analysis,” Alcohol. Clin. Exp. Res. 40(1), 18–32 (2016). 10.1111/acer.12939 [DOI] [PubMed] [Google Scholar]
- 12.Hannigan J. H., Armant D. R., “Alcohol in pregnancy and neonatal outcome,” Semin. Neonatol. 5(3), 243–254 (2000). 10.1053/siny.2000.0027 [DOI] [PubMed] [Google Scholar]
- 13.Cornman-Homonoff J., et al. , “Heavy prenatal alcohol exposure and risk of stillbirth and preterm delivery,” J. Matern. Fetal Neonatal Med. 25(6), 860–863 (2012). 10.3109/14767058.2011.587559 [DOI] [PMC free article] [PubMed] [Google Scholar]
- 14.Balaraman S., et al. , “Plasma miRNA profiles in pregnant women predict infant outcomes following prenatal alcohol exposure,” PLoS One 11(11), e0165081 (2016). 10.1371/journal.pone.0165081 [DOI] [PMC free article] [PubMed] [Google Scholar]
- 15.Finer L. B., Zolna M. R., “Declines in unintended pregnancy in the United States, 2008–2011,” N. Engl. J. Med. 374(9), 843–852 (2016). 10.1056/NEJMsa1506575 [DOI] [PMC free article] [PubMed] [Google Scholar]
- 16.Fillmore M. T., Jude R., “Defining ‘binge’ drinking as five drinks per occasion or drinking to a. 08% BAC: which is more sensitive to risk?” Am. J. Addict. 20(5), 468–475 (2011). 10.1111/j.1521-0391.2011.00156.x [DOI] [PMC free article] [PubMed] [Google Scholar]
- 17.SAMHSA, “18 percent of pregnant women drink alcohol during early pregnancy,” NSDUH Report (2013).
- 18.Workman A. D., et al. , “Modeling transformations of neurodevelopmental sequences across mammalian species,” J. Neurosci. 33(17), 7368–7383 (2013). 10.1523/JNEUROSCI.5746-12.2013 [DOI] [PMC free article] [PubMed] [Google Scholar]
- 19.Camarillo C., Miranda R. C., “Ethanol exposure during neurogenesis induces persistent effects on neural maturation: evidence from an ex vivo model of fetal cerebral cortical neuroepithelial progenitor maturation,” Gene Expr. 14(3), 159–171 (2008). [PMC free article] [PubMed] [Google Scholar]
- 20.Santillano D. R., et al. , “Ethanol induces cell-cycle activity and reduces stem cell diversity to alter both regenerative capacity and differentiation potential of cerebral cortical neuroepithelial precursors,” BMC Neurosci. 6(1), 59 (2005). 10.1186/1471-2202-6-59 [DOI] [PMC free article] [PubMed] [Google Scholar]
- 21.Vangipuram S. D., et al. , “Ethanol increases fetal human neurosphere size and alters adhesion molecule gene expression,” Alcohol. Clin. Exp. Res. 32(2), 339–347 (2008). 10.1111/j.1530-0277.2007.00568.x [DOI] [PubMed] [Google Scholar]
- 22.Bearer C. F., “L1 cell adhesion molecule signal cascades: targets for ethanol developmental neurotoxicity,” Neurotoxicology 22(5), 625–633 (2001). 10.1016/S0161-813X(01)00034-1 [DOI] [PubMed] [Google Scholar]
- 23.Lebel C., Roussotte F., Sowell E. R., “Imaging the impact of prenatal alcohol exposure on the structure of the developing human brain,” Neuropsychol. Rev. 21(2), 102–118 (2011). 10.1007/s11065-011-9163-0 [DOI] [PMC free article] [PubMed] [Google Scholar]
- 24.Guerri C., Bazinet A., Riley E. P., “Foetal alcohol spectrum disorders and alterations in brain and behaviour,” Alcohol Alcohol. 44(2), 108–114 (2009). 10.1093/alcalc/agn105 [DOI] [PMC free article] [PubMed] [Google Scholar]
- 25.Mattson S. N., Riley E. P., “A review of the neurobehavioral deficits in children with fetal alcohol syndrome or prenatal exposure to alcohol,” Alcohol. Clin. Exp. Res. 22(2), 279–294 (1998). 10.1111/j.1530-0277.1998.tb03651.x [DOI] [PubMed] [Google Scholar]
- 26.Roebuck T. M., Mattson S. N., Riley E. P., “Behavioral and psychosocial profiles of alcohol-exposed children,” Alcohol. Clin. Exp. Res. 23, 1070–1076 (1999). 10.1111/j.1530-0277.1999.tb04227.x [DOI] [PubMed] [Google Scholar]
- 27.Carta M., Mameli M., Valenzuela C. F., “Alcohol potently modulates climbing neuron synapses: role of metabotropic glutamate receptors,” J. Neurosci. 26(7), 1906–1912 (2006). 10.1523/JNEUROSCI.4430-05.2006 [DOI] [PMC free article] [PubMed] [Google Scholar]
- 28.West J. R., et al. , “Alcohol-mediated Purkinje cell loss in the absence of hypoxemia during the third trimester in an ovine model system,” Alcohol. Clin. Exp. Res. 25(7), 1051–1057 (2001). 10.1111/j.1530-0277.2001.tb02316.x [DOI] [PubMed] [Google Scholar]
- 29.Sudheendran N., et al. , “Comparative assessments of the effects of alcohol exposure on fetal brain development using optical coherence tomography and ultrasound imaging,” J. Biomed. Opt. 18(2), 020506 (2013). 10.1117/1.JBO.18.2.020506 [DOI] [PMC free article] [PubMed] [Google Scholar]
- 30.Norman M. G., O’Kusky J. R., “The growth and development of microvasculature in human cerebral cortex,” J. Neuropathol. Exp. Neurol. 45(3), 222–232 (1986). 10.1097/00005072-198605000-00003 [DOI] [PubMed] [Google Scholar]
- 31.Fowden A. L., Forhead A. J., “Endocrine regulation of feto-placental growth,” Hormone Res. 72(5), 257–265 (2009). 10.1159/000245927 [DOI] [PubMed] [Google Scholar]
- 32.Tam S. J., Watts R. J., “Connecting vascular and nervous system development: angiogenesis and the blood-brain barrier,” Annu. Rev. Neurosci. 33, 379–408 (2010). 10.1146/annurev-neuro-060909-152829 [DOI] [PubMed] [Google Scholar]
- 33.Bake S., Tingling J. D., Miranda R. C., “Ethanol exposure during pregnancy persistently attenuates cranially directed blood flow in the developing fetus: evidence from ultrasound imaging in a murine second trimester equivalent model,” Alcohol. Clin. Exp. Res. 36(5), 748–758 (2012). 10.1111/j.1530-0277.2011.01676.x [DOI] [PMC free article] [PubMed] [Google Scholar]
- 34.Parnell S. E., et al. , “Chronic ethanol increases fetal cerebral blood flow specific to the ethanol-sensitive cerebellum under normoxaemic, hypercapnic and acidaemic conditions: ovine model,” Exp. Physiol. 92(5), 933–943 (2007). 10.1113/expphysiol.2007.038091 [DOI] [PubMed] [Google Scholar]
- 35.Huang D., et al. , “Optical coherence tomography,” Science 254(5035), 1178–1181 (1991). 10.1126/science.1957169 [DOI] [PMC free article] [PubMed] [Google Scholar]
- 36.Raghunathan R., et al. , “Optical coherence tomography for embryonic imaging: a review,” J. Biomed. Opt. 21(5), 050902 (2016). 10.1117/1.JBO.21.5.050902 [DOI] [PMC free article] [PubMed] [Google Scholar]
- 37.Sharpe J., et al. , “Optical projection tomography as a tool for 3D microscopy and gene expression studies,” Science 296(5567), 541–545 (2002). 10.1126/science.1068206 [DOI] [PubMed] [Google Scholar]
- 38.Walls J. R., et al. , “Three-dimensional analysis of vascular development in the mouse embryo,” PLoS One 3(8), e2853 (2008). 10.1371/journal.pone.0002853 [DOI] [PMC free article] [PubMed] [Google Scholar]
- 39.Dickinson M. E., “Multimodal imaging of mouse development: tools for the postgenomic era,” Dev. Dyn. 235(9), 2386–2400 (2006). 10.1002/dvdy.20889 [DOI] [PubMed] [Google Scholar]
- 40.Mahmud M. S., et al. , “Review of speckle and phase variance optical coherence tomography to visualize microvascular networks,” J. Biomed. Opt. 18(5), 050901 (2013). 10.1117/1.JBO.18.5.050901 [DOI] [PubMed] [Google Scholar]
- 41.Mariampillai A., et al. , “Speckle variance detection of microvasculature using swept-source optical coherence tomography,” Opt. Lett. 33(13), 1530–1532 (2008). 10.1364/OL.33.001530 [DOI] [PubMed] [Google Scholar]
- 42.Jonathan E., Enfield J., Leahy M. J., “Correlation mapping method for generating microcirculation morphology from optical coherence tomography (OCT) intensity images,” J. Biophotonics 4(9), 583–587 (2011). 10.1002/jbio.201000103 [DOI] [PubMed] [Google Scholar]
- 43.Wang R. K., et al. , “Three dimensional optical angiography,” Opt. Express 15(7), 4083–4097 (2007). 10.1364/OE.15.004083 [DOI] [PubMed] [Google Scholar]
- 44.An L., Qin J., Wang R. K., “Ultrahigh sensitive optical microangiography for in vivo imaging of microcirculations within human skin tissue beds,” Opt. Express 18(8), 8220–8228 (2010). 10.1364/OE.18.008220 [DOI] [PMC free article] [PubMed] [Google Scholar]
- 45.Lal C., et al. , “Feasibility of correlation mapping optical coherence tomography angiographic technique using a 200 kHz vertical-cavity surface-emitting laser source for in vivo microcirculation imaging applications,” Appl. Opt. 57(22), E224–E231 (2018). 10.1364/AO.57.00E224 [DOI] [PubMed] [Google Scholar]
- 46.Sudheendran N., et al. , “Speckle variance OCT imaging of the vasculature in live mammalian embryos,” Laser Phys. Lett. 8(3), 247–252 (2011). 10.1002/lapl.201010120 [DOI] [Google Scholar]
- 47.Raghunathan R., et al. , “Evaluating the effects of maternal alcohol consumption on murine fetal brain vasculature using optical coherence tomography,” J. Biophotonics 11(5), e201700238 (2018). 10.1002/jbio.201700238 [DOI] [PMC free article] [PubMed] [Google Scholar]
- 48.Raghunathan R., et al. , “Assessing the acute effects of prenatal synthetic cannabinoid exposure on murine fetal brain vasculature using optical coherence tomography,” J. Biophotonics 12(8), e201900050 (2019). 10.1002/jbio.201900050 [DOI] [PMC free article] [PubMed] [Google Scholar]
- 49.Raghunathan R., et al. , “Optical coherence tomography angiography to evaluate murine fetal brain vasculature changes caused by prenatal exposure to nicotine,” Biomed. Opt. Express 11(7), 3618–3632 (2020). 10.1364/BOE.394905 [DOI] [PMC free article] [PubMed] [Google Scholar]
- 50.Makita S., et al. , “Noise-immune complex correlation for optical coherence angiography based on standard and Jones matrix optical coherence tomography,” Biomed. Opt. Express 7(4), 1525–1548 (2016). 10.1364/BOE.7.001525 [DOI] [PMC free article] [PubMed] [Google Scholar]
- 51.Manapuram R. K., Manne V. G. R., Larin K. V., “Development of phase-stabilized swept-source OCT for the ultrasensitive quantification of microbubbles,” Laser Phys. 18(9), 1080–1086 (2008). 10.1134/S1054660X08090144 [DOI] [Google Scholar]
- 52.Fewings J. D., et al. , “The effects of ethyl alcohol on the blood vessels of the hand and forearm in man,” Br. J. Pharmacol. Chemother. 27(1), 93–106 (1966). 10.1111/j.1476-5381.1966.tb01644.x [DOI] [PMC free article] [PubMed] [Google Scholar]
- 53.Guizar-Sicairos M., Thurman S. T., Fienup J. R., “Efficient subpixel image registration algorithms,” Opt. Lett. 33(2), 156–158 (2008). 10.1364/OL.33.000156 [DOI] [PubMed] [Google Scholar]
- 54.Liu G., Wang R., “Stripe motion artifact suppression in phase-resolved OCT blood flow images of the human eye based on the frequency rejection filter,” Chin. Opt. Lett. 11(3), 031701 (2013). 10.3788/COL201311.031701 [DOI] [Google Scholar]
- 55.Subramanian K., et al. , “Chronic binge alcohol exposure during pregnancy impairs rat maternal uterine vascular function,” Alcohol. Clin. Exp. Res. 38(7), 1832–1838 (2014). 10.1111/acer.12431 [DOI] [PMC free article] [PubMed] [Google Scholar]
- 56.Falk D. E., Yi H.-Y., Hiller-Sturmhöfel S., “An epidemiologic analysis of co-occurring alcohol and tobacco use and disorders: findings from the National Epidemiologic Survey on alcohol and related conditions,” Alcohol Res. Health 29(3), 162 (2006). [PMC free article] [PubMed] [Google Scholar]
- 57.Kandel D., et al. , “Prevalence and demographic correlates of symptoms of last year dependence on alcohol, nicotine, marijuana and cocaine in the US population,” Drug Alcohol Depend. 44(1), 11–29 (1997). 10.1016/S0376-8716(96)01315-4 [DOI] [PubMed] [Google Scholar]
- 58.Ward I. L., et al. , “Fetal testosterone surge: specific modulations induced in male rats by maternal stress and/or alcohol consumption,” Hormones Behav. 43(5), 531–539 (2003). 10.1016/S0018-506X(03)00061-8 [DOI] [PubMed] [Google Scholar]
- 59.Schneider M. L., et al. , “The impact of prenatal stress, fetal alcohol exposure, or both on development: perspectives from a primate model,” Psychoneuroendocrinology 27(1), 285–298 (2002). 10.1016/S0306-4530(01)00050-6 [DOI] [PubMed] [Google Scholar]
- 60.Preedy V. R., Richardson P. J., “Ethanol induced cardiovascular disease,” Br. Med. Bull. 50(1), 152–163 (1994). 10.1093/oxfordjournals.bmb.a072873 [DOI] [PubMed] [Google Scholar]
- 61.Hoffman R., Goldfrank L., “Ethanol-associated metabolic disorders,” Emergency Med. Clin. N. Am. 7(4), 943–961 (1989). [PubMed] [Google Scholar]
- 62.Park B., et al. , “Real-time fiber-based multi-functional spectral-domain optical coherence tomography at 1.3 microm,” Opt. Express 13(11), 3931–3944 (2005). 10.1364/OPEX.13.003931 [DOI] [PubMed] [Google Scholar]
- 63.Zhang M., et al. , “Projection-resolved optical coherence tomographic angiography,” Biomed. Opt. Express 7(3), 816–828 (2016). 10.1364/BOE.7.000816 [DOI] [PMC free article] [PubMed] [Google Scholar]
- 64.An L., Shen T. T., Wang R. K., “Using ultrahigh sensitive optical microangiography to achieve comprehensive depth resolved microvasculature mapping for human retina,” J. Biomed. Opt. 16(10), 106013 (2011). 10.1117/1.3642638 [DOI] [PMC free article] [PubMed] [Google Scholar]
- 65.Hendargo H. C., et al. , “Automated non-rigid registration and mosaicing for robust imaging of distinct retinal capillary beds using speckle variance optical coherence tomography,” Biomed. Opt. Express 4(6), 803–821 (2013). 10.1364/BOE.4.000803 [DOI] [PMC free article] [PubMed] [Google Scholar]


