

Abstract
CD4+ T cells reactive against SARS-CoV-2 can be found in unexposed individuals, and these are suggested to arise in response to common cold coronavirus (CCCoV) infection. Here, we utilized SARS-CoV-2-reactive CD4+ T cell enrichment to examine the antigen avidity and clonality of these cells, as well as the relative contribution of CCCoV cross-reactivity. SARS-CoV-2-reactive CD4+ memory T cells were present in virtually all unexposed individuals examined, displaying low functional avidity and multiple, highly variable cross-reactivities that were not restricted to CCCoVs. SARS-CoV-2-reactive CD4+ T cells from COVID-19 patients lacked cross-reactivity to CCCoVs, irrespective of strong memory T cell responses against CCCoV in all donors analyzed. In severe but not mild COVID-19, SARS-CoV-2-specific T cells displayed low functional avidity and clonality, despite increased frequencies. Our findings identify low-avidity CD4+ T cell responses as a hallmark of severe COVID-19 and argue against a protective role for CCCoV-reactive T cells in SARS-CoV-2 infection.
Keywords: SARS-CoV-2, COVID-19, antigen-specific T cells, pre-existing memory, T cell cross-reactivity, common cold coronavirus, human coronavirus, antigen-reactive T cell enrichment, ARTE
Graphical Abstract
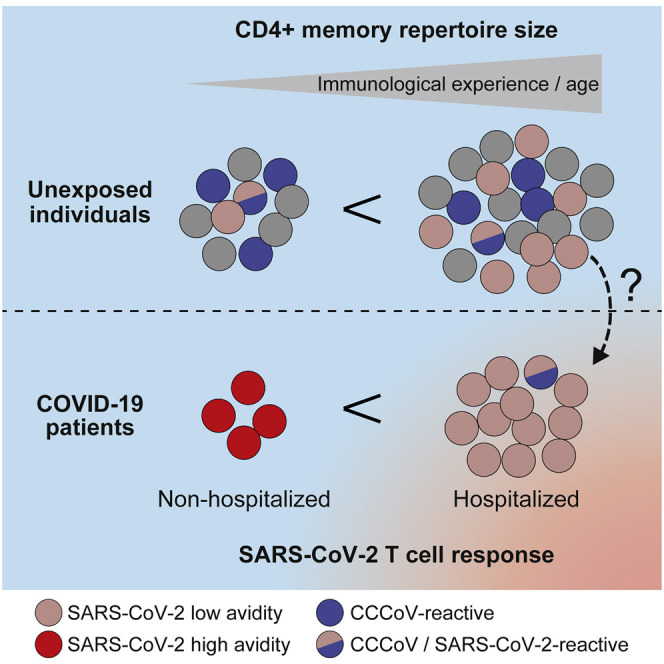
Bacher et al. identify excessive but low-avidity T cell responses to SARS-CoV-2 as a hallmark of severe but not mild COVID-19. Pre-existing memory to SARS-CoV-2 in unexposed donors also displayed low avidity and harbored multiple, highly variable cross-reactivities that were not restricted to common cold coronaviruses.
Introduction
COVID-19 displays remarkable disparity of clinical symptoms, ranging from asymptomatic or mild disease frequently observed in children and younger adults to severe clinical symptoms associated with high mortality mainly in elderly and high-risk patients. These different pathologies are likely to be the result of differences in the immune response to SARS-CoV-2. Severe disease is characterized by hyperinflammation, suggesting that exaggerated immune reactions contribute to COVID-19 pathogenesis. What types of immune responses to SARS-CoV-2 are protective and which are detrimental is an area of active investigation.
CD4+ T cells are central organizers of anti-viral immune responses, and in settings of uncontrolled immune or inflammatory responses, CD4+ T cells might cause pathology (Chen and John Wherry, 2020). In SARS-CoV-2 infection, severe lymphopenia accompanies severe disease and T cell reappearance correlates with patient recovery (Huang et al., 2020; Tan et al., 2020; Wang et al., 2020; Yang et al., 2020). Markers of T cell activation are increased on all T cells (Diao et al., 2020; Sekine et al., 2020; Wilk et al., 2020; Zheng et al., 2020) and on SARS-CoV-2-specific CD4+ and CD8+ T cells (Braun et al., 2020; Sekine et al., 2020). Overall, COVID-19 patients seem to develop robust Th1-like SARS-CoV-2-specific CD4+ T cell responses focused on spike, membrane, and nucleocapsid proteins (Grifoni et al., 2020). Increased frequencies of SARS-CoV-2-specific CD4+ and CD8+ T cells are found in severe disease in some (Anft et al., 2020; Peng et al., 2020), but not in other studies (Braun et al., 2020; Rydyznski Moderbacher et al., 2020). It is hypothesized that exaggerated or dysfunctional CD4+ T cell responses might contribute to the observed hyperinflammation in severe COVID-19 patients. The factors determining the magnitude as well as the quality of the CD4+ T cell response and how this relates to predisposition and/or manifestation of severe COVID-19 are undefined.
Several studies show that a significant fraction of un-exposed donors possess SARS-CoV-2-reactive CD4+ memory T cells (Braun et al., 2020; Grifoni et al., 2020; Le Bert et al., 2020; Mateus et al., 2020; Meckiff et al., 2020; Nelde et al., 2020; Sekine et al., 2020; Weiskopf et al., 2020). These memory T cells exhibit cross-reactivity against selected peptides with homology to related common cold corona virus (CCCoV) strains (Braun et al., 2020; Mateus et al., 2020). This led to the hypothesis that encounters with CCCoV might provide protective cross-reactive memory, especially in younger patients in whom infections with CCCoV are more prevalent. However, data on CD4+ T cell responses against CCCoV in humans are lacking. Furthermore, pre-existing immunity also exists against several other pathogens and neoantigens (Bacher et al., 2013; Campion et al., 2014; Kwok et al., 2012; Su et al., 2013) and is associated with variable clinical consequences, ranging from protective to harmful immune responses (Bacher et al., 2019; Greiling et al., 2018; Koutsakos et al., 2019; Sridhar et al., 2013; Welsh et al., 2010; Woodland and Blackman, 2006). Thus, its effect might depend on the functional characteristics of the T cells, the specific antigen or pathogen contexts (Sette and Crotty, 2020), or patient age (Woodland and Blackman, 2006). The distinct functional characteristics of SARS-CoV-2-specific CD4+ T cells in severe versus mild COVID-19 and unexposed individuals are still poorly understood. Specifically, the prevalence of the putative cross-reactive T cells within unexposed donors and COVID-19 patients as well as in different age groups, their phenotypic and functional characteristics, and the inducing antigen(s) are unknown.
Here, we employed antigen-specific T cell enrichment to characterize SARS-CoV-2-specific T cells from healthy donors (n = 55) and COVID-19 patients (n = 56), including their avidity and clonality as well as their cross-reactivity to CCCoV and other viruses. Pre-existing memory T cells were present at low frequencies in all unexposed donors. However, the proportion of SARS-CoV-2-specific memory versus naive T cells was highly variable and correlated with the size of the total CD4+ memory compartment, i.e., the immunological experience, rather than with CCCoV-specific T cells, which were abundant in all individuals analyzed. Pre-existing memory T cells possessed only low T cell receptor (TCR) avidity. Strongly expanded but low-avidity T cell responses and low TCR clonality were a hallmark of severe but not mild COVID-19. The potential contribution of low-avidity pre-existing T cell memory to the T cell responses in severe disease will be an important question to be investigated in future studies.
Results
Increased Frequencies of Human SARS-CoV-2-Reactive CD4+ T Cells against the Spike, Membrane, and Nucleocapsid Proteins in COVID-19 Patients
To characterize the human T cell response against SARS-CoV-2, we analyzed T cells reactive against a panel of 12 different SARS-CoV-2 proteins. SARS-CoV-2-reactive CD4+ T cells were detected based on the upregulation of CD154+ (CD40L) after 7 h ex vivo stimulation of peripheral blood mononuclear cells (PBMCs) with overlapping peptide pools of the different proteins and subsequent magnetic enrichment (antigen-reactive T cell enrichment [ARTE]) (Bacher et al., 2016; Bacher et al., 2019) (Figure S1A). SARS-CoV-2 exposure versus non-exposure of blood donors was verified by SARS-CoV-2 PCR and/or serology testing (Tables S1 and S2).
The response of COVID-19 patients was mainly directed against three proteins, spike, membrane, and nucleocapsid, as previously reported (Grifoni et al., 2020), as well as, to lower extent and with more variability between, donors against ORF3a, ORF9b, NS6, NS7a, and NS8 (Figures 1A and 1B). The frequencies of reactive cells against single or pooled spike, membrane, and nucleocapsid, were increased in patients versus unexposed individuals (Figure 1C). No differences were detected against a pool of influenza A H1N1 proteins (containing HA, MP1, MP2, NP, and NA), as a control antigen. In contrast to previous reports identifying pre-existing memory only in a subset of unexposed individuals, the sensitive detection by ARTE revealed SARS-CoV-2-reactive T cells in all unexposed donors, albeit at low and variable frequencies ranging from 1 in 106–103 (Figure 1C). Over 80%–90% of SARS-CoV-2-reactive T cells in COVID-19 patients were directed against spike, membrane, and nucleocapsid. The response in unexposed donors was much more variable and directed against multiple proteins (Figure 1D), as previsouly described (Grifoni et al., 2020; Le Bert et al., 2020). The specificity of the SARS-CoV-2-reactive cells in unexposed as well as exposed donors was confirmed by reactivity of expanded CD154+ T cells toward SARS-CoV-2, but not control antigens (Figures S1B and S1C).
Figure 1.

Identification of Immunogenic SARS-CoV-2 Proteins
(A) Frequencies of reactive CD154+CD45RA− memory CD4+ T cells (Tmem) against individual SARS-CoV-2 proteins in unexposed donors (n = 9) and COVID-19 patients (n = 11) (non-hospitalized, n = 8; hospitalized, n = 3).
(B) Representative dot plot examples for ex vivo detection of SARS-CoV-2-reactive CD4+ T cells by ARTE. Absolute cell counts after magnetic CD154+ enrichment from 1 × 10e7 PBMCs are indicated.
(C) Frequencies of SARS-CoV-2-reactive Tmem against individual or pooled spike, membrane, nucleocapsid proteins or a pool of influenza A proteins (containing HA, MP1, MP2, NP, and NA) as control antigen. Unexposed donors, n = 55; COVID-19 patients, n = 56. Horizontal lines indicate geometric mean.
(D) Proportion of SARS-CoV-2 proteins recognized by CD4+ T cells in unexposed donors (n = 9) and COVID-19 patients (n = 11).
Each symbol in (A) and (C) represents one donor. Box-and-whisker plots display quartiles and range in (A). Statistical differences in (C), two-tailed Mann-Whitney test.
Single-Cell RNA Sequencing Identifies Similar T Cell Clusters in COVID-19 and Unexposed Donors
To obtain a deeper insight into the cellular composition of SARS-CoV-2-specific T cells and their molecular patterns, we next performed single-cell RNA sequencing (scRNA-seq) of ex vivo fluorescence-activated cell sorting (FACS)-purified SARS-CoV-2-reactive memory T cells. After quality filtering (see Method Details) we analyzed in total 104,417 single cells from 6 unexposed and 14 COVID-19 patients.
Uniform manifold approximation and projection (UMAP) cluster analysis revealed five clusters with a distinct transcriptional profile (Figure 2 A). These were assigned as T-follicular-helper-like (Tfh-like) (key marker genes IL21 and POU2AF1), transitional memory (CD28 and IL7R), central memory (CCR7 and SELL), cytotoxic (IFNG, CSF2, PRF1, and GNLY), type I interferon (INF) response (MX1 and OAS1), and cycling T cells (MKI67 and CDK1) (Figure 2B). Similar clusters have recently been described in SARS-CoV-2-specific T cells (Meckiff et al., 2020). In particular, Tfh-like, transitional, and central memory T cells showed a related profile with variable gene expression of IFNG, CSF2, IL21, IL2, and PDCD1 (Figures 2B, S2A, and S2B). We also observed three robust clusters (cytotoxic-Th1, type-I interferon, and cycling) indicative of cellular activation and an anti-viral type I interferon response. Similar clusters were also identified in SARS-CoV-2-reactive memory T cells from unexposed individuals, and we were not able to clearly separate unexposed donors from COVID-19 patients or between patients with different disease severity only based on qualitative differences of the reactive T cells (Figures 2C and S2B).
Figure 2.

Single-Cell RNA Sequencing of SARS-CoV-2-Reactive CD4+ T Cells
(A) Single-cell gene expression of FACS-purified ex-vivo-isolated CD154+ memory T cells after stimulation with pooled SARS-CoV-2 spike, membrane, and nucleocapsid proteins from unexposed donors (n = 6) and COVID-19 patients (n = 14). UMAP visualization of the subset composition of SARS-CoV-2-reactive CD4+ T cells colored by functional gene expression clusters.
(B) Dot plot visualization showing the expression of selected marker genes in each SARS-CoV-2 T cell cluster. Colors represent the Z-score-normalized expression amounts, and size indicates the proportion of cells expressing the respective genes.
(C) Proportion of cells falling within each cluster for the individual donors (unexposed donors, n = 6; non-hospitalized COVID-19 patients, n = 6; hospitalized COVID-19 patients, n = 8).
(D) Ex vivo Ki-67 and CD38 expression of SARS-CoV-2 pool-reactive CD154+ Tmem cells analyzed by flow cytometry. Unexposed donors, n = 55; COVID-19 patients, n = 56.
(E) Spearman correlation of Ki-67 and CD38 expression within SARS-CoV-2 pool-reactive CD154+ Tmem cells and days since disease onset in COVID-19 patients (n = 56).
Each symbol in (C)–(E) represents one donor; horizontal lines indicate mean in (C) and geometric mean in (D). Statistical differences in (D), two-tailed Mann-Whitney test.
Increased expression of the acute and chronic activation markers Ki-67 and CD38 was confirmed by flow cytometry (Figures 2D and S3A) and declined with time after infection (Figure 2E), in contrast to the frequencies of reactive T cells (Figure S3B). Relative, but especially absolute amounts of inflammatory cytokines were increased in COVID-19, such as interleukin-2 (IL-2), IFN-γ and IL-21, compared with those in unexposed individuals (Figures S3C and S3D). We also observed a slightly higher production of IL-10. Whereas inflammatory cytokines increased with time after infection, IL-10 was mainly produced during active disease (Figure S3E). This finding suggests a counter-regulatory mechanism during acute infection. We observed no differences in the cytokine response or phenotype between the individual SARS-CoV-2 proteins (Figure S4).
Altogether, COVID-19 patients generated a pro-inflammatory Th1-cytotoxic-like and Tfh-like response against SARS-CoV-2 spike, membrane, and nucleocapsid proteins. However, the differences between patients and unexposed individuals were mainly quantitative rather than qualitative. This suggests that the identified cell clusters are not unique to COVID-19 but might represent a common cellular phenotype of anti-viral T cells.
Low-Avidity SARS-CoV-2-Reactive Memory T Cells in Unexposed Donors
Recent studies show pre-existing T cell immunity against SARS-CoV-2 in 20%–81% of unexposed donors (Braun et al., 2020; Grifoni et al., 2020; Le Bert et al., 2020; Mateus et al., 2020; Meckiff et al., 2020; Nelde et al., 2020; Sekine et al., 2020; Weiskopf et al., 2020). Variable cross-reactivity is reported against homologuous epitopes from common cold viruses (Braun et al., 2020; Mateus et al., 2020). However, the overall repertoire of cross-reactive antigens as well as the functionality of the pre-existing memory T cells remains poorly characterized (Sette and Crotty, 2020). By sensitive enrichment of antigen-reactive T cells, we detected low frequencies of cross-reactive T cells against different SARS-CoV-2 proteins in all unexposed donors analyzed (Figure 1). To further characterize these pre-existing SARS-CoV-2-reactive T cells, we determined the proportion of memory versus naive cells. A substantial fraction of SARS-CoV-2-reactive cells from unexposed donors but not COVID-19 patients displayed a naive phenotype, as evidenced by expression of CD45RA, CCR7, and CD27 and lack of CD45RO, CD95, and CD11a (Figures 3 A, 3B, and S5A). The proportion of memory cells was variable between different donors (range 25%–95%) (Figure 3B). So far, there is little knowledge about the functionality of these rare pre-existing SARS-CoV-2-reactive memory T cells. We therefore determined their functional avidity via stimulation of expanded SARS-CoV-2-reactive memory T cells with decreasing antigen concentrations. SARS-CoV-2-reactive memory T cells from unexposed individuals lacked high-avidity T cells, in contrast to those from COVID-19 patients (Figures 3C and 3D). The avidities of SARS-CoV-2-specific memory T cells from COVID-19 were variable but in a similar range as cytomegalovirus (CMV)-reactive T cells from CMV+ donors (Figure 3D).
Figure 3.

SARS-CoV-2-Reactive CD4+ T Cells in Unexposed Donors
(A) CD45RA and CCR7 staining of SARS-CoV-2 or influenza-A-reactive CD154+ cells in unexposed donors or COVID-19 patients. Percentage of marker-positive cells within CD154+ is indicated.
(B) Proportion of CD45RA− Tmem cells within SARS-CoV-2-reactive cells in unexposed donors (n = 55) or COVID-19 patients (n = 56).
(C and D) SARS-CoV-2 pool-reactive CD154+ Tmem cells from unexposed donors and COVID-19 patients were FACS purified, expanded, and re-stimulated with decreasing antigen concentration in the presence of autologous antigen-presenting cells. Shown in (C) is CD154 or TNF-α expression for the indicated concentration per peptide. Shown in (D), half-maximal response (EC50) values were calculated from dose-response curves. On the left, SARS-CoV-2-reactive cells from unexposed donors (n = 17) and COVID-19 patients (n = 21); on the right, CMV-reactive cells from CMV+ donors (n = 5) or SARS-CoV-2-reactive cells from COVID-19 patients (n = 21).
(E) Pearson correlation between the proportion of memory cells within the antigen-specific T cells (y axis) and the proportion of memory cells within the total CD4+ population (x axis) is shown for exposed and unexposed donors for SARS-CoV-2 and CMV.
(F) Unexposed donors were grouped according to the % memory within total CD4+ cells and the proportion of memory within SARS-CoV-2-reactive T cells is shown for each group.
(G) Spearman correlation between the age of donors and the percentage of memory cells within the total CD4+ T cell compartment.
(H) Percentage of memory cells within the total CD4+ T cell compartment in different biological age groups.
Each symbol in (B) and (D)–(H) represents one donor; horizontal lines indicate mean in (B), (F), and (H). Box-and-whisker plots display quartiles and range in (D). Statistical differences, two-tailed Mann-Whitney test in (D); one-way ANOVA with Tukey post hoc test in (F) and (H).
Next, we asked which parameters might influence the variability of pre-existing memory between individuals. The proportion of memory cells within the SARS-CoV-2-reactive T cells correlated with the proportion of memory cells within the total CD4+ compartment, i.e., the immunological experience of the donor (Figures 3E and 3F). A similar tendency was also seen for the absolute frequencies of pre-existing memory T cells among CD4+ T cells (Figure S5B). In contrast, we detected no correlation of pre-existing T cell frequency with donor age (Figure S5C). A comparable correlation with the total CD4+ memory compartment was observed for pre-existing CMV-reactive memory T cells from CMV-sero-negative donors (Figure 3E), as well as for memory T cells reactive against the neoantigen keyhole limpet hemocyanin (KLH) (Figure S5D). In contrast, SARS-CoV-2-specific responses in patients with COVID-19 or CMV-reactive T cells in CMV-sero-positive donors lack such correlation, as expected for an in vivo expanded antigen-specific memory response. These data suggest that pre-existing memory against newly encountered antigens might be a common phenomenon in humans and that the relative proportion of memory versus naive T cells increases depending on the size of the total CD4+ memory compartment. The proportion of CD4+ T cell memory was variable but increased with age (Figures 3G and 3H) and was particularly elevated in donors over 60 years of age (Figure 3H).
In summary, these data show that antigen-reactive T cells against newly encountered antigens, such as SARS-CoV-2 are present within a natural memory T cell repertoire, most likely because of TCR-intrinsic cross-reactivity, as previously described (Bacher et al., 2013; Campion et al., 2014; Kwok et al., 2012; Su et al., 2013). However, their low avidity questions a protective contribution to anti-SARS-CoV-2 immunity.
Memory T Cell Response to Common Cold Coronaviruses
So far, the analysis of pre-existing SARS-CoV-2 memory is mainly focused on potential cross-reactivity to related common cold coronaviruses (CCCoVs) due to peptide homologies (Braun et al., 2020; Le Bert et al., 2020; Mateus et al., 2020; Weiskopf et al., 2020). CCCoVs are responsible for approximately 20% of common cold upper respiratory tract infections in the human population (Gaunt et al., 2010). However, data on the prevalence and characteristics of CCCoV-specific T cell responses are lacking. We analyzed the response against spike proteins from the CCCoV strains 229E, OC43, HKU1, and NL63. Memory T cell responses were readily detected in all healthy donors with frequencies ranging between 1 in 103–104 (Figures 4A and 4B). This is in a similar range like frequencies against influenza A (Figure 1C) and 10- to 100-fold higher than for SARS-CoV-2-spike-reactive T cells (Figure 4B). CCCoV responses displayed a memory phenotype (Figures 4C and 4D) independent of the proportion of memory within the total CD4+ compartment (Figure 4E) and high functional avidity (Figure 4F). This is in accordance with an in vivo induction upon viral infection. In line with that, CCCoV-spike-reactive T cells showed higher production of the inflammatory cytokines IFN-γ, tumor necrosis factor-α (TNF-α), IL-2, and IL-21 than in SARS-CoV-2-spike-reactive T cells from unexposed individuals (Figures 4G, 4H, and S4).
Figure 4.

Human CD4+ T Cell Response against Common Cold Viruses (CCCoVs)
(A) Ex vivo detection of reactive CD4+ T cells against CCCoV spike proteins by ARTE. Absolute cell counts after magnetic CD154+ enrichment from 1 × 10e7 PBMCs are indicated.
(B) Summary of SARS-CoV-2-spike and CCCoV-spike-reactive Tmem cell frequencies in SARS-CoV2-unexposed donors (n = 34).
(C) CD45RA and CCR7 staining of SARS-CoV-2-spike and CCCoV-spike-reactive CD154+ cells in SARS-CoV2-unexposed donors. Percentage of marker-positive cells within CD154+ is indicated.
(D) Proportion of memory cells within SARS-CoV-2-spike and CCCoV-spike-reactive cells in SARS-CoV2-unexposed donors (n = 34).
(E) Pearson correlation between the proportion of memory cells within the SARS-CoV-2-spike or CCCoV-spike-specific T cells (y axis) and the proportion of memory cells within the total CD4+ population (x axis) in SARS-CoV-2-unexposed donors.
(F) CD154+ Tmem cells reactive against a pool of the 229E, NL63, HKU1, and OC43 spike proteins (n = 7) or reactive against the SARS-CoV-2 spike (n = 17) were FACS-purified, expanded, and re-stimulated with decreasing antigen concentration. EC50 values were calculated from dose-response curves.
(G) Ex vivo cytokine production of CCCoV- and SARS-CoV-2-spike-reactive Tmem cells of healthy individuals analyzed by ARTE (n = 34).
(H) Heatmap depicting the ex vivo cytokine production of virus-reactive Tmem cells (n = 26–50). Cytokine production within CD154+ Tmem was measured by flow cytometry and mean values were Z score normalized for each cytokine. Only convalescent COVID-19 patients were included in this analysis.
Each symbol in (B) and (D)–(G) represents one donor; horizontal lines indicate mean in (B), (D), and (G). Box-and-whisker plots display quartiles and range in (F). Statistical differences, Friedman test with Dunńs post hoc test in (B), (D), and (G); two-tailed Mann-Whitney test in (F).
In summary, these data show that robust memory CD4+ T cell responses to all four common cold corona virus strains were present in the majority of healthy individuals. The response against CCCoVs could be quantitatively and qualitatively distinguished from pre-existing memory T cells against SARS-CoV-2.
CCCoV-Cross-Reactive T Cells Do Not Contribute Significantly to SARS-CoV-2 Immunity in COVID19 Patients
Because of the high frequencies of CCCoV-reactive memory T cells in most healthy donors, we wanted to directly assess their effect on SARS-CoV-2 pre-existing memory and the response to SARS-Cov-2 infection. Therefore, we directly estimated T cell cross-reactivity between SARS-CoV-2- and CCCoV-specific T cells from healthy unexposed donors and COVID-19 patients. Expanded CCCoV-spike-specific memory T cells from healthy donors showed only marginal (<10%) cross-reactivity against SARS-CoV-2 spike protein (Figures 5 A–5C). In contrast, SARS-CoV-2-spike-reactive T cells from unexposed individuals displayed detectable cross-reactivity to CCCoV spike but with donor-to-donor variablility, ranging from 0%–70% (Figures 5A–5C). The frequencies of reactive memory T cells between the different CCCoV strains correlated as an indicator of cross-recognition. Only a weak correlation was observed between SARS-CoV-2 memory T cells and individual CCCoV strains (Figure 5D), which was similar to other common viral antigens (Figure S6). To further analyze the potential relevance of T cell cross-reactivity to CCCoVs but also to other viruses for the anti-SARS-CoV-2 immune reponse, we re-stimulated expanded SARS-CoV-2-specific T cell lines from COVID-19 patients and unexposed donors (Figures 5E and 5F). Only minimal cross-reactivity against the CCCoV strains was detected in COVID-19 patients (Figure 5G). The same was observed against other unrelated viruses, such as CMV or influenza A (Figures 5E and 5F).
Figure 5.

T Cell Cross-Reactivity between CCCoVs and SARS-CoV-2
(A–C) CD154+ Tmem cells reactive against a pool of the 229E, NL63, HKU1, and OC43 spike proteins (n = 7) or reactive against the SARS-CoV-2 spike (n = 17) were FACS-purified, expanded, and re-stimulated. (A) Representative dot plots for re-stimulation. Percentage of CD154+TNFα+ cells within CD4+ is indicated. (B) Summarized reactivity of the expanded cell lines against CCCoV spike pool or SARS-CoV-2 spike protein, respectively. (C) Percentage of cross-reactivity of SARS-CoV-2-spike-reactive cells to CCCoV spike and vice versa, in relation to the reactivity against the initially stimulated antigen.
(D) Spearman correlation between CD154+ Tmem cell frequencies reactive against different CCCoVs or CCCoVs and SARS-CoV-2 spike (n = 34).
(E–G) Expanded SARS-CoV-2 pool-reactive T cells from COVID-19 patients (n = 21) or unexposed individuals (n = 18) were re-stimulated with different antigens in presence of autologous antigen-presenting cells. (E) Signal-to-noise ratio depicting the percentage of CD154+ expressing CD4+ T cells after stimulation divided by the percentage of background CD154+ expression in unstimulated T cells. A detection limit (dashed line), was defined as signal:noise ratio ≥3. (F) Dot plot examples for re-stimulation of a COVID-19 patient. Cells were gated on CD4+ T cells and percentages of CD154+TNFα+ cells are indicated. (G) Percentage of cross-reactivity of SARS-CoV-2-spike-reactive cells to CCCoV spike in unexposed donors (n = 14) and COVID-19 patients (n = 18).
Each symbol in (B), (C), (D), (E), and (G) represents one donor; horizontal lines indicate geometric mean in (E). Box-and-whisker plots display quartiles and range in (B), (C), and (G). Statistical differences, two-tailed Mann-Whitney test in (B), (C), and (G).
Thus, our data revealed a minor role of ubiquitous CCCoV-specific high-affinity memory T cells for the immune response against SARS-CoV-2. Although CCCoV cross-reactive memory cells were variably present in unexposed donors, they did not significantly contribute to the immune reaction against SARS-CoV-2 in COVID-19 patients.
Increased, but Unfocused and Low-Avidity CD4+ T Cell Response against SARS-CoV-2 in Severe Disease
So far our data confirmed that pre-existing memory T cells against SARS-CoV-2 are common in unexposed humans. They were of rather low avidity and their proportion increased with the size of the CD4+ memory compartment, suggesting that they were probably primed by several antigens. The in vivo consequences of such polyclonal, low-avidity pre-existing memory T cells for immune responses against newly encountered antigens are unclear.
We next compared the response quality of patients with mild (non-hospitalized) versus severe (hospitalized) disease. Classification was based on World Health Organization (WHO) criteria, whereby WHO groups 3–5 (moderate) and 6–7 (severe) were combined to increase statistical power (see Table S1). We found higher frequencies of reactive T cells against the single and pooled SARS-CoV-2 proteins with increasing disease severity (Figure 6 A). No such correlation was observed for influenza A as control antigen. The increased frequencies in severe disease were not due to an age bias as shown for a selected group of donors in the age range of 50–65 years (Figures 6B, 6C, and S7). However, hospitalized versus non-hospitalized patients within the same age group showed an increased proportion of memory cells within the CD4+ T cell compartment (Figure 6D). We next compared TCR avidities and clonalities of SARS-CoV-2-reactive T cells from hospitalized versus non-hospitalized patients. SARS-CoV-2-reactive T cells from hospitalized patients displayed lower functional avidity than did those from non-hospitalized patients (Figures 6E–6G) and similar to those from unexposed donors (Figure 3D). In line with this, SARS-CoV-2-specific T cells from hospitalized COVID-19 patients showed a trend toward a more diverse TCR repertoire (Figure 6H) and reduced clonal expansions, as indicated by the lower Gini coefficient, as a measure of the eveness of a population (Figure 6I). This was not significant due to one outlier (gray dots in Figures 6G–6I, discussed below). Thus, despite increased T cell frequencies in severe COVID-19 (Figure 6A), it is unlikely this increase results from an expansion of individual high-avidity clones but rather from a broad polyclonal response. We next analyzed the distribution of the most clonally expanded TCRs per patient within the different clusters of the single-cell RNA sequencing analysis. We observed a tendency that in mild disease the most expanded clones were mainly restricted to the cytotoxic cluster, whereas in more severe disease, they were scattered over several clusters (Figures 6J and 6K). Again, the same outlier mentioned above (gray dot in Figures 6G–6I) did not fit into this scheme and also showed a high clonality strongly focused to the cytotoxic cluster (Figure 6K, lower right). This patient suffered from a CMV reactivation, which might account for selective expansion of cross-reactive clones. Despite this, T cells from this donor were of low avidity for SARS-CoV-2 antigens (Figure 6G, gray dot) confirming the robustness of the avidity data.
Figure 6.

Unfocused T Cell Response in Severe COVID-19
(A) Frequencies of SARS-CoV-2-reactive Tmem cells. The COVID-19 severity level was assessed on the basis of WHO criteria, whereby WHO groups 3–5 (moderate) and 6 and 7 (severe) were combined to increase statistical power (see Table S1). Unexposed donors, n = 50; non-hospitalized, n = 32 (WHO 1 and 2), mild–moderate, n = 13 (WHO 3, n = 2; WHO 4, n = 7; WHO 5 n = 4); severe, n = 11 (WHO 6, n = 5; WHO 7, n = 6); patients with active disease at the time point of sampling are indicated with a square.
(B) Age distribution within the different disease groups and controls and within the age-selected donors from 50–65 years.
(C) Frequencies of SARS-CoV-2 pool-reactive Tmem cells in age-selected donors; unexposed, n = 14, non-hospitalized, n = 13; mild–moderate, n = 8; severe n = 5.
(D) Proportion of memory cells within total CD4+ T cells of the age-selected donors.
(E–G) SARS-CoV-2 pool-reactive CD154+ Tmem cells were FACS-purified, expanded, and re-stimulated with decreasing antigen concentration in the presence of autologous antigen-presenting cells. (E) CD154 or TNF-α expression for the indicated concentration per peptide. (F) Dose-response curves of expanded T cell lines, re-stimulated with decreasing antigen concentrations. (G) EC50 values were calculated from dose-response curves. Non-hospitalized, n = 14; hospitalized, n = 7.
(H and I) TCR sequence analysis from single-cell data of the top 50 expanded clonotypes. (H) Simpson Index of TCR diversity. (I) Gini coefficient depicting the distribution of TCR sequences (0 is total equality, i.e., all clones have the same proportion; 1 is total inequality, i.e., a population dominated by a single clone). Non-hospitalized, n = 6; hospitalized, n = 8.
(J) Representative distribution of the top three expanded TCR clonotypes projected to the UMAP analysis for one exemplary non-hospitalized and one hospitalized COVID-19 patient.
(K) Proportional distribution of the top three expanded clonotypes on the different Seurat clusters for each analyzed patient (non-hospitalized, n = 6; hospitalized, n = 8).
Each symbol in (A)–(D) and (G)–(I) represents one donor; horizontal lines indicate mean in (A)–(D). Box-and-whisker plots display quartiles and range in (G)–(I). Statistical differences, Kruskal-Wallis test with Dunn’s post hoc test in (A), significant differences are indicated. Two-tailed Mann-Whitney test in (G)–(I).
In summary, our data reveal that severe COVID-19 patients showed a strong but rather unfocused CD4+ T cell response. This was characterized by low-avidity T cells originating from a rather polyclonal repertoire. Severe disease was also associated with an enlarged total CD4+ memory compartment. However, we do not know the patients pre-infection status and the influence of the disease on this parameter. Nevertheless, this indirect correlation raises the possibility that pre-existing memory repertoire might contribute to such unfocused, low-avidity responses, which has to be carefully evaluated in future studies.
Discussion
Defining the parameters that contribute to the high clinical variability of COVID-19 is critical in predicting disease outcome and for the development of effective therapeutic and vaccination strategies. Pre-existing T cell memory against SARS-CoV-2 has been identified in a fraction of unexposed individuals mainly in the CD4+ T cell compartment (Braun et al., 2020; Grifoni et al., 2020; Le Bert et al., 2020; Mateus et al., 2020; Meckiff et al., 2020; Nelde et al., 2020; Sekine et al., 2020; Weiskopf et al., 2020), and its origin and effect on COVID-19 is currently intensively discussed. Our in-depth characterization of SARS-CoV-2- and CCCoV-specific CD4+ T cell responses and their mutual cross-reactivity revealed novel key findings arguing against a major effect of CCCoV and against a general protective role of pre-existing T cell memory: first, pre-existing T cell memory was common in humans, correlated with the size of the CD4+ memory repertoire rather than with CCCoV-specific memory, and displayed only low functional avidity. Second, robust CD4+ T cell responses against CCCoV were prevalent in the population; however, T cells reacting to CCCoVs were not present among SARS-CoV-2-specific T cells in COVID-19 patients. Third, in severe COVID-19 patients, SARS-CoV-2-specific CD4+ T cells also displayed low functional avidity and TCR clonality, although their frequencies increased with disease severity.
So far, analyses of pre-existing memory T cells are focused on cross-reactivity to CCCoVs, which cause frequent and recurrent mild infections in the general population. Such heterologous immunity between related pathogens is mainly described in infection models (Welsh et al., 2010), although it might also modulate human immune responses (Bacher et al., 2019; Gras et al., 2010; Hayward et al., 2015; Koutsakos et al., 2019; Sridhar et al., 2013). Indeed, in unexposed donors, cross-reactivity to CCCoVs is observed in SARS-CoV-2-specific CD4+ T cells directed against the most homologous part of spike proteins (Braun et al., 2020) or selected homologous peptides (Mateus et al., 2020; Nelde et al., 2020). This led to the hypothesis of protective pre-existing immunity against SARS-CoV-2 driven by CCCoVs. CCCoV-specific CD4+ T cell responses, to the best of our knowledge, have not as yet been characterized. Here, we demonstrated CD4+ memory T cell responses against the four CCCoV strains in all tested individuals. The frequencies of reactive cells were similar to influenza A virus but vastly exceeding those of pre-existing SARS-CoV-2 memory T cells by a factor of 10–100. These CCCoV-specific T cells displayed high functional avidity, as expected for a T cell response formed during an infection. The observed high avidity was in contrast to the low avidity of pre-existing memory T cells against SARS-CoV-2. Consequently, SARS-CoV-2 pre-existing memory CD4+ T cell frequencies only weakly correlated with CCCoV-specific memory T cells. In contrast, the strongest correlation of T cell responses was observed between the two alpha and the two beta coronaviruses, respectively. The correlation between alpha and beta CCCoVs was still higher than any of the two compared to SARS-CoV-2. We can only speculate that because of recurrent infections with all four CCCoV strains, T cells against shared epitopes might be selectively expanded throughout life, whereas such a selection process has not yet occurred with the newly encountered SARS-CoV-2 virus. Thus, we identified robust CD4+ T cell memory against CCCoV as broadly present in the human population.
These data argue against a general protective role of CCCoV-driven immunity for SARS-CoV-2 or the selective protection of children and younger adults. Most importantly, cross-reactive T cells against CCCoVs were almost completely lacking among SARS-CoV-2-specific CD4+ T cells from COVID-19 patients. Similarly, Mateus et al. (2020) also show that CD4+ T cells against a SARS-CoV-2 peptide pool but not against a selected pool of homologous CCCoV peptides are increased in COVID-19 patients. Overall, these findings argue against a major contribution of CCCoV-cross-reactive CD4+ T cells to SARS-CoV-2 responses in vivo. This might be explained by the observed low avidity of pre-existing memory T cells, as identified here. Altogether, CCCoV-specific T cell memory was common in the human population, although it appeared to have minimal effect on SARS-CoV-2-specific immunity in COVID-19. However, it is difficult to predict the effects of cross-reactive T cells for each individual because of the high human variability regarding human leukocyte antigen (HLA)-compostion and infection history. Therefore, protection might still be possible in some individuals and further studies are needed to delineate the role of specific peptides, HLA-restriction and functional avidity against individual peptides in larger cohorts. In any case, the existence of robust CCCoV-specific CD4+ T cell memory in almost all individuals might be an encouraging sign for the general development of cellular memory against coronaviruses such as SARS-CoV-2 even if virus-specific antibody responses are only transient (Seow, 2020).
Our analyses potentially revealed a more general effect of pre-existing memory on COVID-19. In contrast to previous reports, we found pre-existing memory CD4+ T cells essentially in all analyzed unexposed donors, which might be because of the high sensitivity and specificity of the ARTE assay (Bacher and Scheffold, 2013, 2015). These cells displayed features of a stochastic cross-reactivity within a large TCR repertoire primed by many different pathogens. This observation is supported by their ubiquitous presence in all analyzed individuals and their broad protein specificity (Grifoni et al., 2020; Le Bert et al., 2020), as well as by their positive correlation with total CD4+ T cell memory, as shown in our study. In particular, the low functional avidity of pre-existing memory T cells argues against in vivo affinity selection (Bacher et al., 2016). Such memory T cells against antigens not previously encountered are commonly detected in humans (Bacher et al., 2013; Campion et al., 2014; Kwok et al., 2012; Su et al., 2013), which can be explained by the well-known TCR-intrinsic cross-reactivity against related and also unrelated, but structurally similar, peptides (Birnbaum et al., 2014; Sewell, 2012). Thus, a diverse memory pool, which accumulates in humans throughout life, might contain TCRs specific for neo-antigens similar to the naive T cell pool and with a broad range of affinities.
The functional effect of such broad pre-existing memory on human T cell responses against newly encountered pathogens or vaccines is poorly understood. The general correlation of the pre-existing memory T cells with the total CD4+ memory pool size, which increases with age as shown here, might suggest increasing importance in the elderly (Lanzer et al., 2018; Lanzer et al., 2014; Woodland and Blackman, 2006). Given that memory T cells have a lower activation threshold, a large number of suboptimal low-avidity memory cells might compete and prevent naive T cell activation and high-affinity selection (Lanzer et al., 2018). Indeed, the size of the naive T cell pool corresponds to vaccination success (Kwok et al., 2012; Schulz et al., 2015; Woodland and Blackman, 2006). Pre-existing memory might represent a general mechanism modulating immune responses toward newly encountered antigens, especially in the elderly (Woodland and Blackman, 2006). Particularly considering the heterogeneity within the human population regarding antigen exposure and major histocompatibility complex (MHC) composition, variable and context-dependent effects of pre-existing memory ranging from protective to harmful might indeed be expected. Clearly, the potential effect of pre-existing memory on COVID-19 disease course as well as efficacy of SARS-CoV-2 vaccination has to be carefully evaluated in future studies.
A major objective of our study was to identify immune phenotypes that might explain the variable clinical outcome of COVID-19. Despite the reported T cell lymphopenia in severe disease, SARS-CoV-2-specific CD4+ and CD8+ T cell frequencies increased with disease severity (Anft et al., 2020; Peng et al., 2020). However, although our extensive cytometric and single-cell RNA expression profiling of SARS-CoV-2 memory CD4+ T cells confirmed previous results showing common characteristics of an anti-viral T cell response, these approaches failed to identify clear-cut differences between severe and mild disease. Indeed, all COVID-19 patients developed strong, pro-inflammatory Th1 and Tfh-like CD4+ T cell responses directed against the three main proteins, spike, membrane, and nucleocapsid, as shown before for convalescent patients (Grifoni et al., 2020). Similar cell clusters were present in SARS-CoV-2-specific memory T cells from unexposed controls. Increased expression of the activation markers CD38, Ki-67, PD1, and high IL-21 production in COVID-19 might be related to their recent activation. Overall, the picture emerges that, with regard to the CD4+ T cell response, COVID-19 is associated with quantitative differences rather than unique differentiation profiles. Meckiff et al. (2020) identify similar major single-cell RNA clusters within virus-specific CD4+ T cells but different subcluster composition in severe versus mild COVID-19, which we did not observe here. This might be explained by patient heterogeneity and technical differences. It will be important to harmonize test conditions across labs for better comparison and identification of robust phenotypes.
We found that patients with severe COVID-19 harbored low-avidity CD4+ T cells, which were further characterized by reduced clonal expansions and scattered distribution to the different T cell clusters identified by single-cell RNA sequencing. Such polyclonal and low-avidity T cells might be less susceptible to intrinsic negative control mechanisms, thus explaining their increased frequencies despite their reduced capacity to react to the antigen. The increased SARS-CoV-2-reactive T cell response in severe COVID-19 might contribute to immune pathology. In contrast, high-avidity and clonally expanded T cell populations focused within the cytotoxic-Th1 cluster formed in mild COVID-19. We currently have no information on the peptide specificity and cross-reactivity profile of these expanded clonotypes. However, given that we demonstrated the specificity and lack of cross-reactivity to CCCoV for SARS-CoV-2-reactive T cell lines from COVID-19 patients, we assume that this likely also applies to the most expanded clonotypes. It will be important to further characterize such expanded clones in subsequent studies to identify protective peptide-HLA candidates.
At present, we can only speculate on which factors might drive the observed unfocused and low-avidity CD4+ T cell responses in severe COVID-19. However, the similarities to pre-existing T cell memory are apparent. Although we do not know the pre-infection status, patients with severe COVID-19 also displayed an enlarged CD4+ memory compartment compared with that in patients with mild disease. At least in unexposed individuals, this parameter correlated with pre-existing memory and is also associated with higher age, as discussed previously. Thus, we hypothesize that pre-existing memory might contribute to the reduced avidity and higher diversity of TCRs in severe COVID-19, and it is tempting to speculate that this might contribute to the increased risk for severe COVID-19 in the elderly population. However, it will be important to independently test the effect of pre-existing memory, infection history, CD4+ memory size and age by using paired samples from larger patient cohorts upon natural infection and before and after vaccination, and to identify potential predictive parameters for the quality of the SARS-CoV-2-specific T cell response.
Limitations of Study
Our study only provides correlative evidence for a contribution of pre-existing memory T cells to low-avidity and low-clonality T cell responses and immune-pathogenesis in severe COVID-19. A causal link is still unclear due to the lack of paired sample analyses before and after infection. Furthermore, it remains unclear which specific antigens or pathogens and HLA combinations make a major contribution to pre-existing memory and to subsequent T cell responses upon infection. In fact, pre-existing T cell memory is heterogenous between donors because of the variable HLA composition and pre-infection history. Thus, our cohort size was too small to identify individuals or small subgroups where pre-existing memory T cells potentially contains high-affinity clones. It will be important to independently test the effect of pre-existing memory, infection history, HLA composition, CD4+ memory size and age by using paired samples from larger patient cohorts before and after natural infection or vaccination. This will be necessary to identify parameters of pre-existing T cell memory that might predict the quality of the SARS-CoV-2-specific T cell response and potentially disease severity in individual patients.
Our study relies on detection of CD154 expression by fresh peripheral blood CD4+ but not CD8+ T cells after short stimulation with pooled SARS-CoV-2 peptides. This allowed us to perform the functional assays described, in addition to the molecular and cytometric characterization. However, there is currently considerable variability regarding the detection methods for antigen-specific T cells, the cell source, such as blood versus tissues or fresh versus frozen, and the types of used antigens, which might account for differences observed between studies and which should be addressed in future experiments.
STAR★Methods
Key Resources Table
| REAGENT or RESOURCE | SOURCE | IDENTIFIER |
|---|---|---|
| Antibodies | ||
| CD4-APC-Vio770 (clone: M-T466) | Miltenyi Biotec | Cat#130-113-251; RRID: AB_2726053 |
| CD8-VioGreen (clone: REA734) | Miltenyi Biotec | Cat#130-110-684; RRID: AB_2659241 |
| CD14-VioGreen (clone: REA599) | Miltenyi Biotec | Cat#130-110-525; RRID: AB_2655057 |
| CD20-VioGreen (clone: LT20) | Miltenyi Biotec | Cat#130-096-904; RRID: AB_2726147 |
| CD38-PE-Vio770 (clone: REA572) | Miltenyi Biotec | Cat#130-113-432; RRID: AB_2733228 |
| CD154-FITC (clone: REA238) | Miltenyi Biotec | Cat#130-109-469; RRID: AB_2751146 |
| IL-21-PE (REA1039) | Miltenyi Biotec | Cat#130-117-421; RRID: AB_2727941 |
| CD69-PE (REA824) | Miltenyi Biotec | Cat#130-112-613; RRID: AB_2659065 |
| CD4-VioBlue (clone: VIT4) | Miltenyi Biotec | Cat#130-113-219; RRID: AB_2726030 |
| CD154-APC-Vio770 (clone: 5C8) | Miltenyi Biotec | Cat#130-114-130; RRID: AB_2751205 |
| TNF-α-PE-Vio770 (clone: cA2) | Miltenyi Biotec | Cat#130-096-755; RRID: AB_2784483 |
| CD4-BV421 (clone: OKT4) | BioLegend | Cat#317434; RRID: AB_2562134 |
| CD45RA-PE-Cy5 (clone: HI100) | BioLegend | Cat#304110; RRID: AB_314414 |
| CCR7-Brilliant Violet 785 (clone: G043H7) | BioLegend | Cat#353230; RRID: AB_2563630 |
| PD-1-Brilliant Violet 605 (clone: EH12.2H7) | BioLegend | Cat#329924; RRID: AB_2563212 |
| TNFa-Brilliant Violet 650 (clone: MAb11) | BioLegend | Cat#502938; RRID: AB_2562741 |
| IL-10-PE-Dazzle (clone: JES3-9D7) | BioLegend | Cat#501426; RRID: AB_2566744 |
| IFN-γ-PerCP-Cy5.5 (clone: 4S.B3) | BioLegend | Cat#502526; RRID: AB_961355 |
| Ki-67 Alexa Fluor 700 | BD Biosciences | Cat#561277; RRID: AB_10611571 |
| IL-2-BV711 (clone: 5344.111) | BD Biosciences | Cat#563946; RRID: AB_2738501 |
| CD154 MicroBead Kit, human | Miltenyi Biotec | Cat#130-092-658 |
| CD28 pure – functional grade, human (clone: 15E8) | Miltenyi Biotec | Cat#130-093-375; RRID: AB_1036134 |
| CD40 pure – functional grade, human (clone: HB14) | Miltenyi Biotec | Cat#130-094-133; RRID: AB_10839704 |
| CD14 MicroBeads, human | Miltenyi Biotec | Cat#130-050-201; RRID: AB_2665482 |
| Chemicals, Peptides, and Recombinant Proteins | ||
| Human AB Serum | Sigma Aldrich | Cat#H4522 |
| RPMI-1640 medium | GIBCO, Life Technologies | Cat#61870-044 |
| TexMACS medium | Miltenyi Biotec | Cat#130-097-196 |
| X-Vivo15 medium | Lonza | Cat#BE02-060F |
| Human IL-2 (Proleukin) | Novartis | N/A |
| Human IL-4 | Miltenyi Biotec | Cat#130-093-922 |
| Human GM-CSF | Miltenyi Biotec | Cat#130-093-866 |
| Brefeldin A | Sigma Aldrich | Cat#B7651 |
| Critical Commercial Assays | ||
| MS Columns | Miltenyi Biotec | Cat#130-042-201 |
| LS Columns | Miltenyi Biotec | Cat#130-042-401 |
| Viobility 405/520 Fixable Dye | Miltenyi Biotec | Cat#130-110-206 |
| Inside Stain Kit | Miltenyi Biotec | Cat#130-090-477 |
| Chromium Next GEM Chip G Single Cell Kit | 10xGenomics | Cat#1000127 |
| Chromium Next GEM Single Cell 5¢ Library and Gel Bead Kit v1.1 | 10xGenomics | Cat#1000165 |
| Chromium Single Cell 5¢ Library Construction Kit | 10xGenomics | Cat#1000020 |
| Chromium Single Cell V(D)J Enrichment Kit, Human T Cell | 10xGenomics | Cat#1000005 |
| Single Index Kit T Set A | 10xGenomics | Cat#1000213 |
| Deposited data | ||
| Cell ranger outputs | FastGenomics | https://www.fastgenomics.org |
| Sequencing data | Gene expression omnibus | GEO: GSE162086 |
| Software and Algorithms | ||
| FlowJo | Treestar | https://www.flowjo.com/ |
| GraphPad Prism 8.4 | GraphPad | https://www.graphpad.com/ |
| Genesis | Sturn et al., 2002 | http://genome.tugraz.at |
| Cell Ranger Analysis Pipelines | 10xGenomics | https://support.10xgenomics.com/single-cell-vdj/software/pipelines/latest/what-is-cell-ranger |
| R package “vegan” | https://www.scienceopen.com/document?vid=bf1230d1-c04a-4ab5-b525-206c12d0c1dc | |
| R package “tcR” | https://bmcbioinformatics.biomedcentral.com/articles/10.1186/s12859-015-0613-1 | |
| R package “Harmony v1.0” | Korsunsky et al., 2019 | https://github.com/immunogenomics/harmony |
| R package Seurat v.3.2.0 | Butler et al., 2018 | https://satijalab.org/seurat/ |
| Other | ||
| PepTivator CMV pp65 | Miltenyi Biotec | Cat#130-093-438 |
| PepTivator CMV IE-1 | Miltenyi Biotec | Cat#130-093-493 |
| PepTivator Influenza A (H1N1) NA | Miltenyi Biotec | Cat#130-099-806 |
| PepTivator Influenza A (H1N1) MP1 | Miltenyi Biotec | Cat#130-097-285 |
| PepTivator Influenza A (H1N1) MP2 | Miltenyi Biotec | Cat#130-099-812 |
| PepTivator Influenza A (H1N1) NP | Miltenyi Biotec | Cat#130-097-278 |
| PepTivator Influenza A (H1N1) HA | Miltenyi Biotec | Cat#130-099-803 |
| PepTivator EBV BZLF1 | Miltenyi Biotec | Cat#130-093-611 |
| PepTivator EBV LMP1 | Miltenyi Biotec | Cat#130-095-931 |
| PepTivator EBV LMP2A | Miltenyi Biotec | Cat#130-093-615 |
| PepTivator EBV EBNA-1 | Miltenyi Biotec | Cat#130-093-613 |
| PepTivator AdV5 Hexon | Miltenyi Biotec | Cat#130-093-495 |
| PepTivator SARS-CoV-2 Prot_M | Miltenyi Biotec | Cat#130-126-703 |
| PepTivator SARS-CoV-2 Prot_N | Miltenyi Biotec | Cat#130-126-699 |
| PepMix™ SARS-CoV-2 (AP3A) | JPT | Cat#PM-WCPV-AP3A |
| PepMix™ SARS-CoV-2 (NS6) | JPT | Cat# PM-WCPV-NS6 |
| PepMix™ SARS-CoV-2 (NS7B) | JPT | Cat# PM-WCPV-NS7B |
| PepMix™ SARS-CoV-2 (NS7A) | JPT | Cat# PM-WCPV-NS7A |
| PepMix™ SARS-CoV-2 (NS8) | JPT | Cat# PM-WCPV-NS8 |
| PepMix™ SARS-CoV-2 (ORF9B) | JPT | Cat# PM-WCPV-ORF9B |
| PepMix™ SARS-CoV-2 (ORF10) | JPT | Cat# PM-WCPV-ORF10 |
| PepMix™ SARS-CoV-2 (Spike Glycoprotein) | JPT | Cat#PM-WCPV-S |
| PepMix™ SARS-CoV-2 (VEMP) | JPT | Cat#PM-WCPV-VEMP |
| PepMix™ SARS-CoV-2 (Y14) | JPT | Cat#PM-WCPV-Y14 |
| PepMix™ HCoV- HKU1 (Spike Glycoprotein) | JPT | Cat#PM-HKU1-S-1 |
| PepMix™ HCoV-NL63 (Spike Glycoprotein) | JPT | Cat#PM-NL63-S-1 |
| PepMix™ HCoV-OC43 (Spike Glycoprotein) | JPT | Cat# PM-OC43-S-1 |
| PepMix™ HCoV-229E (Spike Glycoprotein) | JPT | Cat# PM-229E-S-1 |
Resource Availability
Lead Contact
Further information and requests for resources and reagents should be directed to and will be fulfilled by the Lead Contact, Petra Bacher (p.bacher@ikmb.uni-kiel.de).
Materials Availability
This study did not generate new unique reagents.
Data and Code Availability
ScRNA-seq data generated during this study are available at the Gene Expression Omnibus with the accession number GEO: GSE162086. ScRNA-seq data generated during this study has also been deposited to FastGenomics (“https://www.fastgenomics.org”) and TCR sequences used in the single-cell analysis are provided in Table S3.
Supplemental Data are available on Mendeley Data: (https://data.mendeley.com/datasets/3j66sscn92/draft?a=4f9dc90c-e38e-4352-95d3-fea900940317).
Experimental Model and Subject Details
COVID-19 patients and unexposed donors
This study was approved bythe Institutional Review board of the UKSH Kiel (Identifier D 474/20), the University Hospital Frankfurt (Identifier 11/17) and patients were enrolled in the protocol Coronavirus Disease 19 – BioMaSOTA - Genetic factors and longitudinal monitoring of the immune response in COVID-19 (Identifier of the University of Cologne Ethics Committee 20-1295) and Improving Diagnosis of Severe Infections of Immunocompromised Patients (Identifier of the University of Cologne Ethics Committee 08-160) and signed informed consents. Peripheral EDTA blood samples were collected between April and September 2020 from 56 COVID-19 patients and from 64 in-house volunteers as unexposed controls (see Tables S1 and S2 for further details). 51 of 56 COVID-19 patients were tested positive and for SARS-CoV-2 RNA. We included 5 mild cases of COVID-19 without positive SARS-CoV2 RNA test, but with positive detection of antibodies using a certified antibody test (Elecsys Anti-SARS-CoV-2, Roche Diagnostics GmbH, Mannheim, Germany) who had clinical symptoms suggestive of COVID-19 and a traceable contact person found positive. All, except three active COVID-19 patients who had a positive SARS-CoV-2 RNA test, were tested positive for SARS-CoV-2 antibodies (Elecsys Anti-SARS-CoV-2, Roche Diagnostics GmbH and/ or Anti-SARS-CoV-2 ELISA, Euroimmun, Lübeck, Germany). All healthy controls were tested negative for SARS-CoV-2 antibodies (Elecsys Anti-SARS-CoV-2, Roche Diagnostics GmbH). The COVID-19 severity was assessed based on WHO ordinal scale (https://www.who.int/publications/i/item/covid-19-therapeutic-trial-synopsis).
Method Details
Antigens
Pools of lyophilized 15-mer peptides with 11–amino acid overlap, covering the complete protein sequence were purchased from Miltenyi Biotec (Bergisch Gladbach, Germany): SARS-CoV-2 membrane, nucleocapsid; JPT (Berlin, Germany): SARS-CoV-2 Spike N-term, Spike C-term, ORF3a, ORF9B, ORF10, NS6, NS7a, NS7b, NS8, VEMP, Y14 and CCCoV Spike proteins (229E, OC43, HKU1, NL63).
Peptide pools of control antigens Influenza A H1N1 (HA, MP1, MP2, NP and NA), CMV (pp65, IE-1), EBV (EBNA1, BZLF1, LMP2A, LMP1), AdV (Hexon) were purchased from Miltenyi Biotec. Pools were resuspended according to manufactureŕs instructions and cells were stimulated at a concentration of 0.5 μg/peptide/mL until otherwise indicated in the figures and figure legends. Tetanus-toxoid was purchased from Statens Serum Institute and used at a concentration of 10 μg/mL.
Antigen-reactive T cell enrichment (ARTE)
Peripheral blood mononuclear cells were freshly isolated from 20-50ml EDTA blood on the day of blood donation by density gradient centrifugation (Biocoll; Biochrom, Berlin, Germany). Antigen-reactive T cell enrichment (ARTE) was performed as previously described (Bacher et al., 2016; Bacher et al., 2019; Bacher et al., 2013). In brief, 0.5-2 × 10e7 PBMCs were plated in RPMI-1640 medium (GIBCO), supplemented with 5% (v/v) human AB-serum (Sigma Aldrich, Schnelldorf, Germany) at a cell density of 1 × 10e7 PBMCs / 2 cm2 in cell culture plates and stimulated for 7 h in presence of 1 μg/mL CD40 and 1 μg/mL CD28 pure antibody (both Miltenyi Biotec, Bergisch Gladbach, Germany). 1 μg/mL Brefeldin A (Sigma Aldrich) was added for the last 2 h.
Cells were labeled with CD154-Biotin followed by anti-Biotin (CD154 MicroBead Kit, Miltenyi Biotec) and magnetically enriched by two sequential MS columns (Miltenyi Biotec). Surface staining was performed on the first column, followed by fixation and intracellular staining on the second column. Frequencies of antigen-specific T cells were determined based on the cell count of CD154+ T cells after enrichment, normalized to the total number of CD4+ T cells applied on the column. For each stimulation, CD154+ background cells enriched from the non-stimulated control were subtracted.
Flow cytometry
Cells were stained in different combinations of fluorochrome-conjugated antibodies (see Key Resources Table). Viobility 405/520 Fixable Dye (Miltenyi Biotec) was used to exclude dead cells. For intracellular staining cells were fixed and permeabilized with the Inside stain Kit (Miltenyi Biotec). Data were acquired on a LSR Fortessa (BD Bioscience, San Jose, CA, USA). Screening of expanded T cell lines on 384-well plates was performed on a MACSQuantX Analyzer (Miltenyi Biotec). FlowJo (Treestar, Ashland, OR, USA) software was used for analysis.
Expansion and re-stimulation of antigen-reactive T cells
For expansion of antigen-specific T cell lines, PBMCs were stimulated for 6 h, CD154+ cells were isolated by MACS and further purified by FACS sorting on a FACS Aria Fusion (BD Bioscience, San Jose, CA, USA) based on dual expression of CD154 and CD69. Purified CD154+ T cells were expanded in presence of 1:100 autologous antigen-loaded irradiated feeder cells in TexMACS medium (Miltenyi Biotec), supplemented with 5% (v/v) human AB-serum (GemCell), 200 U/mL IL-2 (Proleukin; Novartis, Nürnberg, Germany), and 100 IU/mL penicillin, 100 μg/mL streptomycin, 0.25 μg/mL amphotericin B (Antibiotic Antimycotic Solution, Sigma Aldrich) at a density of 2.5 × 10e6 cells/cm2. During expansion for 2-3 weeks, medium was replenished and cells were split as needed.
For re-stimulation, fastDCs were generated from autologous CD14+ MACS isolated monocytes (CD14 MicroBeads; Miltenyi Biotec) by cultivation in X-Vivo15 medium (BioWhittaker/Lonza), supplemented with 1000 IU/mL GM-CSF and 400 IU/mL IL-4 (both Miltenyi Biotec). Before re-stimulation expanded T cells were rested in RPMI-1640 + 5% human AB-serum without IL-2 for 2 days. 0.5-1 × 10e5 expanded T cells were plated with fastDCs in a ratio 1:1 of in 384-well flat bottom plates and re-stimulated for 6 h, with 1 μg/mL Brefeldin A (Sigma Aldrich) added for the last 4 h.
Analysis of functional avidity
For determining the functional avidity, in vitro expanded SARS-CoV-2-specific T cells were re-challenged with decreasing antigen concentrations (0.5, 0.25, 0.01, 0.025, 0.0025, 0.001 μg/ peptide/mL) and analyzed for re-expression of CD154 and cytokines. Antigen concentrations required for half-maximal response (EC50 values) were calculated from dose-response curves using GraphPad PRISM. These curves were plotted as a semi-logarithmic plot, where the amount of antigen is plotted (on the x axis) as the log of antigen concentration and the response is plotted (on the y axis) using a linear scale. To compare the EC50 values of different donors, the bottom and top of the curve were defined as 0 and 100%, respectively.
Single-cell RNA-seq assay (10x Genomics)
For single cell transcriptomics, CD154+ cells were isolated by MACS and further purified by FACS sorting on a MACSQuant Tyto (Miltenyi Biotec) based on dual expression of CD154 and CD69. Sorted CD154+ T cells were removed from the sorting chamber into pre-coated low-bind collection tubes, 1ml RPMI1640 medium supplemented with 5% AB Serum was added, and cells were centrifuged for 5 min at 400 x g, 4°C. The supernatant was carefully removed leaving 10-30 μL to reach a maximum concentration of 1000 cells /μl.
Single-cell suspensions were loaded on a Chromium Chip G (10x Genomics) according to the manufacturer’s instructions for processing with the Chromium Next GEM Single Cell 5¢ Library and Gel Bead Kit v1.1. Depending on the number of cells available for each patient, a maximum of 30,000 cells were loaded for each reaction. TCR single-cell libraries were subsequently prepared from the same cells with the Chromium Single Cell V(D)J Enrichment Kit, Human T Cell. Libraries were sequenced on Illumina NovaSeq 6000 machine with 2x100 bp for gene expression, aiming for 50,000 reads per cell and 2x150 bp and 5000 reads per cell for TCR libraries.
Single cell T cell receptor (TCR) sequence analysis
Single-cell T cell receptor repertoire clonotype tables were generated using the VDJ command of the Cellranger software, version 3.1.0. from 10xGenomics and using the reference GRCh38 version 2.0.0. Clonotype tables were filtered in order to include only cells which passed quality filtering in the gene expression analysis. In addition, clonotypes were stringently filtered for possible doublets by removing clonotypes (i) found in 1 cell only and containing more than 1 TCR alpha and 1 TCR beta (ii) containing more than 1 TCR alpha and no TCR beta sequence (iii) containing more than 1 TCR beta and no TCR alpha sequence (iv) containing more than 2 TCR alpha or more than 2 TCR beta sequences.
Alpha diversity measures were calculated for each patient either for the whole repertoire or divided based on Seurat clusters. R packages “vegan” and “tcR” were used to calculate the Inverse Simpson diversity index and the Gini inequality index, respectively. For these analyses samples were normalized by selection of the most abundant 50 clonotypes in order to remove the impact of different sample sizes (number of cells per sample) and to analyze only the distribution of the most expanded clonotypes.
Analysis of the most expanded clonotypes was conducted by selecting the 3 most expanded clonotypes per sample. To evaluate potentially existing preferential cumulation of most expanded clonotypes in certain functional clusters, the proportion of cells carrying these clonotypes falling in each distinct Seurat cluster was calculated.
Single-cell transcriptome analysis
The preprocessing of the scRNA data were performed with the 10x Genomics’ Cell Ranger software v3.1.0 using the reference GRCh38 v3.0.0 for the mappings. The resulting filtered feature-barcode matrix files were analyzed with the R package Seurat v.3.2.0 (Butler et al., 2018). Thereby, all genes with a detected expression in less than 0.1% of the non-empty cells were excluded. Moreover, TCR genes were not considered for further analyses to avoid functional clustering of cells based on TCR information. To minimize the number of doublets, empty cells, and cells with a transcriptome in low quality, only cells harboring between 840 (minimum median among samples) and 3000 RNA features and less than 5% mitochondrial RNA were selected for further processing. Afterward, data were log-normalized and scaled based on all genes. After performing a PCA dimensionality reduction (20 dimensions) with the RunPCA function, the expression values were corrected for effects caused by different sample preparation time points in time using the R package Harmony v1.0 (Korsunsky et al., 2019). In the final steps, the Uniform Manifold Approximation and Projection (UMAP) dimensional reduction was performed with the RunUMAP function using 20 dimensions, a shared nearest neighbor graph was created with the FindNeighbors method, and the clusters identification was performed with a resolution of 0.2 using the FindClusters function. Positive cluster marker genes were determined using FindMarkers with the MAST method (Finak et al., 2015). Thereby, only genes with detected expression in at least 25% of the cells in the respective cluster were considered.
Quantification and Statistical Analysis
Statistical parameters including the exact value of n, the definition of center, dispersion and precision measure, and statistical significance are reported in the Figures and the Figure Legends. Statistical tests were performed with GraphPad PRISM software 8.4 (GraphPad Software, La Jolla, CA, USA). Statistical tests were selected based on appropriate assumptions with respect to data distribution and variance characteristics, p values < 0.05 were considered statistically significant.
Software
Flow-cytometry data were analyzed using FlowJo (Treestar, Ashland, OR, USA) software. Graphics and statistics were created with GraphPad PRISM software version 8.4.3. (GraphPad Software, La Jolla, CA, USA). Heatmaps were generated using Genesis software (Sturn et al., 2002), version 1.7.7.
Acknowledgments
We thank Daniel Unterweger, Ulf Klein, and Chiara Romagnani for critical reading of the manuscript; the flow-cytometry facility Cyto Kiel, especially Esther Schiminsky and the Competence Centre for Genomic Analysis (CCGA) Kiel, Janina Fuß, Sören Franzesnburg, Yewgenia Dolshanskaya, Catharina von der Lancken, Melanie Vollstedt, and Melanie Schlapkohl for support with cell sorting and single-cell sequencing; and the Clinical Trial Unit 2 of the University Hospital of Cologne for help with recruiting study participants and technical assistance. This research was supported by the German Research Foundation (DFG) under Germany’s Excellence Strategy — EXC 2167-390884018 Precision Medicine in Chronic Inflammation to P.B., A.F., and A.S.; RU5042-miTarget to P.B. and A.F.; DFG 433038070 to P.B., A.F., and A.S.; DFG 4096610003 to E.R; by a COVID-19 research grant from the Land Schleswig-Holstein, DIO002/ CoVispecT to P.B. and A.S.; the BMBF Grant AnDiPath (Fkz 03ZZ0838B) to A.S.; F.L. and D.E. were supported by the E-Rare Joint Transnational research support (ERA-Net, LE3064/2-1); and M.A. was supported by the BMBF Grant COVIM “NaFoUniMedCovid19” (FKZ: 01KX2021). F.L. is supported by German Ministry of Education and Research (01GM1908A). O.A.C. is supported by the German Federal Ministry of Research and Education and is funded by the DFG under Germany’s Excellence Strategy, CECAD, EXC 2030 – 390661388.
Author Contributions
Conceptualization: P.B. and A.S.; Investigation: P.B., E.R., G.R.M., and C.S.; Formal analysis: P.B., E.R., D.E., and P.K.; Resources: J.D., I.S., I.W., Y.K., F.E., M.J.G.T.V., H.N., M.S., C.C., F.T., P.R., R.M., K.P.W., M.A., J.R., M.K., F.L., O.A.C., P.K., and A.F.; Funding acquisition: P.B. and A.S. All authors provided discussion, participated in revising the manuscript, and agreed to the final version.
Declaration of Interests
P.B. and A.S. are consultants of Miltenyi Biotec, who own IP rights concerning parts of the ARTE technology. M.J.G.T.V. has received research grants from 3M, Astellas Pharma, Biontech, DaVolterra, Evonik, Gilead Sciences, Glycom, Immunic, MaaT Pharma, Merck/MSD, Organobalance, Seres Therapeutics, and Takeda Pharmaceutical; speakers fees from Astellas Pharma, Basilea, Gilead Sciences, Merck/MSD, Organobalance, and Pfizer; and consultation fees from Alb Fils Kliniken GmbH, Arderypharm, Astellas Pharma, DaVolterra, Farmak International Holding GmbH, Ferring, Immunic AG, MaaT Pharma, Merck/MSD, and SocraTec R&D GmbH. F.L. discloses speaker honoraria from Grifols, Teva, Biogen, Bayer, Roche, Novartis, and Fresenius; travel funding from Merck, Grifols, and Bayer; and serves on advisory boards for Roche, Biogen, and Alexion. P.K. has received non-financial scientific grants from Miltenyi Biotec GmbH and the CECAD, University of Cologne, outside the submitted work. O.A.C. has received research grants from, is an advisor to, or received lecture honoraria from Actelion, Allecra, Amplyx, Astellas, Basilea, Biosys, Cidara, Da Volterra, Entasis, F2G, Gilead, Grupo Biotoscana, IQVIA, Janssen, Matinas, Medicines Company, MedPace, Melinta, Menarini, Merck/MSD, Mylan, Nabriva, Noxxon, Octapharma, Paratek, Pfizer, PSI, Roche Diagnostics, Scynexis, and Shionogi.
Published: December 15, 2020
Footnotes
Supplemental Information can be found online at https://doi.org/10.1016/j.immuni.2020.11.016.
Supplemental Information
References
- Anft M., Paniskaki K., Blazquez-Navarro A., Doevelaar A.A.N., Seibert F., Hoelzer B., Skrzypczyk S., Kohut E., Kurek J., Zapka J., et al. COVID-19 progression is potentially driven by T cell immunopathogenesis. medRxiv. 2020 2020.2004.2028.20083089. [Google Scholar]
- Bacher P., Scheffold A. Flow-cytometric analysis of rare antigen-specific T cells. Cytometry A. 2013;83:692–701. doi: 10.1002/cyto.a.22317. [DOI] [PubMed] [Google Scholar]
- Bacher P., Scheffold A. New technologies for monitoring human antigen-specific T cells and regulatory T cells by flow-cytometry. Curr. Opin. Pharmacol. 2015;23:17–24. doi: 10.1016/j.coph.2015.04.005. [DOI] [PubMed] [Google Scholar]
- Bacher P., Schink C., Teutschbein J., Kniemeyer O., Assenmacher M., Brakhage A.A., Scheffold A. Antigen-reactive T cell enrichment for direct, high-resolution analysis of the human naive and memory Th cell repertoire. J. Immunol. 2013;190:3967–3976. doi: 10.4049/jimmunol.1202221. [DOI] [PubMed] [Google Scholar]
- Bacher P., Heinrich F., Stervbo U., Nienen M., Vahldieck M., Iwert C., Vogt K., Kollet J., Babel N., Sawitzki B., et al. Regulatory T Cell Specificity Directs Tolerance versus Allergy against Aeroantigens in Humans. Cell. 2016;167:1067–1078. doi: 10.1016/j.cell.2016.09.050. [DOI] [PubMed] [Google Scholar]
- Bacher P., Hohnstein T., Beerbaum E., Rocker M., Blango M.G., Kaufmann S., Rohmel J., Eschenhagen P., Grehn C., Seidel K., et al. Human Anti-fungal Th17 Immunity and Pathology Rely on Cross-Reactivity against Candida albicans. Cell. 2019;176:1340–1355 e1315. doi: 10.1016/j.cell.2019.01.041. [DOI] [PubMed] [Google Scholar]
- Birnbaum M.E., Mendoza J.L., Sethi D.K., Dong S., Glanville J., Dobbins J., Ozkan E., Davis M.M., Wucherpfennig K.W., Garcia K.C. Deconstructing the peptide-MHC specificity of T cell recognition. Cell. 2014;157:1073–1087. doi: 10.1016/j.cell.2014.03.047. [DOI] [PMC free article] [PubMed] [Google Scholar]
- Braun J., Loyal L., Frentsch M., Wendisch D., Georg P., Kurth F., Hippenstiel S., Dingeldey M., Kruse B., Fauchere F., et al. SARS-CoV-2-reactive T cells in healthy donors and patients with COVID-19. Nature. 2020;587:270–274. doi: 10.1038/s41586-020-2598-9. [DOI] [PubMed] [Google Scholar]
- Butler A., Hoffman P., Smibert P., Papalexi E., Satija R. Integrating single-cell transcriptomic data across different conditions, technologies, and species. Nat. Biotechnol. 2018;36:411–420. doi: 10.1038/nbt.4096. [DOI] [PMC free article] [PubMed] [Google Scholar]
- Campion S.L., Brodie T.M., Fischer W., Korber B.T., Rossetti A., Goonetilleke N., McMichael A.J., Sallusto F. Proteome-wide analysis of HIV-specific naive and memory CD4(+) T cells in unexposed blood donors. J. Exp. Med. 2014;211:1273–1280. doi: 10.1084/jem.20130555. [DOI] [PMC free article] [PubMed] [Google Scholar]
- Chen Z., John Wherry E. T cell responses in patients with COVID-19. Nat. Rev. Immunol. 2020;20:529–536. doi: 10.1038/s41577-020-0402-6. [DOI] [PMC free article] [PubMed] [Google Scholar]
- Diao B., Wang C., Tan Y., Chen X., Liu Y., Ning L., Chen L., Li M., Liu Y., Wang G., et al. Reduction and Functional Exhaustion of T Cells in Patients With Coronavirus Disease 2019 (COVID-19) Front. Immunol. 2020;11:827. doi: 10.3389/fimmu.2020.00827. [DOI] [PMC free article] [PubMed] [Google Scholar]
- Finak G., McDavid A., Yajima M., Deng J., Gersuk V., Shalek A.K., Slichter C.K., Miller H.W., McElrath M.J., Prlic M., et al. MAST: a flexible statistical framework for assessing transcriptional changes and characterizing heterogeneity in single-cell RNA sequencing data. Genome Biol. 2015;16:278. doi: 10.1186/s13059-015-0844-5. [DOI] [PMC free article] [PubMed] [Google Scholar]
- Gaunt E.R., Hardie A., Claas E.C., Simmonds P., Templeton K.E. Epidemiology and clinical presentations of the four human coronaviruses 229E, HKU1, NL63, and OC43 detected over 3 years using a novel multiplex real-time PCR method. J. Clin. Microbiol. 2010;48:2940–2947. doi: 10.1128/JCM.00636-10. [DOI] [PMC free article] [PubMed] [Google Scholar]
- Gras S., Kedzierski L., Valkenburg S.A., Laurie K., Liu Y.C., Denholm J.T., Richards M.J., Rimmelzwaan G.F., Kelso A., Doherty P.C., et al. Cross-reactive CD8+ T-cell immunity between the pandemic H1N1-2009 and H1N1-1918 influenza A viruses. Proc. Natl. Acad. Sci. USA. 2010;107:12599–12604. doi: 10.1073/pnas.1007270107. [DOI] [PMC free article] [PubMed] [Google Scholar]
- Greiling T.M., Dehner C., Chen X., Hughes K., Iñiguez A.J., Boccitto M., Ruiz D.Z., Renfroe S.C., Vieira S.M., Ruff W.E., et al. Commensal orthologs of the human autoantigen Ro60 as triggers of autoimmunity in lupus. Sci. Transl. Med. 2018;10:eaan2306. doi: 10.1126/scitranslmed.aan2306. [DOI] [PMC free article] [PubMed] [Google Scholar]
- Grifoni A., Weiskopf D., Ramirez S.I., Mateus J., Dan J.M., Moderbacher C.R., Rawlings S.A., Sutherland A., Premkumar L., Jadi R.S., et al. Targets of T Cell Responses to SARS-CoV-2 Coronavirus in Humans with COVID-19 Disease and Unexposed Individuals. Cell. 2020;181:1489–1501. doi: 10.1016/j.cell.2020.05.015. [DOI] [PMC free article] [PubMed] [Google Scholar]
- Hayward A.C., Wang L., Goonetilleke N., Fragaszy E.B., Bermingham A., Copas A., Dukes O., Millett E.R., Nazareth I., Nguyen-Van-Tam J.S., et al. Flu Watch Group Natural T Cell-mediated Protection against Seasonal and Pandemic Influenza. Results of the Flu Watch Cohort Study. Am. J. Respir. Crit. Care Med. 2015;191:1422–1431. doi: 10.1164/rccm.201411-1988OC. [DOI] [PMC free article] [PubMed] [Google Scholar]
- Huang C., Wang Y., Li X., Ren L., Zhao J., Hu Y., Zhang L., Fan G., Xu J., Gu X., et al. Clinical features of patients infected with 2019 novel coronavirus in Wuhan, China. Lancet. 2020;395:497–506. doi: 10.1016/S0140-6736(20)30183-5. [DOI] [PMC free article] [PubMed] [Google Scholar]
- Korsunsky I., Millard N., Fan J., Slowikowski K., Zhang F., Wei K., Baglaenko Y., Brenner M., Loh P.R., Raychaudhuri S. Fast, sensitive and accurate integration of single-cell data with Harmony. Nat. Methods. 2019;16:1289–1296. doi: 10.1038/s41592-019-0619-0. [DOI] [PMC free article] [PubMed] [Google Scholar]
- Koutsakos M., Illing P.T., Nguyen T.H.O., Mifsud N.A., Crawford J.C., Rizzetto S., Eltahla A.A., Clemens E.B., Sant S., Chua B.Y., et al. Human CD8+ T cell cross-reactivity across influenza A, B and C viruses. Nat. Immunol. 2019;20:613–625. doi: 10.1038/s41590-019-0320-6. [DOI] [PubMed] [Google Scholar]
- Kwok W.W., Tan V., Gillette L., Littell C.T., Soltis M.A., LaFond R.B., Yang J., James E.A., DeLong J.H. Frequency of epitope-specific naive CD4(+) T cells correlates with immunodominance in the human memory repertoire. J. Immunol. 2012;188:2537–2544. doi: 10.4049/jimmunol.1102190. [DOI] [PMC free article] [PubMed] [Google Scholar]
- Lanzer K.G., Johnson L.L., Woodland D.L., Blackman M.A. Impact of ageing on the response and repertoire of influenza virus-specific CD4 T cells. Immun. Ageing. 2014;11:9. doi: 10.1186/1742-4933-11-9. [DOI] [PMC free article] [PubMed] [Google Scholar]
- Lanzer K.G., Cookenham T., Reiley W.W., Blackman M.A. Virtual memory cells make a major contribution to the response of aged influenza-naïve mice to influenza virus infection. Immun. Ageing. 2018;15:17. doi: 10.1186/s12979-018-0122-y. [DOI] [PMC free article] [PubMed] [Google Scholar]
- Le Bert N., Tan A.T., Kunasegaran K., Tham C.Y.L., Hafezi M., Chia A., Chng M.H.Y., Lin M., Tan N., Linster M., et al. SARS-CoV-2-specific T cell immunity in cases of COVID-19 and SARS, and uninfected controls. Nature. 2020;584:457–462. doi: 10.1038/s41586-020-2550-z. [DOI] [PubMed] [Google Scholar]
- Mateus J., Grifoni A., Tarke A., Sidney J., Ramirez S.I., Dan J.M., Burger Z.C., Rawlings S.A., Smith D.M., Phillips E., et al. Selective and cross-reactive SARS-CoV-2 T cell epitopes in unexposed humans. Science. 2020;370:89–94. doi: 10.1126/science.abd3871. [DOI] [PMC free article] [PubMed] [Google Scholar]
- Meckiff B.J., Ramirez-Suastegui C., Fajardo V., Chee S.J., Kusnadi A., Simon H., Eschweiler S., Grifoni A., Pelosi E., Weiskopf D., et al. Imbalance of regulatory and cytotoxic SARS-CoV-2-reactive CD4+ T cells in COVID-19. Cell. 2020;183:1–14. doi: 10.1016/j.cell.2020.10.001. [DOI] [PMC free article] [PubMed] [Google Scholar]
- Nelde A., Bilich T., Heitmann J.S., Maringer Y., Salih H.R., Roerden M., Lubke M., Bauer J., Rieth J., Wacker M., et al. SARS-CoV-2-derived peptides define heterologous and COVID-19-induced T cell recognition. Nat Immunol. 2020 doi: 10.1038/s41590-020-00808-x. [DOI] [PubMed] [Google Scholar]
- Peng Y., Mentzer A.J., Liu G., Yao X., Yin Z., Dong D., Dejnirattisai W., Rostron T., Supasa P., Liu C., et al. Oxford Immunology Network Covid-19 Response T cell Consortium. ISARIC4C Investigators Broad and strong memory CD4+ and CD8+ T cells induced by SARS-CoV-2 in UK convalescent individuals following COVID-19. Nat. Immunol. 2020;21:1336–1345. doi: 10.1038/s41590-020-0782-6. [DOI] [PMC free article] [PubMed] [Google Scholar]
- Rydyznski Moderbacher C., Ramirez S.I., Dan J.M., Grifoni A., Hastie K.M., Weiskopf D., Belanger S., Abbott R.K., Kim C., Choi J., et al. Antigen-Specific Adaptive Immunity to SARS-CoV-2 in Acute COVID-19 and Associations with Age and Disease Severity. Cell. 2020;183:996–1012. doi: 10.1016/j.cell.2020.09.038. [DOI] [PMC free article] [PubMed] [Google Scholar]
- Schulz A.R., Mälzer J.N., Domingo C., Jürchott K., Grützkau A., Babel N., Nienen M., Jelinek T., Niedrig M., Thiel A. Low Thymic Activity and Dendritic Cell Numbers Are Associated with the Immune Response to Primary Viral Infection in Elderly Humans. J. Immunol. 2015;195:4699–4711. doi: 10.4049/jimmunol.1500598. [DOI] [PubMed] [Google Scholar]
- Sekine T., Perez-Potti A., Rivera-Ballesteros O., Stralin K., Gorin J.B., Olsson A., Llewellyn-Lacey S., Kamal H., Bogdanovic G., Muschiol S., et al. ). Robust T Cell Immunity in Convalescent Individuals with Asymptomatic or Mild COVID-19. Cell. 2020;183:158–168. doi: 10.1016/j.cell.2020.08.017. [DOI] [PMC free article] [PubMed] [Google Scholar]
- Seow J. Longitudinal evaluation and decline of antibody responses in SARS-CoV-2 infection. medRxiv. 2020 doi: 10.1101/2020.07.09.20148429. [DOI] [Google Scholar]
- Sette A., Crotty S. Pre-existing immunity to SARS-CoV-2: the knowns and unknowns. Nat Rev Immunol. 2020;20:457–458. doi: 10.1038/s41577-020-0389-z. [DOI] [PMC free article] [PubMed] [Google Scholar]
- Sewell A.K. Why must T cells be cross-reactive? Nat. Rev. Immunol. 2012;12:669–677. doi: 10.1038/nri3279. [DOI] [PMC free article] [PubMed] [Google Scholar]
- Sridhar S., Begom S., Bermingham A., Hoschler K., Adamson W., Carman W., Bean T., Barclay W., Deeks J.J., Lalvani A. Cellular immune correlates of protection against symptomatic pandemic influenza. Nat. Med. 2013;19:1305–1312. doi: 10.1038/nm.3350. [DOI] [PubMed] [Google Scholar]
- Sturn A., Quackenbush J., Trajanoski Z. Genesis: cluster analysis of microarray data. Bioinformatics. 2002;18:207–208. doi: 10.1093/bioinformatics/18.1.207. [DOI] [PubMed] [Google Scholar]
- Su L.F., Kidd B.A., Han A., Kotzin J.J., Davis M.M. Virus-specific CD4(+) memory-phenotype T cells are abundant in unexposed adults. Immunity. 2013;38:373–383. doi: 10.1016/j.immuni.2012.10.021. [DOI] [PMC free article] [PubMed] [Google Scholar]
- Tan L., Wang Q., Zhang D., Ding J., Huang Q., Tang Y.Q., Wang Q., Miao H. Lymphopenia predicts disease severity of COVID-19: a descriptive and predictive study. Signal Transduct. Target. Ther. 2020;5:33. doi: 10.1038/s41392-020-0148-4. [DOI] [PMC free article] [PubMed] [Google Scholar]
- Wang D., Hu B., Hu C., Zhu F., Liu X., Zhang J., Wang B., Xiang H., Cheng Z., Xiong Y., et al. JAMA; China: 2020. Clinical Characteristics of 138 Hospitalized Patients With 2019 Novel Coronavirus-Infected Pneumonia in Wuhan. [DOI] [PMC free article] [PubMed] [Google Scholar]
- Weiskopf D., Schmitz K.S., Raadsen M.P., Grifoni A., Okba N.M.A., Endeman H., van den Akker J.P.C., Molenkamp R., Koopmans M.P.G., van Gorp E.C.M., et al. Phenotype and kinetics of SARS-CoV-2-specific T cells in COVID-19 patients with acute respiratory distress syndrome. Sci. Immunol. 2020;5:eabd2071. doi: 10.1126/sciimmunol.abd2071. [DOI] [PMC free article] [PubMed] [Google Scholar]
- Welsh R.M., Che J.W., Brehm M.A., Selin L.K. Heterologous immunity between viruses. Immunol. Rev. 2010;235:244–266. doi: 10.1111/j.0105-2896.2010.00897.x. [DOI] [PMC free article] [PubMed] [Google Scholar]
- Wilk A.J., Rustagi A., Zhao N.Q., Roque J., Martínez-Colón G.J., McKechnie J.L., Ivison G.T., Ranganath T., Vergara R., Hollis T., et al. A single-cell atlas of the peripheral immune response in patients with severe COVID-19. Nat. Med. 2020;26:1070–1076. doi: 10.1038/s41591-020-0944-y. [DOI] [PMC free article] [PubMed] [Google Scholar]
- Woodland D.L., Blackman M.A. Immunity and age: living in the past? Trends Immunol. 2006;27:303–307. doi: 10.1016/j.it.2006.05.002. [DOI] [PMC free article] [PubMed] [Google Scholar]
- Yang X., Yu Y., Xu J., Shu H., Xia J., Liu H., Wu Y., Zhang L., Yu Z., Fang M., et al. Clinical course and outcomes of critically ill patients with SARS-CoV-2 pneumonia in Wuhan, China: a single-centered, retrospective, observational study. Lancet Respir. Med. 2020;8:475–481. doi: 10.1016/S2213-2600(20)30079-5. [DOI] [PMC free article] [PubMed] [Google Scholar]
- Zheng H.Y., Zhang M., Yang C.X., Zhang N., Wang X.C., Yang X.P., Dong X.Q., Zheng Y.T. Elevated exhaustion levels and reduced functional diversity of T cells in peripheral blood may predict severe progression in COVID-19 patients. Cell. Mol. Immunol. 2020;17:541–543. doi: 10.1038/s41423-020-0401-3. [DOI] [PMC free article] [PubMed] [Google Scholar]
Associated Data
This section collects any data citations, data availability statements, or supplementary materials included in this article.
Supplementary Materials
Data Availability Statement
ScRNA-seq data generated during this study are available at the Gene Expression Omnibus with the accession number GEO: GSE162086. ScRNA-seq data generated during this study has also been deposited to FastGenomics (“https://www.fastgenomics.org”) and TCR sequences used in the single-cell analysis are provided in Table S3.
Supplemental Data are available on Mendeley Data: (https://data.mendeley.com/datasets/3j66sscn92/draft?a=4f9dc90c-e38e-4352-95d3-fea900940317).