Abstract
A series of pharmaceutical metal complexes (pMCs) were produced and characterized using the mast cell stabilizer, cromolyn, and bioactive metal ions (Zn+2, Mg+2, and Ca+2). Three novel pMCs, Cromolyn-Zn, Cromolyn-Mg, and Cromolyn-Ca, were formed through reactions under controlled temperature and pH conditions. Additional characterization for these materials was performed employing a number of solid-state characterization techniques, such as thermogravimetric analysis (TGA), powder and single-crystal X-ray diffraction (PXRD and SCXRD), and scanning electron microscopy coupled with energy-dispersive spectroscopy (SEM-EDS). TGA demonstrated that these metal complexes showed an enhanced thermal stability due to the strong coordination with the ligand, cromolyn. PXRD data indicates a high degree of crystallinity as well as a unique packing arrangement for each pMCs. SEM analysis showed materials with well-defined morphologies, while EDS presented elemental evidence for the unique composition of each pMCs. The crystal structure for these materials was elucidated through SCXRD, and a variety of binding modes and packing motifs were found within each respective metal complex. Only two-dimensional (2D) structures were achieved under the conditions studied. These binding modalities might affect the activity and delivery of cromolyn sodium (CS). The stability of the metal complexes was assessed in phosphate-buffered saline (PBS, pH = 7.40) and fasted-state simulated gastric fluids (FaSSGF, pH = 1.60). Dissolution studies show high stability and slow degradation for the metal complexes, while a higher dissolution was observed for the drug compound in PBS. Neither CS nor the pMCs dissolved significantly in FaSSGF at 37 °C.
Introduction
Cromolyn sodium (CS) is a mast cell stabilizer commonly prescribed for its therapeutic role in the treatment of allergic diseases.1 It was originally introduced to treat allergic asthma and has quickly shown to be effective in the treatment of intestinal allergies, mastocytosis, and allergic skin conditions.2−4 Previous studies on the pharmacological actions of CS indicate that it prevents the release of mediators from mast cells, induced by specific antigens, and some studies suggest that it can also inhibit the activity of other cell types.5−8 Most recently, CS has shown activity against coronary artery disease, Alzheimer, and motor neuron diseases due to its anti-inflammatory abilities.9−11 CS can be administered via inhalation, intranasal, oral, or ophthalmic routes.12 When delivering CS through an intranasal route, it is known to cause irritation to the nasal mucosa.13 The transdermal route of delivery has also been investigated for CS.14 Here, the self-aggregation tendency of this surface-active drug (a pharmaceutically active compound with an amphiphilic nature) might make it possible to module its permeation profile.14
CS is categorized as a Class III compound within the biopharmaceutical classification system (BCS). The high solubility and low permeability presented by CS hinder its ability to be absorbed from the gastrointestinal tract (bioavailability <1%) and make it difficult to achieve a therapeutic effect when orally administered.12,15 Despite these pharmacological drawbacks, CS is still considered to be an effective drug in the treatment of allergic diseases, mainly due to being well tolerated and low in toxicity.2,5
An approach toward the development of more robust drug delivery systems lies in the binding of ligands and bioactive metals to form metal complexes.16 These complexes can facilitate characterization and reduce variation in the results due to their well-defined crystalline structures, stability, and properties compared to that of polymeric drug delivery systems.
In this study, cromolyn (Figure 1) is employed as a ligand, which in coordination with bioactive metals, and posed to form a series of three-dimensional (3D) flexible metal complexes denominated as pharmaceutical metal complexes (pMCs). These crystalline materials should be able to circulate long enough to reach the target site and perform their therapeutic effect, if provided with an adequate particle size.17 Upon its lifetime, the metal complex should display no adverse side effects and enable the removal of the drug from the body through its degradation in physiological conditions.7 Three bioactive metals (M2+ = Zn2+, Mg2+, and Ca2+), with a lethal dose for 50% of the population (LD50) of 1.0, 8.1, and 0.35 g/kg, were selected for their relatively low toxicity.18−20 Aside from their low toxicity, these play an important role in the regulation of inflammatory responses, which might enhance the therapeutic effect of the active ingredient, CS when delivered as pMCs.19−22
Figure 1.
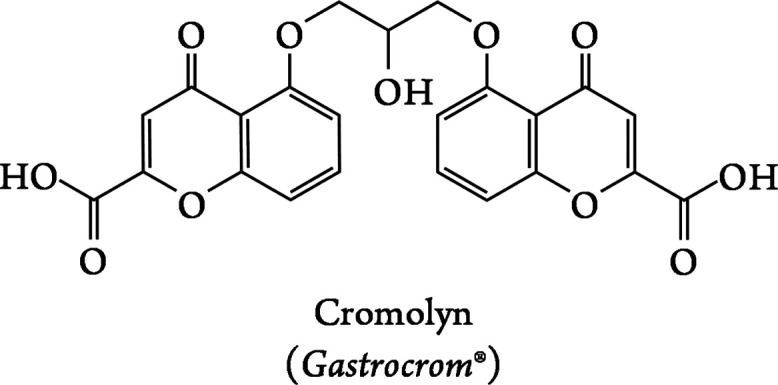
Molecular structure of cromolyn, the ligand utilized within this work.
Syntheses were performed to examine the effect of M2+/Cromolyn molar ratio, temperature, and pH on the crystallization of Cromolyn-based pMCs (Figure 2). A number of the resulting syntheses produced crystalline materials that displayed sufficient quality for structural elucidation by single-crystal X-ray diffraction (SCXRD). Additional characterization techniques were employed to assess the solid-state properties of these materials. In this paper, the synthesis and characterization of the resulting Cromolyn-based pMCs are discussed as well as their stability and dissolution in fasted-state simulated gastric fluids (FaSSGF) (pH = 1.60) and PBS (pH = 7.40) at 37 °C. These studies could lead to the development of novel multidrug delivery systems to better mitigate allergic and inflammatory diseases if 3D pMC structures containing cromolyn could be obtained and their sized controlled.
Figure 2.
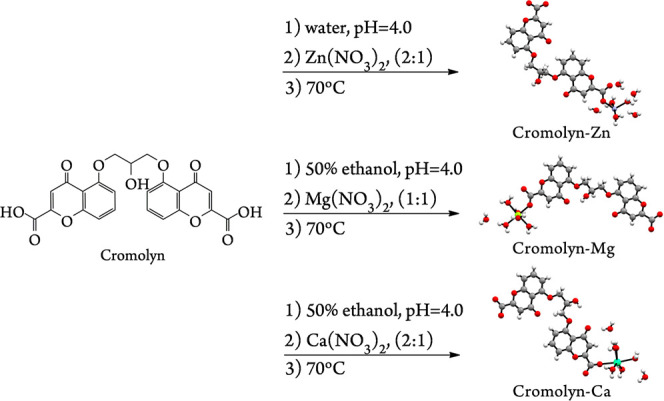
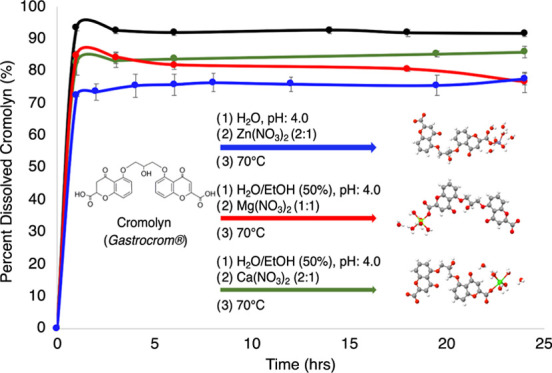
Schematic diagram of the conditions leading to three crystalline phases when cromolyn is coordinated with three bioactive metals (Zn2+, Mg2+, and Ca2+) to form pharmaceutical metal complexes (pMCs). The variables explored were M2+/Cromolyn molar ratio, reaction temperature, and pH.
Experimental Section
Materials
Calcium nitrate tetrahydrate [Ca(NO3)2·4H2O, 99% pure], zinc nitrate hexahydrate [Zn(NO3)2·6H2O, 98% pure], magnesium nitrate hexahydrate [Mg(NO3)2·6H2O, 99% pure], cromolyn sodium (CS, C23H14O11Na2, >95% pure), hydrochloric acid (HCl, 37%), ethyl alcohol [CH3CH2OH, 200 proof], and phosphate-buffered saline (PBS) tablets were purchased from Sigma-Aldrich (St. Louis, MO). A stock solution of HCl (USP grade, 0.01–0.05 M) was used for pH adjustments. Nanopurified water (18.23 MΩ/cm) was utilized as obtained from a water purification system (Aries Filter (Gemini)) in the preparation of solvents, dissolution profiles, and synthesis. All materials were used “as received” without further purification.
General Syntheses for Cromolyn-Based pMCs
The syntheses of Cromolyn-based pMCs were performed by preparing CS solutions and metal salt separately in nanopure water or 50% v/v ethanol in water at room temperature. The pH of the ligand solution was adjusted with a HCl solution above the pKa of cromolyn (pKa = 1.90),23 where a partially deprotonated carboxylic acid species is expected in solution. The concentration of CS during the synthesis in both water and 1:1 water/ethanol mixtures is below 10.00 mg/mL, which is noted by several authors as the critical self-association concentration; thus, a monomeric species predominates under these conditions.24−26 Above this concentration, CS forms supramolecular aggregates with liquid crystal properties.14,25,27 Moreover, Ding et al. indicate that aggregation of CS appeared to be pH independent; thus, even when the syntheses occur below pH 7.5, a monomeric species should still be predominant in solution.25 The metal salt was slowly added to the ligand solution. After mixing thoroughly, the resulting solution was heated at 70 °C until crystals appeared. Once crystals were obtained, these were removed from the heat source and left undisturbed to aid the growth of the crystals. The resulting crystals were collected by vacuum filtration and air-dried. The reaction products observed in the case of Cromolyn-Zn and Cromolyn-Ca appeared as needlelike crystals, whereas those obtained for Cromolyn-Mg presented a blocklike morphology. Polarized micrographs can be found in the Supporting Information. The conditions leading to each of the Cromolyn-based pMCs are provided in detail below.
Cromolyn-Zn
At room temperature, 0.03 mmol (0.0165 g) of solid CS was dissolved in 10.00 mL of nanopure water. The resulting ligand solution was completely transparent (Supporting Information), indicating that under these conditions a monomeric species predominates. The solution was sonicated for 10 min and the pH adjusted (pH = 4.00) with 0.05 M HCl. To this solution, 0.05 mmol (0.0152 g) of Zn(NO3)2·6H2O was added to prepare a mixture with a Zn2+/Cromolyn molar ratio of 2:1. The resulting mixture was heated at 70 °C for 7 days. Clear needlelike crystals (yield < 50%) were collected by vacuum filtration and air-dried.
Cromolyn-Mg
At room temperature, 0.05 mmol (0.0256 g) of solid CS was dissolved in 10.00 mL of 50% v/v ethanol in water. The resulting ligand solution was completely transparent (Supporting Information), indicating that under these conditions a monomeric species predominates. The solution was sonicated for 10 min and the pH adjusted (pH = 4.00) with 0.02 M HCl. To this solution, 0.05 mmol (0.0127 g) of Mg(NO3)2·6H2O was added to prepare a mixture with a Mg2+/Cromolyn molar ratio 1:1. The resulting mixture was heated at 70 °C for 7 days. Clear blocklike crystals (yield < 50%) were collected by vacuum filtration and air-dried.
Cromolyn-Ca
At room temperature, 0.05 mmol (0.0256 g) of solid CS was dissolved in 10.00 mL of 50% v/v ethanol in water. The resulting ligand solution was completely transparent (Supporting Information), indicating that under these conditions a monomeric species predominates. The solution was sonicated for 10 min and the pH adjusted (pH = 4.00) with 0.02 M HCl. To this solution, 0.1 mmol (0.0236 g) of Ca(NO3)2·6H2O was added to prepare a mixture with a Ca2+/Cromolyn molar ratio 2:1. The resulting mixture was heated at 70 °C for 7 days. Clear needlelike crystals (yield < 50%) were collected by vacuum filtration and air-dried.
Raman Microscopy
Raman spectra were recorded in a Thermo Scientific DXR Raman microscope, equipped with a 532 nm laser, 400 lines/nm grating, and 50 μm slit. The spectra were collected at room temperature over the range of 2000–200 cm–1 by averaging 32 scans with exposures of 5 s. This data was collected and analyzed in the OMNIC for Dispersive Raman software version 9.2.0.
Scanning Electron Microscopy–Energy-Dispersive Spectroscopy (SEM-EDS)
Micrographs and X-ray microanalysis were recorded with a JEOL JSM-6480LV scanning electron microscope with an Evenhart Thomley secondary electron imagining (SEI) detector and an energy-dispersive X-ray analysis (EDAX) Genesis 2000 detector. Images were taken with an acceleration voltage of 20 kV, an electron beam of 11 mm width, with a spot size value of 36, SEI signal, and high vacuum mode.
Powder X-ray Diffraction (PXRD)
Powder diffractograms were collected in transmission mode using a Rigaku XtaLAB SuperNova X-ray diffractometer with a micro-focus Cu Kα radiation (λ = 1.5417 Å, 50 kV, 1 mA) source and equipped with a HyPix3000 X-ray detector. Dry crystals of the pMCs were grinded to a fine powder before being transferred into a MiTGen loop with paratone oil for PXRD analysis. Powder diffractograms were collected over an angular 2θ range between 5 and 50° with a step of 0.01° using a Gandolfi move experiment for powders. An Oxford Cryosystems Cryostream 800 cooler was used to collect the powder data at 300 K. PXRD data was analyzed using the CrystAllisPRO software v. 1.171.3920a.
Single-Crystal X-ray Diffraction (SCXRD)
A Nikon Eclipse Microscope LV100NPOL, equipped with a Nikon DS-Fi2 camera, was used to observe crystals and assess their quality. Optical micrographs (Supporting Information) were recorded and processed within the NIS Elements BR software version 4.30.01. Single crystals were removed from storage vials and placed on a microscope slide inside a drop of paratone oil. Later, MiTeGen micro loops were used to mount the best single crystals for structure elucidation. A Rigaku XtaLAB SuperNova single micro-focus Cu Kα radiation (λ = 1.5417 Å, 50 kV, 1 mA) source equipped with a HyPix3000 X-ray detector in transmission mode was used to collect the SCXRD data. An Oxford Cryosystems Cryostream 800 cooler controlled the temperature at 100 K. Data was collected and initially refined within the CrystAllisPRO software v. 1.171.39.43c. All crystal structures were solved by direct methods. The final refinement of each structure was performed using full-matrix least squares on F2 within the Olex2 (v1.2-ac3) software. Nonhydrogen atoms were anisotropically refined.
Thermogravimetric Analysis (TGA)
TGA of CS and pMCs were recorded using a Q500 from TA Instruments Inc. About 2 mg of material was thermally treated from 10 to 700 °C at 5 °C/min under a N2 gas purge. TA Universal Analysis software version 4.3A was used to analyze the TGA data.
Dissolution Profiles
Dissolution profiles were recorded for CS, Cromolyn-Zn, Cromolyn-Mg, and Cromolyn-Ca and quantified by measuring absorbance at 237 nm against a reagent blank containing the buffered media. Dissolution tests were performed in a PBS buffer (pH = 7.40) and FaSSGF (pH = 1.60) at 37 °C under constant stirring (150 rpm). Absorbance measurements were performed on an Agilent Technologies Cary Series UV–vis spectrophotometer, Cary 100 UV–vis model, using the UV Cary Scan software version v.20.0.470.
Results and Discussion
The syntheses of cromolyn (Figure 1) with three bioactive metal ions were performed considering the following parameters: M2+/cromolyn molar ratio (1:1, 1:2, 1:3, 2:1, 2:3, 3:1), temperature (25, 45, 65, 70, 80, 85, and 120 °C), and pH (4.00–5.00) of the reaction. The conditions that lead to the production of the best single crystals for Cromolyn-Zn, Cromolyn-Mg, and Cromolyn-Ca are shown in Figure 2. The pH of the ligand solution was adjusted above the pKa of cromolyn (pKa = 1.90)23 to achieve a partially deprotonated species in solution, which is thought to speed the reaction.23 The pH of the final solution (Cromolyn + M2+) should also be below the pH leading to the formation of a metal oxide. The initial pH of the ligand solution before the addition of the metal salts was ∼6.00. A dilute solution of HCl (0.01–0.05 M) was employed to adjust the pH to 4.00. At this pH, an increased in the rate of crystallization was observed. This pH also seems to facilitate the formation of single-crystal quality crystals of Cromolyn-based pMCs. Optical micrographs for the single crystals obtained for Cromolyn-Zn, Cromolyn-Ca, and Cromolyn-Mg are available in the Supporting Information. Other conditions lead to significantly smaller crystals and/or microcrystalline powders.
Raman Spectroscopy Results
Raman spectroscopy was used to analyze the crystals obtained from the reaction between cromolyn with Zn2+, Mg2+, and Ca2+. The Raman spectra were collected in the range of 2000–200 cm–1 and are shown in Figure 3. The region between 1700 and 1200 cm–1 is associated with vibrational modes of the carboxylate moiety. The carboxylate groups have been shown to change orientation in this region due to the coordination or entrapment of water molecules in the different structures.28 An expansion in the unit cell is usually followed by changes in the crystalline structure, and these were confirmed through the observation of peak shifts in the different Raman spectra.
Figure 3.
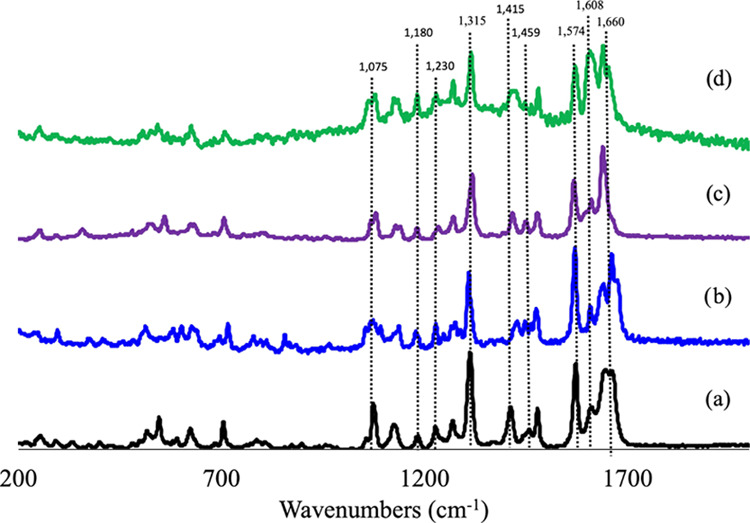
Raman spectra overlay of (a) CS and Cromolyn-based pMCs: (b) Cromolyn-Zn, (c) Cromolyn-Mg, and (d) Cromolyn-Ca.
The vibrational mode associated with the asymmetric stretching of ketones is found near 1660 cm–1, with a strong C=O frequency absorption.29 Additional functional groups covalently attached to ketone, such as the ether moiety and carboxylate display meaningful peaks in the Raman spectra. The asymmetric stretching vibrational modes of carboxylic acid moiety occur near 1574 cm–1, and this is found in the Raman spectra of CS and all of the metal complexes that were analyzed.30 The CH2 next to the carbonyl presents a strong band as a result of CH2 deformation at 1415 cm–1; such a peak is observed on the Raman spectra obtained for CS. Changes observed in the Raman spectra of the metal complexes included a shift in this peak occurring at around 1430 cm–1 in Cromolyn-Zn, Cromolyn-Mg, and Cromolyn-Ca. Additionally, an asymmetric stretching (C–C–C) vibration in the CH2–CO–CH2 functional group present in this compound produces a medium intensity band between 1230 and 1315 cm–1. Sharp bands close to 1608, 1459, and 1479 cm–1 are representative of ν(C=C) aromatic ring chain asymmetric stretching vibrations, which are bonded to the ether moiety in CS.31 The vibrational mode of the ether moiety can be associated with the region between 1180 and 1075 cm–1.32 This can be observed as weak intensity peaks in the Raman spectra of all of the metal complexes and CS. The bands located at lower wavenumbers (<1000 cm–1) match the vibrational mode characteristics of CH2, C–C, and C–OH, which are functional groups present in the Raman spectra of CS.33
SEM-EDS Results
The representative SEM micrographs collected for the isolated crystalline phases display crystals with well-defined morphologies and a resulting diameter ranging between 10 and 50 μm (Figure 4). The EDS spectra for these materials exhibit the characteristic signals representative of the corresponding metal and other elements, which are present in the molecular structure of CS including both carbon and oxygen atoms (Supporting Information).
Figure 4.
Scanning electron micrographs for cromolyn in coordination with the respective bioactive metals forming Cromolyn-based pMCs: Cromolyn-Zn (left), Cromolyn-Mg (middle), and Cromolyn-Ca (right).
PXRD Analysis
An overlay of the experimental PXRDs for the products formed from the synthesis between cromolyn and these three bioactive metal ions is shown in Figure 5. These results confirmed that the reaction precipitate was not produced by the simple recrystallization of the metal salt or the ligand. The low amorphous background observed in the powder diffractograms for the isolated phases indicates a high degree of crystallinity in these materials. The appearance of different reflections when compared to one another and CS suggests that distinct phases were produced under these reaction conditions. The absence of low-angle peaks (<5 ° in 2θ) in the diffractogram indicates that these materials are most likely dense structures having two-dimensional (2D) layers, as opposed to 3D porous networks. This result contradicts our initial prediction that the molecular structure of CS might permit flexible 3D structures to form.
Figure 5.
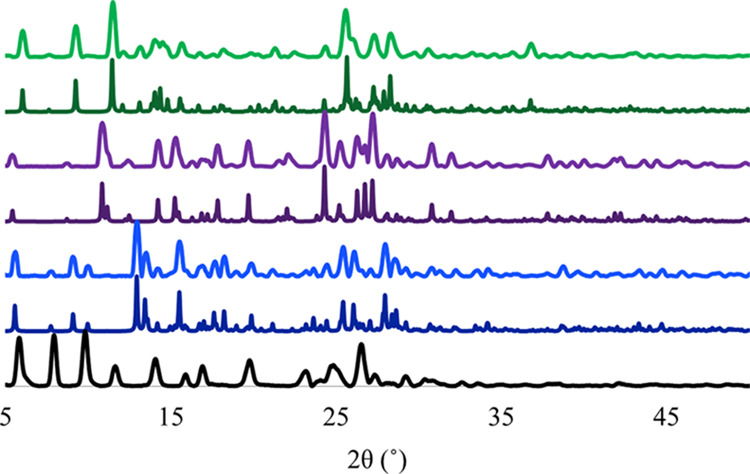
Simulated (darker color) and experimental (lighter color) powder X-ray diffractograms of CS (black), Cromolyn-Zn (blue), Cromolyn-Mg (purple), and Cromolyn-Ca (green) carried out at 100 K.
SCXRD Analysis
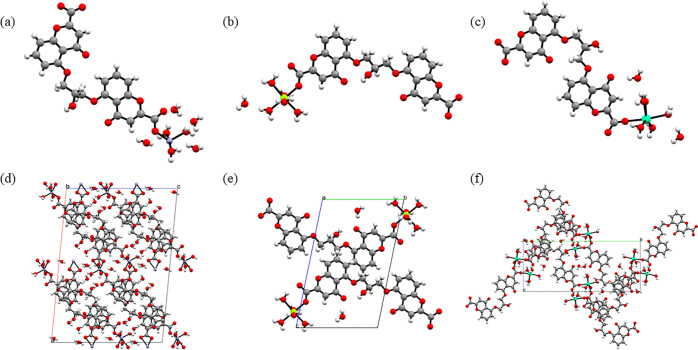
The syntheses of cromolyn with each of the bioactive metals (Zn2+, Mg2+, and Ca2+) resulted in crystals with good quality for structural elucidation by SCXRD. Structure elucidation confirmed the formation of three new, unreported, crystalline materials, namely, Cromolyn-Zn, Cromolyn-Mg, and Cromolyn-Ca. The crystal structures were collected at low temperature (100 K) and solved using direct methods. A summary of the crystallographic parameters is provided in Table 1. The asymmetric units and packing motifs of the metal complexes are displayed in Figure 6. Additional crystallographic information and individual PXRD overlays between experimental and simulated PXRD for each of the solved structures are available in the Supporting Information. Figure 5 depicts the overlays between experimental and simulated PXRDs for the herein reported Cromolyn-based pMCs. These results indicate a proper solution has been produced for each of the bulk phases represented in these pMCs.
Table 1. Crystallographic Parameters for the Structure Refinements of the Cromolyn-Based Pharmaceutical-Based Metal Complexes: (a) Cromolyn-Zn, (b) Cromolyn-Mg, and (c) Cromolyn-Ca.
| pMC | Cromolyn-Zn | Cromolyn-Mg | Cromolyn-Ca |
|---|---|---|---|
| empirical formula | [Zn2(C46H40O28)]·7H2O | [Mg(C23H24O16)]·H2O | [Ca2(C46H48O32)]·4H2O |
| FW (g/mol) | 1297.63 | 598.75 | 1265.06 |
| space group | C2/c | P1̅ | P21/n |
| temp. (K) | 100.00 (10) | 100.01 (10) | 100.01 (10) |
| λ (Å) | 1.54184 | 1.54184 | 1.54184 |
| a (Å) | 31.90641(18) | 7.34210(1) | 7.0293(3) |
| b (Å) | 6.99799(5) | 10.37410(1) | 29.2917(7) |
| c (Å) | 22.92769(14) | 16.8517(2) | 12.7862(4) |
| α (o) | 90 | 100.8990(1) | 90 |
| β (o) | 95.6148(6) | 98.9160(1) | 99.495(3) |
| γ (o) | 90 | 93.5560(1) | 90 |
| V (Å3) | 5094.75(5) | 1239.64(3) | 2596.61(15) |
| Z | 4 | 2 | 2 |
| ρcalc (g/cm3) | 1.692 | 1.604 | 1.618 |
| Rwp | 0.0790 (4714) | 0.1246 (4543) | 0.1997 (4797) |
| Rp | 0.0304 (4429) | 0.0455 (4196) | 0.0792 (4282) |
Figure 6.
Asymmetric unit and packing motif along the b-axis for (a, d) Cromolyn-Zn and along the a-axis for (b, e) Cromolyn-Mg and (c, f) Cromolyn-Ca.
Structural Description of Cromolyn-Zn
The compound [Zn2(C46H40O28)]·7H2O crystallizes in the monoclinic space group C2/c with half a molecule in the asymmetric unit. The structure presents a distorted octahedral with three metal–oxygen bonds (Zn1–O12 = 2.084 Å, Zn1–O13 = 1.973 Å, and Zn1–O14 = 2.197 Å) formed by coordinated water molecules and other three metal–oxygen bonds (Zn1–O1 = 1.973 Å, Zn1–O10 = 2.041 Å, and Zn1–O11 = 1.973 Å) coordinated to the ligand. Intermolecular hydrogen bonds reinforce the conformation of the ligand (O7–O8 = 2.670 Å and O3–O5 = 2.653 Å), while an intricate network of intermolecular hydrogen bonds propagates the packing of this metal complex along the a–c plane. Over 10 unique hydrogen bonds (O12–O15 = 2.798 Å, O12–O16 = 2.698 Å, O13–O17 = 2.681 Å, O14–O18 = 2.936 Å, O17–O18 = 2.919 Å, O1–O15 = 3.017 Å, O10–O15 = 2.967 Å, O3–O17 = 2.780 Å, O5–O17 = 2.937 Å, and O11–O13 = 2.721 Å) are formed hinting at the importance contribution of the four lattice water molecules present in this crystal structure to the formation of this packing motifs.
Structural Description of Cromolyn-Mg
The compound [Mg(C23H24O16)]·H2O crystalized in the triclinic space group P1̅ and has one molecule in the asymmetric unit. In the structure, cromolyn acts as a monodentate ligand coordinated to one magnesium atom through a metal–oxygen bond (Mg1–O1 = 2.037 Å) in the equatorial position. Five water molecules (two axial and three equatorial) are coordinated to the metal center and complete a nearly perfect octahedron. The metal cluster demonstrates a highly conserved octahedral geometry with the O–Mg–O bond angles ranging from 87.45 to 95.26°. The conformation of the asymmetric unit is reinforced by strong intramolecular hydrogen bonds (O3–O5 = 2.684 Å, O7–O8 = 2.697 Å, and O2–O15 = 2.748 Å). The asymmetric unit expands tilted along the b-axis (O8–O12 = 2.804 Å, O3–O15 = 2.786 Å, O10–O17 = 2.876 Å, and O12–O17 = 2.716 Å) and the a-axis (O6–O16 = 2.840 Å and O8–O16 = 2.738 Å) through additional hydrogen bonds. Many of these hydrogen bonds are enabled by the presence of the only lattice water present in this crystal structure. This structure is slightly disorder at the C(11), C(12), O(6), and C(13) positions. The disorder is modeled as two orientations at 0.878(3)/0.122(3) relative site occupancy.
Structural Description of Cromolyn-Ca
The compound [Ca2(C46H48O32)]·4H2O crystallizes in the monoclinic space group P21/n and has half a molecule in the asymmetric unit. In the structure, cromolyn acts as a bridging ligand coordinated to calcium atoms through metal–oxygen bonds in both the axial position (Ca1–O1 = 2.327 Å) and equatorial position (Ca1–O2 = 2.460 Å) forming distorted pentagonal bipyramid geometry with five coordinated water molecules. The Ca–O bond distances for the water molecules range between 2.394 and 2.460 Å. The O–Ca–O bond angles range from 67.58 to 100.06°. Two lattice water molecules are present in the structure. The conformation is reinforced by both inter- and intramolecular bonds. Intramolecular bonds occur mainly with the lattice water molecules (O3–O5 = 2.670 Å, O1–O16 = 3.007 Å, and O7–O8 = 2.667 Å). This motif propagates along the a-axis (O15–O16 = 2.996 Å) through hydrogen bonds. Various hydrogen bonds also help expand this motif along the b–c plane (O15–O10 = 2.859 Å, O10–O16 = 2.666 Å, and O11–O14 = 2.844 Å).
TGA Results
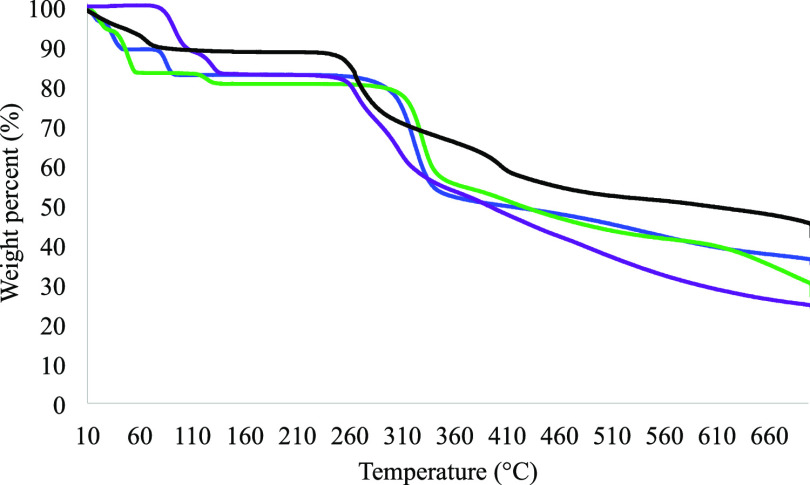
TGA was employed to measure the decomposition of these materials as a function of temperature (Figure 7). It was expected that the thermograph of each metal complex consists of at least three decomposition events. The first event occurs at a lower temperature and corresponds to the removal of coordinated and guest water molecules. The second and the final decomposition events observed correspond to the thermal degradation of the metal complex and metal/metal oxide, respectively. As observed in Figure 7, all three pMCs present unique thermographs. The discussion of the weight loss for each decomposition event is included in the Supporting Information. The differences in the thermal behavior of CS and the pMCs observed between 10 and 140 °C is most likely due to the loss of coordinated and lattice water molecules present in each Cromolyn-based pMCs. The second event occurs at a temperature range between 230 and 360 °C and corresponds to the decomposition of the metal complex. A greater percent weight loss in this temperature range is observed in the thermographs of the pMCs compared to that of CS. The degradation of the metal/metal oxide takes place at a higher temperature range (360–700 °C). These pMCs show a higher thermal stability when compared to CS; the pMCs present a higher weight loss (>330 °C) when coordinated.
Figure 7.
TGA thermographs of CS (black) and Cromolyn-based pMCs: Cromolyn-Zn (blue), Cromolyn-Mg (purple), and Cromolyn-Ca (green). All TGAs were collected using a temperature range between 10 and 700 °C at a heating rate of 5 °C/min under N2.
Dissolution Profile
The stability of these materials in biologically relevant media was used to understand the ability of the pMCs to sustain blood plasma concentration for CS. A higher blood concentration might allow for longer circulation times and adequate delivery to the target tissues and organs. This is currently a pharmacological disadvantage for oral formulations of CS (<1% bioavailability and low solubility ∼100.0 mg/mL at 20 °C).28 The dissolution of these materials was first studied in FaSSGF (pH = 1.60), where it was observed that CS and the pMCs did not degrade significantly (no detectable dissolution) at 37 °C. Therefore, no further dissolution studies were carried out in this media.
PBS (pH = 7.40) was then used as media to determine the dissolution profiles of these materials relative to CS. The absorbance was measured at the maximum wavelength (λmax = 237 nm) for CS as the degradation of the pMCs progressed in PBS over time (Figure 8). The calibration curve of CS in PBS used for quantification can be found in the Supporting Information. The dissolution profiles showed a slow release of CS from the pMCs, which reached its maximum concentration (∼98%) after 1 h. The rate at which CS was released varied among the pMCs. These results conclude that Cromolyn-Zn (∼75% in 5 h), Cromolyn-Mg (∼80% in 6 h), and Cromolyn-Ca (∼85% in 6 h) possess a high stability and degrade slowly over time. The concentration at which the metal complex reached equilibrium in PBS at 37 °C was calculated as 0.17 mg/mL for Cromolyn-Zn and Cromolyn-Ca and 0.10 mg/mL for Cromolyn-Mg. Results indicate that these materials could circulate for a longer time and potentially reach the target site under physiological conditions.
Figure 8.
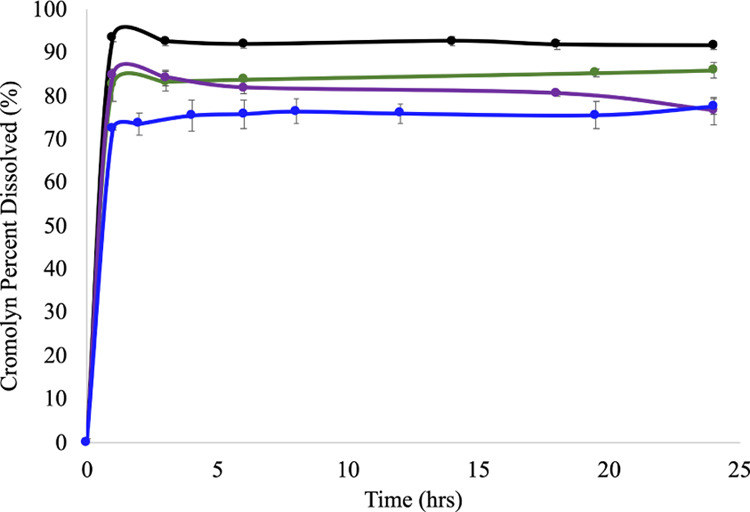
Complete dissolution profile for CS (black) and the Cromolyn-based pMCs: Cromolyn-Zn (blue), Cromolyn-Mg (purple), and Cromolyn-Ca (green).
Conclusions
The coordination of this therapeutic mast cell stabilizer with bioactive metals (Zn2+, Mg2+ and Ca2+) produced three distinct Cromolyn-based pMCs, namely, Cromolyn-Zn, Cromolyn-Mg, and Cromolyn-Ca. The conditions that led to the successful syntheses of these materials and their solid state were characterized using Raman spectroscopy, PXRD, SEM-EDS, TGA, and SCXRD. These results confirm the composition, thermal stability, and packing modes of these crystalline materials. None of these conditions resulted in 3D flexible structures. Thus, the work did not attempt to address the reduction of the particle size of these pMCs. Interestingly, no other metal complexes employing CS have been reported in the literature; therefore, they represent the first three of such materials.
Although only 2D structures were observed under the conditions studied, the unique binding modes and packing motifs present in these materials might affect the activity and delivery of CS. Dissolution studies provided a grasp on the structural stability in PBS. Dissolution occurred slowly suggesting a higher degree of structural stability (slow degradation) under neutral physiological conditions, while in acidic conditions, no significant degradation of the Cromolyn-based pMCs occurred. Further exploration of the conditions needed to form 3D flexible Cromolyn-based pMCs could lead to the development of novel multidrug delivery systems to better mitigate allergic and inflammatory diseases.
Acknowledgments
Special thanks to the Materials Characterization Center (MCC) for their technical support, particularly for their assistance in the SEM-EDS analysis. The authors are also thankful to Dr. Dalice M. Piñero Cruz and Dr. Jeff W. Kampf for fruitful discussions regarding the modeling of the disorder present in CS-Mg.
Glossary
Abbreviations
- CS
cromolyn sodium
- Zn2+
zinc ion
- Mg2+
magnesium ion
- Ca2+
calcium ion
- pMCs
pharmaceutical-based metal complexes
- TGA
thermogravimetric analysis
- PXRD
powder X-ray diffraction
- SCXRD
single-crystal X-ray diffraction
- SEM-EDS
scanning electron microscopy coupled with energy-dispersive spectroscopy
- FaSSGF
fasted-state simulated intestinal/gastric fluids
- PBS
phosphate-buffered saline
Supporting Information Available
The Supporting Information is available free of charge at https://pubs.acs.org/doi/10.1021/acsomega.0c03320.
Crystallographic parameters, ORTEPs, and CIF checks, 19vlmirr002 (CIF)
18vlmirr13c (CIF)
19vlmirr001 (CIF)
Detailed experimental procedures for the syntheses of each pMC; additional Raman spectra; PXRDs; SEM images; EDS spectra; TGA thermographs; calibration curves; absorption spectra; and dissolution profiles (PDF)
Author Contributions
I.R. and J.F.B. contributed equally. The manuscript was written through the contributions of all authors. All authors have given approval to the final version of the manuscript and Supporting Information.
The Rigaku XtaLAB SuperNova single-crystal X-ray micro-diffractometer was acquired through the support of the National Science Foundation (NSF) under the Major Research Instrumentation Program (CHE-1626103). The NSF-sponsored PR-LSAMP (HRD-1400868) provided funding for materials and personnel cost for J.S.V. The National Institutes of Health (NIH) Research Training Initiative for Student Enhancement (RISE) Program (5R25GM061151) provided funding for materials and personnel cost for I.R. Additional funds were provided by the 2017–2019 Institutional Research Funds (FIPI) from the University of Puerto Rico, Río Piedras campus.
The authors declare no competing financial interest.
Supplementary Material
References
- Kray K. T.; Squire E. N.; Tipton W. R.; Selner J. C.; O’Dea J.; Nelson H. S. Cromolyn Sodium in Seasonal Allergic Conjunctivitis. J. Allergy Clin. Immunol. 1985, 76, 623–627. 10.1016/0091-6749(85)90785-7. [DOI] [PubMed] [Google Scholar]
- Shapiro G. G.; Konig P. Drugs in Perspective. Pharmacotherapy 1985, 5, 56–170. [DOI] [PubMed] [Google Scholar]
- Kocoshis S.; Gryboski J. D. Use of Cromolyn in Combined Gastrointestinal Allergy. JAMA 1979, 242, 1169–1173. 10.1001/jama.1979.03300110041024. [DOI] [PubMed] [Google Scholar]
- Horan R. F.; Sheffer A. L.; Austen K. F. Cromolyn Sodium in the Management of Systemic Mastocytosis. J. Allergy Clin. Immunol. 1990, 85, 852–855. 10.1016/0091-6749(90)90067-E. [DOI] [PubMed] [Google Scholar]
- Cox J. S. G. Disodium Cromoglycate (FPL 670) (‘Intal’*): A Specific Inhibitor of Reaginic Antibody-Antigen Mechanisms. Nature 1967, 216, 1328–1230. 10.1038/2161328a0. [DOI] [PubMed] [Google Scholar]
- Murphy S.; Kelly H. W. Cromolyn Sodium: A Review of Mechanisms and Clinical Use in Asthma. Drug Intell. Clin. Pharm. 1987, 21, 22–35. 10.1177/10600280870211p102. [DOI] [PubMed] [Google Scholar]
- Murphy S. Cromolyn Sodium: Basic Mechanisms and Clinical Usage. Pediatr. Asthma, Allergy Immunol. 1988, 2, 237–254. 10.1089/pai.1988.2.237. [DOI] [Google Scholar]
- Sinniah A.; Yazid S.; Flower R. J. The Anti-Allergic Cromones: Past, Present, and Future. Front. Pharmacol. 2017, 8, 827 10.3389/fphar.2017.00827. [DOI] [PMC free article] [PubMed] [Google Scholar]
- Kaartinen M.; Penttilä A.; Kovanen P. T. Mast Cells of Two Types Differing in Neutral Protease Composition in the Human Aortic Intima. Arterioscler. Thromb. 1994, 14, 966–973. 10.1161/01.ATV.14.6.966. [DOI] [PubMed] [Google Scholar]
- Zhang C.; Griciuc A.; Hudry E.; Wan Y.; Quinti L.; Ward J.; Forte A. M.; Shen X.; Ran C. Z.; Elmaleh D. R.; Tanzi R. E. Cromolyn Reduces Levels of the Alzheimer’s Disease-Associated Amyloid β-Protein by Promoting Microglial Phagocytosis. Sci. Rep. 2018, 8, 1144 10.1038/s41598-018-19641-2. [DOI] [PMC free article] [PubMed] [Google Scholar]
- Granucci E. J.; Griciuc A.; Mueller K. A.; Mills A. N.; Le H.; Dios A. M.; McGinty D.; Pereira J.; Elmaleh D.; Berry J. D.; Paganoni S.; Cudkowicz M. E.; Tanzi R. E.; Sadri-Vakili G. Cromolyn Sodium Delays Disease Onset and Is Neuroprotective in the SOD1G93A Mouse Model of Amyotrophic Lateral Sclerosis. Sci. Rep. 2019, 9, 17728 10.1038/s41598-019-53982-w. [DOI] [PMC free article] [PubMed] [Google Scholar]
- Alani A. W. G.; Robinson J. R. Mechanistic Understanding of Oral Drug Absorption Enhancement of Cromolyn Sodium by an Amino Acid Derivative. Pharm. Res. 2008, 25, 48–54. 10.1007/s11095-007-9438-6. [DOI] [PubMed] [Google Scholar]
- Eigen H.; Rekf J. J.; Dahl R.; B C. W.; Fasano L.; Sahistram K. K.; Shapiro G. G.; Marques R. A.; Be V.; Bonsignore G.; Fewhino M. P.; Carnimeo N.; Granstrom S. A.; Herr F.; Kjaerutff J.; Sher N.; Sheffer A. L. Evaluation of the Addition of Cromolyn Sodium to Bronchodilator Maintenance Therapy in the Long-Term Mangment of Asthma. J. Allergy Clin. Immunol. 1987, 80, 612–621. 10.1016/0091-6749(87)90016-9. [DOI] [PubMed] [Google Scholar]
- Tavano L.; Nicoletta F. P.; Picci N.; Muzzalupo R. Cromolyn as Surface Active Drug (Surfadrug): Effect of the Self-Association on Diffusion and Percutaneous Permeation. Colloids Surf., B 2016, 139, 132–137. 10.1016/j.colsurfb.2015.12.010. [DOI] [PubMed] [Google Scholar]
- Nagarsenker M. S.; Londhe V. Y. Preparation and Evaluation of a Liposomal Formulation of Sodium Cromoglicate. Int. J. Pharm. 2003, 251, 49–56. 10.1016/S0378-5173(02)00583-5. [DOI] [PubMed] [Google Scholar]
- Mendiguchia B. S.; Aiello I.; Crispini A. Zn(II) and Cu(II) Complexes Containing Bioactive O,O-Chelated Ligands: Homoleptic and Heteroleptic Metal-Based Biomolecules. Dalton Trans. 2015, 44, 9321–9334. 10.1039/c5dt00817d. [DOI] [PubMed] [Google Scholar]
- Ndagi U.; Mhlongo N.; Soliman M. E. Metal Complexes in Cancer Therapy – An Update from Drug Design Perspective. Drug Des., Dev. Ther. 2017, 11, 599–616. 10.2147/DDDT.S119488. [DOI] [PMC free article] [PubMed] [Google Scholar]
- Klein G. L. The Role of Calcium in Inflammation-Associated Bone Resorption. Biomolecules 2018, 8, 69 10.3390/biom8030069. [DOI] [PMC free article] [PubMed] [Google Scholar]
- Gammoh N. Z.; Rink L. Zinc in Infection and Inflammation. Nutrients 2017, 9, 624 10.3390/nu9060624. [DOI] [PMC free article] [PubMed] [Google Scholar]
- Nielsen F. H. Magnesium, Inflammation, and Obesity in Chronic Disease. Nutr. Rev. 2010, 68, 333–340. 10.1111/j.1753-4887.2010.00293.x. [DOI] [PubMed] [Google Scholar]
- Rayssiguier Y.; Libako P.; Nowacki W.; Rock E. Magnesium Deficiency and Metabolic Syndrome: Stress and Inflammation May Reflect Calcium Activation. Magnesium Res. 2010, 23, 73–80. 10.1684/mrh.2010.0208. [DOI] [PubMed] [Google Scholar]
- Liu Y.; Hill R. H.; Århem P.; Von Euler G. NMDA and Glycine Regulate the Affinity of the Mg2+-Block Site in NR1-1a/NR2A NMDA Receptor Channels Expressed in Xenopus Oocytes. Life Sci. 2001, 68, 1817–1826. 10.1016/S0024-3205(01)00975-4. [DOI] [PubMed] [Google Scholar]
- Rakesh R.; Anoop K. R. Formulation and Optimization of Nano-Sized Ethosomes for Enhanced Transdermal Delivery of Cromolyn Sodium. J. Pharm. Bioallied Sci. 2012, 4, 333–340. 10.4103/0975-7406.103274. [DOI] [PMC free article] [PubMed] [Google Scholar]
- Chen L. R.; Young V. G. Jr.; Lechuga-Ballesteros D.; Grant D. J. W. Solid-State Behavior of Cromolyn Sodium Hydrates. J. Pharm. Sci. 1999, 88, 1191–1200. 10.1021/js9900710. [DOI] [PubMed] [Google Scholar]
- Ding X.; Stringfellow T. C.; Robinson J. R. Self-Association of Cromolyn Sodium in Aqueous Solution Characterized by Nuclear Magnetic Resonance Spectroscopy. J. Pharm. Sci. 2004, 93, 1351–1358. 10.1002/jps.20034. [DOI] [PubMed] [Google Scholar]
- Attwood D.; Agarwal S. P. Self-Association of Disodium Cromoglycate in Dilute Aqueous Solution. Int. J. Pharm. 1984, 22, 25–30. 10.1016/0378-5173(84)90042-5. [DOI] [Google Scholar]
- Gift A. D.; Taylor L. S. Hyphenation of Raman Spectroscopy with Gravimetric Analysis to Interrogate Water-Solid Interactions in Pharmaceutical Systems. J. Pharm. Biomed. Anal. 2007, 43, 14–23. 10.1016/j.jpba.2006.06.025. [DOI] [PubMed] [Google Scholar]
- Ding X.; Rath P.; Angelo R.; Stringfellow T.; Flanders E.; Dinh S.; Gomez-Orellana I.; Robinson J. R. Oral Absorption Enhancement of Cromolyn Sodium through Noncovalent Complexation. Pharm. Res. 2004, 21, 2196–2206. 10.1007/s11095-004-7671-9. [DOI] [PubMed] [Google Scholar]
- Gilbert A. S. IR Spectral Group Frequencies of Organic Compounds. Encycl. Spectrosc. Spectrom. 2016, 408–418. 10.1016/B978-0-12-803224-4.00337-X. [DOI] [Google Scholar]
- Reverchon E.; Adami R.; Caputo G. Production of Cromolyn Sodium Microparticles for Aerosol Delivery by Supercritical Assisted Atomization. AAPS PharmSciTech 2007, 8, 272–280. 10.1208/pt0804114. [DOI] [PMC free article] [PubMed] [Google Scholar]
- Takeuchi H. UV Raman Markers for Structural Analysis of Aromatic Side Chains in Proteins. Anal. Sci. 2011, 27, 1077–1086. 10.2116/analsci.27.1077. [DOI] [PubMed] [Google Scholar]
- Magnotti G.; KC U.; Varghese P. L.; Barlow R. S. Raman Spectra of Methane, Ethylene, Ethane, Dimethyl Ether, Formaldehyde and Propane for Combustion Applications. J. Quant. Spectrosc. Radiat. Transfer 2015, 163, 80–101. 10.1016/J.JQSRT.2015.04.018. [DOI] [Google Scholar]
- Cukrowski I.; Popović L.; Barnard W.; Paul S. O.; van Rooyen P. H.; Liles D. C. Modeling and Spectroscopic Studies of Bisphosphonate–Bone Interactions. The Raman, NMR and Crystallographic Investigations of Ca–HEDP Complexes. Bone 2007, 41, 668–678. 10.1016/J.BONE.2007.05.008. [DOI] [PubMed] [Google Scholar]
Associated Data
This section collects any data citations, data availability statements, or supplementary materials included in this article.


