Abstract
Purpose
To quantitatively compare dynamic 19F and single breath hyperpolarized 129Xe MRI for the detection of ventilation abnormalities in subjects with mild cystic fibrosis (CF) lung disease.
Methods
Ten participants with stable CF and a baseline FEV1 > 70% completed a single imaging session where dynamic 19F and single breath 129Xe lung ventilation images were acquired on a 3T MRI scanner. Ventilation defect percentages (VDP) values between 19F early‐breath, 19F maximum‐ventilation, 129Xe low‐resolution, and 129Xe high‐resolution images were compared. Dynamic 19F images were used to determine gas wash‐in/out rates in regions of ventilation congruency and mismatch between 129Xe and 19F.
Results
VDP values from high‐resolution 129Xe images were greater than from low‐resolution images (P = .001), although these values were significantly correlated (r = 0.68, P = .03). Early‐breath 19F VDP and max‐vent 19F VDP also showed significant correlation (r = 0.75, P = .012), with early‐breath 19F VDP values being significantly greater (P < .001). No correlation in VDP values were detected between either 19F method or high‐res 129Xe images. In addition, the location and volume of ventilation defects were often different when comparing 129Xe and 19F images from the same subject. Areas of ventilation congruence displayed the expected ventilation kinetics, while areas of ventilation mismatch displayed abnormally slow gas wash‐in and wash‐out.
Conclusion
In CF subjects, ventilation abnormalities are identified by both 19F and HP 129Xe imaging. However, these ventilation abnormalities are not entirely congruent. 19F and HP 129Xe imaging provide complementary information that enable differentiation of normally ventilated, slowly ventilated, and non‐ventilated regions in the lungs.
Keywords: cystic fibrosis, hyperpolarized gas, perflorinated gas imaging, VDP, ventilation defect
1. INTRODUCTION
Cystic fibrosis (CF) is the most common fatal monogenic disorder in Caucasians. The pathophysiology of CF includes the production of abnormally viscous mucus that obstructs airways and results in persistent infections and inflammation. 1 High‐resolution computed tomography (HRCT) is currently the gold standard for assessing structural lung disease in CF; however, the risks associated with repeated radiation exposure limit the use of longitudinal HRCT, particularly in the pediatric population. 2 MRI is an emerging modality for analyzing lung structure and function as it is non‐invasive with no ionizing radiation exposure and therefore, well‐suited for longitudinal studies. Historically, structural lung MRI was limited due to short proton‐signal transverse coherence time and low tissue density, but advances in ultrashort echo time (UTE) and zero echo time (ZTE) pulse sequences have allowed for improved structural imaging of lung parenchyma, blood vessels, and mucus plugging. 3 In addition to structural information, MRI has the potential to offer functional information in the form of ventilation imaging. 4
Hyperpolarized (HP) gas imaging of the lungs has been performed for the better part of the past two decades with hyperpolarized helium‐3 (3He). More recently, hyperpolarized xenon‐129 (129Xe) has emerged as a more cost‐effective and accessible alternative. 4 MRI images obtained with hyperpolarized 129Xe gas provide regional information about ventilation that standard pulmonary function tests alone cannot provide, 5 including a range of functional biomarkers, such as the ventilation defect percentage (VDP), 6 apparent diffusion coefficient (ADC), 7 and fractional ventilation. 8 VDP from 129Xe MR imaging correlates with lung clearance index (LCI) in pediatric subjects with CF, 6 and can possibly provide more specific and accurate information on CF treatment response in interventional trials. 9 In addition, due to the sizable tissue solubility and large chemical shift range (~200 ppm) of 129Xe, dissolved‐phase HP 129Xe imaging is also feasible, 10 , 11 , 12 and could potentially provide valuable insights into the pulmonary gas‐exchange processes in both healthy and CF lungs. Limiting factors for HP 129Xe use are the need for technical expertise and special equipment to hyperpolarize the gas, as well as the known anesthetic effect of xenon. 13 However, recent studies have clearly shown that xenon inhalation for lung ventilation imaging is safe and well tolerated in adults as well as in children as young as 6 years old. 14 , 15
Fluorine‐19 (19F) imaging has been proposed as an alternative to HP gas for ventilation‐space imaging that does not require on‐site gas polarization. Feasibility studies have produced promising ventilation images using perfluoropropane (C3F8 or PFP) combined with 21% oxygen (O2). 16 PFP has a high gyromagnetic ratio (~3.4 times 129Xe), high natural abundance (100%), higher spin‐density than 129Xe, and very short T1 (12.4 ms compared with ~20 s for 129Xe). 16 , 17 The short T1 allows for the use of very short repetition times (TRs) and signal averaging that increases the 19F image signal‐to‐noise ratio (SNR) without the need for pre‐polarization. Without the need for a complex hyperpolarization protocol, 19F gas imaging could potentially provide an alternative means of characterizing regional lung ventilation. 18 Additionally, the absence of signal decay in the lung allows for multiple breath studies without the need of constant fresh supply of hyperpolarized gas, and the combination of low T1 and high spin density of 19F enables the quantification of gas wash‐in and wash‐out kinetics, thus, providing the ability to detect and localize ventilation abnormalities. 19 Ventilation defects have been observed in diseased populations using 19F imaging 20 and promising comparisons between 19F and 129Xe ventilation images have been recently performed in healthy volunteers. 21 As single breath‐hold 19F imaging suffers from reduced SNR, preventing a true single breath‐hold comparison between the two gases, here we compare dynamic 19F to single breath HP 129Xe MRI for the detection of lung ventilation defects in subjects with mild CF to better understand the similarities and differences between these two imaging approaches.
Due to the difference in resolutions between 129Xe and 19F images, we also compared low and high‐resolution 129Xe images to isolate the potential effects of image resolution on the measurement of ventilation defects.
2. METHODS
2.1. Study participants and study design
This study was approved by the research ethics board at UNC‐Chapel Hill (IRB 17‐2569) and all participants provided written informed consent. Ten participants with stable CF lung disease, ≥ 18 y of age, non‐smokers (<10 pack‐year history and no active smoking in the past year), and a baseline FEV1 > 70% predicted were enrolled from May 2018 to March 2019. Subject demographics are reported in Table 1. Subjects ranged in age from 21 to 44 years, and had a mean FEV1 of 81.7 ± 15.0% predicted. Each subject completed a single imaging session during which both 19F and 129Xe ventilation images were acquired in a random order. Prior to the imaging session, all subjects completed spirometry according to American Thoracic Society standards. 22
TABLE 1.
Study population demographics
| Gender | Age | FEV1 (%) | Genotype |
|---|---|---|---|
| F | 20 | 73 | F508del/F508del |
| F | 27 | 72 | W1282X/S341P |
| F | 23 | 82 | F508del/F508del |
| M | 26 | 86 | F508del/G551D |
| F | 24 | 92 | F508del/F508del |
| M | 24 | 71 | F508del/621 + 1G‐‐>T |
| F | 44 | 64* | R75X/R1066H |
| M | 24 | 85 | F508del/F508del |
| M | 35 | 75 | F508del/F508del |
| F | 30 | 117 | F508del/F508del |
Visit FEV1 below baseline due to subject not performing their normal airway clearance procedure on the day of the study visit.
2.2. Imaging session
Imaging was performed on a Siemens PRISMA 3T MR scanner (Siemens AG) with multinuclear capabilities. Subjects were randomized to the order of 19F and 129Xe imaging; after the first scan, subjects exited the scanner and were allowed a 15‐minute break, during which a single spirometric maneuver was completed to ensure no change in lung function as a result of either gas inhalation.
3D 1H scans were completed before each 129Xe and 19F scan to facilitate co‐registration of 129Xe images with 19F images. 1H images acquired before 129Xe scan were acquired during a breath hold of 1 L of medical air to improve matching of the lung volume at which 1H and 129Xe images were obtained and thus, image registration. All 1H images were acquired by using a 3D stack of spiral VIBE sequence with 5° excitation flip angle, a TR of 2.42 ms, echo time (TE) of 0.05 ms, 224 by 224 acquisition matrix, and a resolution of 2.1 mm × 2.1 mm × 2.5 mm.
For 19F acquisitions, a PFP‐filled dual‐cylinder lung phantom was scanned prior to each participant for quality assurance and to establish the 19F center frequency. Subjects were positioned supine in the scanner with a 19F‐tuned 8‐channel chest coil (ScanMed LLC, NE) around the chest. Subjects inhaled a pre‐mixed, medical grade gas mixture of 79% PFP:21% oxygen (IND 122,215) using a continuous‐breathing custom gas delivery device. 20 PFP was administered with a full‐face non‐invasive ventilation mask and a non‐rebreathing Douglas Bag system. Subjects inhaled and exhaled one tidal volume breath of the contrast gas followed by a maximal inhalation with a 12 second breath‐hold, during which time images were obtained prior to exhalation. A total of five such imaging cycles during PFP inhalation (wash‐in) were performed, followed by up to eight cycles of room air inhalation (wash‐out) until no visible signal was present (for a total for 10 wash‐in breaths and up to 16 wash‐out breaths). Ventilation was coached with a pneumotachometer as a visual aid for the MRI technician, and safety was monitored via blood oxygenation saturation, exhaled CO2 concentration, and heart rate. 19F dynamic images were acquired using a coronal 2D gradient echo (GRE) sequence with a 74° flip angle, an TE of 1.61 ms, a TR of 13 ms, 15 mm slice thickness, and a 64 by 64 acquisition matrix with a 130 Hz/pixel bandwidth and an in‐plane resolution of 6.25 mm × 6.25 mm.
129Xe imaging was performed using a flexible 129Xe‐tuned quadrature chest coil (Clinical MR Solutions, WI). For each subject, two images were acquired, each during a single 12 second breath‐hold of 750 ml isotopically enriched 129Xe, polarized up to ~14% with a Polarean 9800 129Xe Polarizer (Polarean, Inc, Durham, NC), mixed with 250 ml of N2. During the first inhalation, the 129Xe center frequency was determined right before the acquisition of a low‐resolution 2D multislice image data set. A high‐resolution 2D multislice image data set was acquired during the second inhalation, approximately 30 minutes after the first inhalation using a second dose of hyperpolarized gas. Throughout the imaging session the subject's heart rate, blood pressure and oxygen saturation level were monitored every 5 min. After each xenon inhalation, subjects were also queried about symptoms associated with neurologic changes (ie, euphoria, numbness, tingling, etc). 129Xe images were acquired using 2D GRE multislice sequences with a 10° excitation flip angle, a TR of 9 ms, an TE of 4 ms, a field of view of 280 × 350 (read × phase), and a matrix size of either 128 × 64 with a slice thickness of 21.0 mm, which resulted in an in‐plane resolution of 2.2 mm × 6.4 mm (low resolution) with a total scan time of 7 s, or a matrix size of 128 × 80 with a slice thickness of 10.5 mm, which resulted in an in‐plane resolution of 2.2 mm × 4.4 mm (high resolution) and a total scan time of 14 s.
2.3. Image analysis
Registration and masking of images were performed using MIM Software (Cleveland, OH). The 1H lung masks corresponding to the 129Xe acquisitions were generated via a semi‐automated segmentation of the 1H lung‐cavity images, using a simple region‐growing algorithm. The 1H lung masks corresponding to the 19F acquisitions were generated through visual inspection using the threshold and manual region of interest (ROI) segmentation tools due to difference in lung inflation between the 1H and 19F in some subjects. The 1H lung cavity images were used as lung masks to eliminate noise regions outside the lung ROI. Two sets of 19F ventilation type images were created for each subject; an early‐breath image and a maximum ventilation (max‐vent) breath image. For the early‐breath image, the first image to show 19F signal was used 21 ; for the max‐vent image, the last wash‐in image was used. 129Xe low‐resolution (low‐res) and high‐resolution (high‐res) were obtained as noted above. 129Xe and 19F images were then registered through a rigid registration transform on their respective 1H images. The registered images and masks were then exported to MATLAB (version 2017b; MathWorks, Natick, MA) for further processing using in‐house scripts.
The algorithmic VDP segmentations commonly used in 129Xe studies, such as k‐means clustering, are SNR dependent, and therefore, it is difficult to use these segmentations to make comparisons across modalities with different SNRs. 23 In this study, the SNR was calculated as the ratio of the 90th percentile of the lung interior distribution to the noise signal SD (taken from an ROI outside the thorax). As expected, 19F images had markedly lower SNR than 129Xe images, and this difference between SNR values drove the decision to use a threshold‐based VDP analysis for all image types. 17 , 18 The intensity threshold was subsequently defined as the 95th percentile of the background noise distribution, 18 measured from an ROI drawn outside of the thorax. VDP was then defined as the percentage of the total lung volume that failed to exceed this intensity threshold. 18
Analysis next focused on regions where localization of ventilation defects by 129Xe and 19F yielded disparate results. For this analysis, max‐vent 19F image was fused with the 129Xe image using MIM software using a rigid body translation with no size dilations. The use of a rigid transformation versus a non‐affine transformation was dictated by the absence of a theoretical model of lung inflation that is needed to accurately perform a non‐affine transformation on the images. It is also important to note that, in the case of CF, the elastic properties of the lung tissue may be significantly altered by the presence of chronic inflammation. Such theoretical models are, therefore, expected to be subject specific, thus, introducing new confounding variables in the analysis.
After the rigid transformation, ROIs were manually drawn to identify regions where ventilation defects identified by the two techniques were mismatched. These regions included locations where 129Xe was present but 19F was low/missing (129Xe + 19F‐) and locations where 129Xe was low/missing but 19F was present (129Xe‐ 19F+). A set of ROIs for each subject were also examined in regions where both 129Xe and 19F were present (129Xe + 19F+) for comparison.
Since the 19F dynamic imaging allows calculation of regional wash‐in and wash‐out kinetics, we compared PFP gas wash‐in and wash‐out rate constants in both matched areas (filled with both 19F and 129Xe) and unmatched areas (19F only or 129Xe only). The mean 19F signal in each ROI at each image acquisition time point was evaluated to generate a signal versus time plot for each ROI. The average of ROI voxels from a pre‐PFP exposure scan was used to estimate the baseline noise level. The mean 19F signal values were then curve‐fitted as a non‐linear bi‐exponential function 24 using the non‐linear least squares method. The time constants that describe gas wash‐in (τ1(s)) and wash‐out (τ2(s)) kinetics, and the maximum 19F signal (peak), were derived from this fit.
2.4. Statistical analysis
Statistical analyses were performed using Matlab and SAS v9.4. Linear regressions and Pearson correlations were performed between VDP values measured by low and high‐resolution 129Xe and 19F imaging. VDP mean differences are reported as [absolute] % difference and displayed in Bland‐Altman plots. The goodness of fit between mean raw 19F values in ROIs and fitted curves were assessed with R‐square values. Repeated measures analysis of variance (ANOVA) was used to compare SNR, mean τ1 and τ2 values in the 129Xe + 19F+, 129Xe + 19F‐ and 129Xe‐ 19F + ROIs, and the peak 19F signal in each ROI. Comparisons between all groups were corrected with the Tukey‐Kramer adjustment. Results are reported as mean ± SD and displayed in Table 2. P‐values < 0.05 were considered significant.
TABLE 2.
Results of repeated measures ANOVA on time constants τ1, τ2, and peak signal. Comparison of 129Xe + 19F+ (ROI B) and 129Xe‐19F+ (ROI C) showed significant difference for τ2 (P = .0075)
| ROI type (mean ± SD) | Corrected P values (Tukey Kramer) P‐values | |||||
|---|---|---|---|---|---|---|
| Xe + F19‐ (ROI A) | Xe + F19+ (ROI B) | Xe‐ F19+ (ROI C) | Comparison A‐B | Comparison B‐C | Comparison A‐C | |
| Tau1 (s) | 70.46 ± 38.70 | 36.83 ± 11.56 | 85.36 ± 56.83 | 0.3397 | 0.0589 | 0.7601 |
| Tau2 (s) | 31.16 ± 33.35 | 18.13 ± 5.52 | 34.31 ± 11.63 | 0.4947 | 0.0075 | 0.9294 |
| Peak Signal Intensity | 9.87 ± 14.55 | 53.59 ± 17.15 | 37.01 ± 8.36 | <0.0001 | 0.0192 | 0.0002 |
All comparisons of peak values were statistically significant, indicating that the 19F signal at the end of the dynamic imaging cycle was able to discriminate between the three different types of ROIs.
3. RESULTS
3.1. Signal to noise
Signal to noise values across the entire lung volume were determined in the early‐breath 19F, max‐vent 19F, low‐resolution 129Xe, and high‐resolution 129Xe images as shown in Figure 1 (early‐breath 19F: 18.36 ± 3.16; max‐vent 19F: 25.02 ± 4.02; low‐res 129Xe: 73.59 ± 53.82, high‐res 129Xe: 30.17 ± 20.82). Significant SNR differences were present between early‐breath 19F images vs. low‐res 129Xe images (P = .041) and between early‐breath 19F vs. max‐vent 19F (P < .001). A nearly significant difference between low‐res 129Xe vs. High‐res 129Xe was observed (P = .052).
FIGURE 1.
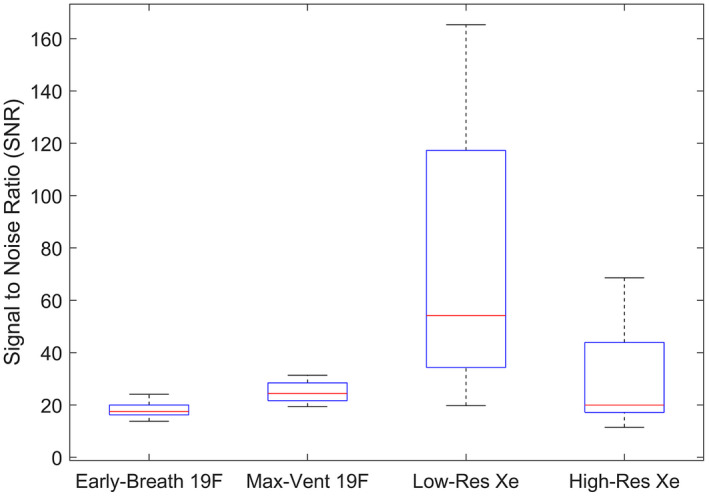
Boxplot showing distribution of ventilation images SNRs across all ten subjects, with the median (red line), 25th and 75th percentiles (blue box edges), and range (whiskers) displayed. Statistically significant differences were seen in early‐breath 19F vs. low‐res 129Xe (P = .041) and early‐breath 19F vs. max‐vent 19F (P < .001)
3.2. Comparison of ventilation defect values across methods
Figure 2 provides examples of the variability of gas filling between methods. In Subject 1, the ventilation defect location and volume from the early‐breath 19F was similar to that of the high‐resolution 129Xe. In contrast, the max‐vent 19F showed eventual filling of a majority of these ventilation defects. In Subject 2, while neither 129Xe images nor the max‐vent 19F images demonstrated significant ventilation defects, the early‐breath 19F images showed substantial defects that likely reflect inadequate SNR at this early time point. In Subject 3, the early‐breath 19F image again shows large areas of ventilation defect in the right lung, thought to reflect inadequate gas uptake or signal at this early point of the PFP wash‐in cycle. The high‐resolution 129Xe image detected more ventilation defects than the low‐resolution 129Xe image, especially in the left upper lobe, for example, where volume averaging may be increasing the local mean value above the threshold. Comparison of the max‐vent 19F and xenon images shows both matched 129Xe‐ 19F‐ and mismatched 129Xe‐ 19F + ventilation defects, suggesting that some lung regions never filled with PFP, whereas others demonstrated delayed filling.
FIGURE 2.
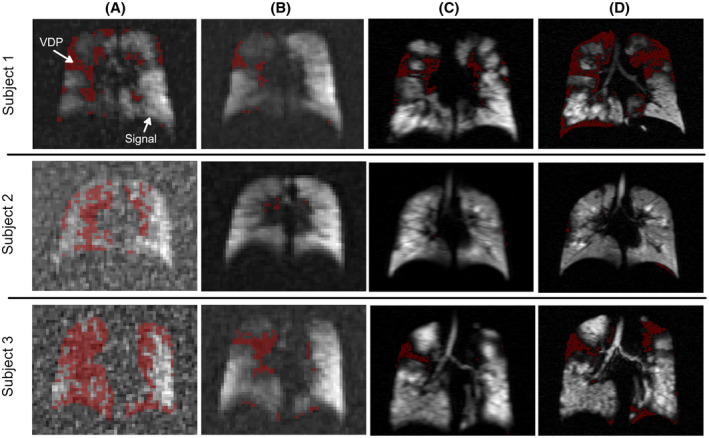
Representative images showing early‐breath 19F (A), max‐vent 19F (B), low‐resolution 129Xe (C), and high‐resolution 129Xe (D) images in three subjects. A threshold was applied to define regions of ventilation defects (red masks). VDPs were calculated as the percentage of lung with a ventilation defect compared with total lung volume calculated by the anatomic mask. VDPs in early‐breath 19F images were higher than in max‐vent images, likely due to lack of sufficient signal. High‐resolution 129Xe images typically displayed higher VDPs than low‐res images
Figure 3 shows correlations and Bland‐Altman plots of VDPs calculated from each image type, referenced against the standard high‐res 129Xe VDP method. No correlation between early‐breath 19F VDP (r = 0.28, P = .43; Figure 3A) or max‐vent 19F VDP (r = 0.23, P = .52; Figure 3B) and high‐res 129Xe VDP values were observed. The Bland‐Altman plot shows a significant mean difference in VDP between max‐vent 19F and high‐res 129Xe (−10.6%, P = .007; Figure 3E). There was no significant difference in mean VDP values between early‐breath 19F and high‐res 129Xe (−0.5%, P = .87; Figure 3D). In contrast, low‐res vs. high‐res 129Xe VDP display a significant correlation (r = 0.68, P = .03; Figure 3C), although a significant mean difference in VDP (−10.5%, P = .001; Figure 3F) indicated consistent underestimation of VDP values by low‐res 129Xe images.
FIGURE 3.
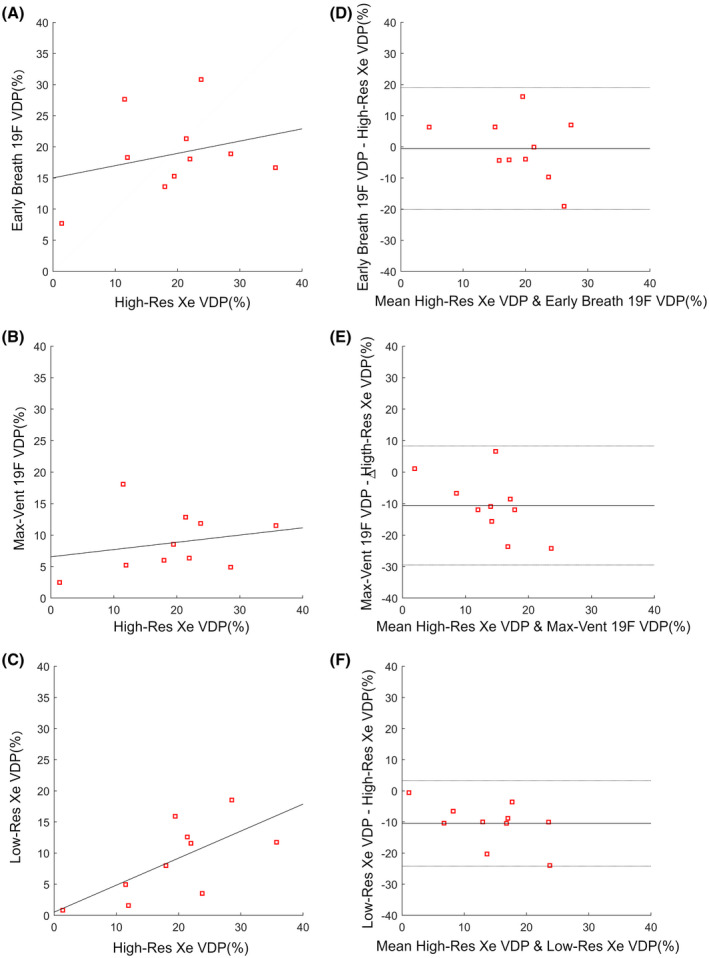
Scatter (A, B, C) and Bland‐Altman (D, E, F) plots comparing VDP measurements. Regression line (dark gray) shown on scatter plots. Mean bias ± 95% lines of agreement shown on Bland‐Altman plots. High‐resolution 129Xe is compared with: early‐breath 19F images (r = 0.28, P = .43. Estimated bias = −0.5 ± 19.6%, P = .87) (A,D); (B, E). max‐vent 19F images (r = 0.23, P = .52. Estimated bias = −10.6 ± 18.9%, P = .007) (B,E); low‐resolution 129Xe (r = 0.68, P = .03 (C,F). Estimated bias = −10.5% ± 13.8%, P = .001)
Figure 4 shows the comparison between max‐vent 19F VDP and early‐breath 19F VDP. There was significant correlation (r = 0.75, P = .012) and a significant mean difference (10.0%, P = 4.9e‐5) indicating overestimation of VDP by early breath 19F.
FIGURE 4.
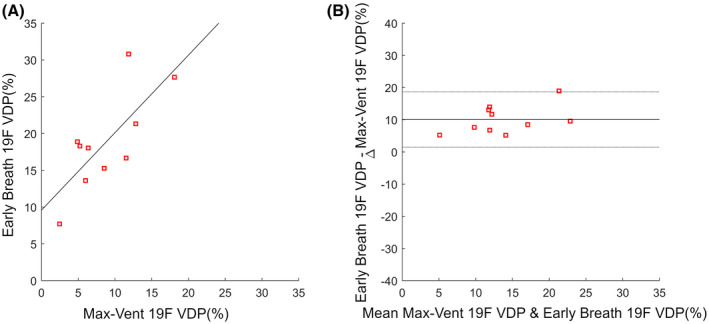
Scatter plot (A) and Bland‐Altman plot (B) showing the comparison of VDP measurements from max‐vent 19F VDP and early‐breath 19F VDP. The correlation was r = 0.75, P = .01. The Bland‐Altman plot shows estimated bias = 10.05 ± 8.6% with P = 4.9e‐5
3.3. Evaluating mismatched 19F and 129Xe ventilation defects
Comparison of low‐resolution and high‐resolution 129Xe images did not reveal any region of non‐congruency that could not be attributed to differences in resolution: high‐resolution ventilation images consistently displayed sharper ventilation defects than the low‐resolution images. In contrast, within the same subject, we observed differences in the location and volume of ventilation defects when comparing 129Xe and 19F images (Figure 5). We sought to utilize the dynamic ventilation data afforded by 19F imaging to further understand the nature of these mismatched regions. In Figure 6, representative mean 19F signal vs. time curves in matched and unmatched ROIs are shown. Mean 19F wash‐in (τ1) and wash‐out (τ2) rate constants derived from these plots, along with the goodness of fit (r‐square), from each ROI type (129Xe + 19F+, 129Xe + 19F‐, and 129Xe‐19F+) are shown with box plots in Figure 7. Wash‐in and wash‐out rate constants (τ1 and τ2, respectively) were higher in both types of mismatched ROIs (129Xe‐ 19F + and 129Xe + 19F‐) when compared with matched ROI (129Xe + 19F+) regions, but only 129Xe + 19F+ vs. 129Xe‐19F + τ2 showed significant difference (P = .008). The mean maximum 19F signal value derived from the modeled signal versus time plot was found to be statistically different between all three different regions (129Xe‐ 19F+, 129Xe + 19F‐, and 129Xe + 19F+), as shown in Table 2. This demonstrates that lung regions with 19F, but no 129Xe, do indeed fill, but at a slower rate and to a lower peak signal (compared with defect‐free ROIs). More surprising is the paradoxical finding of lung regions with 129Xe signal after a single breath, but very low 19F signal after multiple breaths. Examination of 19F wash‐in/out time constants and peak signals in these regions suggests that they also have abnormal ventilation kinetics, yet are not detected as abnormal by the 129Xe method. Because poorly estimated τ1 and τ2 values could lead to misinterpretation of our data, we calculated the goodness of fit for 19F signal in each type of ROI to assess the quality of the data. Importantly, the r‐square values between raw data and calculated exponential curves were very high in each type of ROI, including those with low 19F signal, providing confidence in these observations (R2 = 0.89 ± 0.18 for 129Xe + 19F‐, 0.99 ± 0.003 for 129Xe + 19F+, and 0.99 ± 0.01 for 129Xe‐ 19F+).
FIGURE 5.
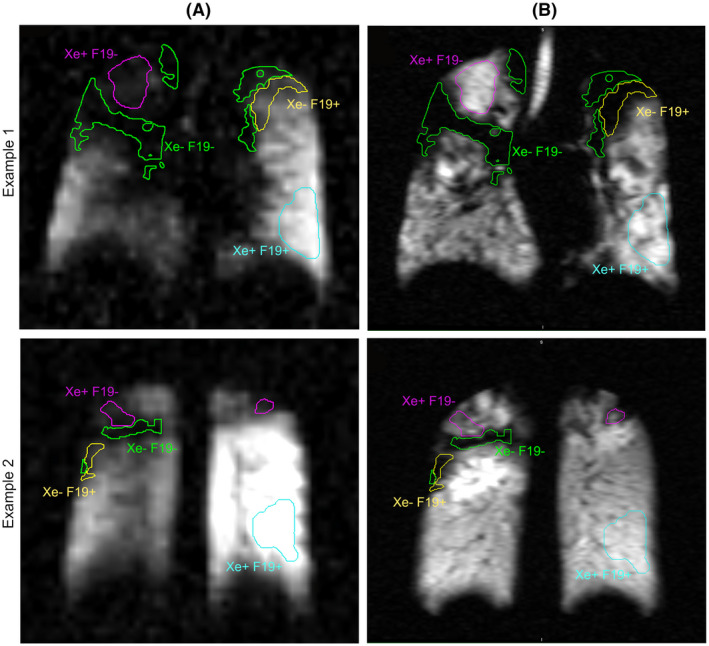
Examples of mismatched ventilation signal from two subjects. A. max‐vent 19F and B. high‐resolution 123Xe images. The purple ROI outlines 129Xe + 19F‐ regions; the yellow ROI outlines 129Xe‐19F + regions; the cyan ROI outlines a matched 129Xe + 19F+ region used for comparison. The green ROI outlines a matched 129Xe‐19F‐ for additional comparison
FIGURE 6.
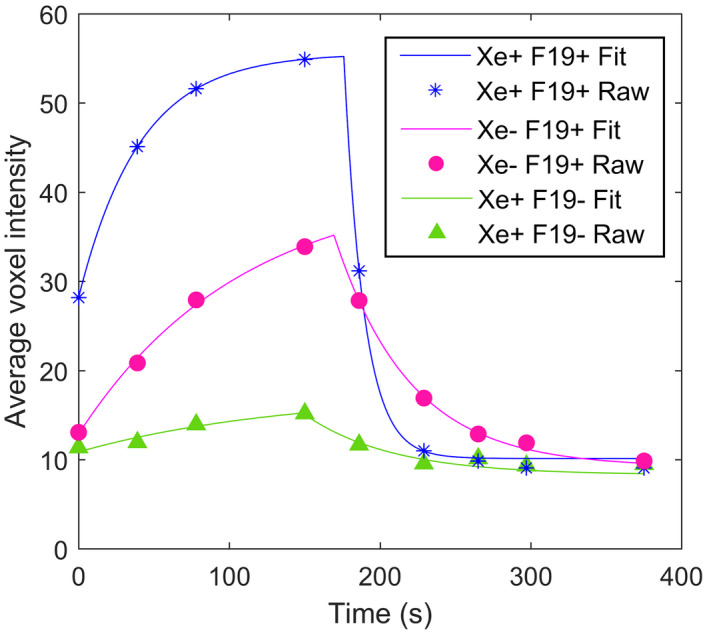
Plots of the raw (symbols) and modeled (lines) 19F signal time course in matched (129Xe + 19F+; blue) and unmatched (129Xe‐19F + and 129Xe + 19F‐; red and green, respectively) ROIs from a single representative subject. In all subjects with mismatched ROIs, a consistent rank order of maximum gas 19F signal of 129Xe + 19F+> 129Xe‐19F+> 129Xe + 19F‐ was observed despite accentuated 129Xe signal (ie, higher than mean lung signal) in some of the 129Xe + 19F‐ ROIs.
FIGURE 7.
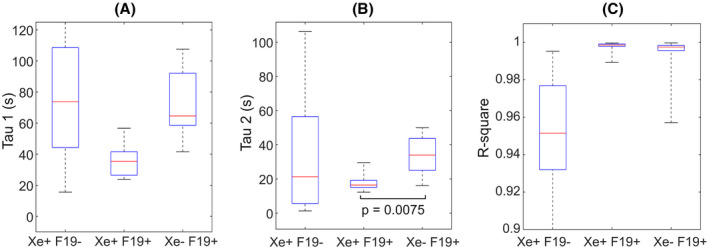
Box plots of wash‐in (τ1) (A) and wash‐out (τ2) (B) time constants from the 19F bi‐exponential fit. c. R‐square indicates the goodness of the fit between raw data and modeled curves. The horizontal brackets indicate statistical significance with corresponding P‐values
4. DISCUSSION
This study reports a first comparison of regional lung ventilation as assessed by dynamic 19F and HP 129Xe MRI imaging in CF subjects. The sequential performance of 19F and 129Xe MRI scans within the same day in subjects with mild CF lung disease provided a powerful platform to make comparisons between these modalities.
As expected, 19F images were characterized by a markedly lower SNR, which prevented direct comparison of single breath 129Xe ventilation images to single breath 19F images. Therefore, we compared early‐breath 19F images (ie, after first appearance of signal during the multiple breath wash‐in procedure) to single breath 129Xe images. However, when assessed after multiple PFP breaths, SNR increased as expected, and a portion of ventilation defects disappeared, indicating that many ventilation defects detected by single breath 129Xe MRI ultimately do fill during the multiple breath wash‐in cycle. What is unclear from this data, however, is whether the filling was due to direct versus collateral ventilation.
When measuring VDP values, image resolution also played a role. In our study, direct comparison of VDP values from high‐resolution 129Xe and low‐resolution 129Xe ventilation images allowed for the isolation of the effect of resolution on VDP. As expected, relative to high‐res 129Xe scans, low‐res 129Xe scans were more prone to partial volume effects and consistently underestimated VDP. This underestimation is larger at higher VDPs, with the trend showing low‐res scans underestimate VDP by about 50%. It is important to note that the size of the VDP underestimation in the low‐resolution 129Xe images is a function of the specific signal intensity threshold used. In particular, by using a less conservative signal threshold, some additional ventilation defects could be captured in the low‐resolution 129Xe images, resulting into higher VDP values.
Our data also suggest that VDP may be overestimated by single breath approaches (early‐breath 19F, low‐res 129Xe, high‐res 129Xe), which consistently measured higher VDPs than those determined via max‐vent 19F images. Since slow filling regions appear as regions of ventilation defects in single‐breath hold images, they cannot be differentiated from regions of true ventilation defects. To this end, the multiple breath protocol employed for 19F imaging provides the ability to differentiate between true ventilation defects and slow filling regions, by providing wash‐in and wash‐out gas kinetics. In particular, in areas of congruence (129Xe + 19F+ or 129Xe‐19F‐), ventilation kinetics were as expected, with either rapid or absent ventilation, respectively. In regions that were 129Xe‐19F+, on the contrary, the multiple breath PFP protocol was able to demonstrate that these regions were not truly unventilated, but, rather, slow to fill. Because HP 129Xe images are acquired using a single breath technique, these slowly filling regions could not be differentiated from true non‐filling regions. As such, dynamic imaging using 19F provides additional capability to characterize these abnormal regions.
The observation of lung regions with a 129Xe + 19F‐ pattern was unexpected, as multiple breaths of PFP is not expected to be less likely to fill a partially obstructed region than a single breath of 129Xe. The presence of 129Xe gas suggests that these areas must be receiving some ventilation, despite the paucity of 19F signal. The reduced 19F signal in these regions may be explained by the low SNR and diffusivity of the gas, when compared with 129Xe, coupled with an increase in airway resistance in the region, similarly to what has already been observed in 129Xe/3He comparison studies in COPD patients. 25 The analysis of τ1 and τ2 rate constants, which we were able to characterize with a high degree of confidence despite the relatively low 19F signal, confirmed that in these lung regions, not only was peak 19F signal low, but also the rates of both gas wash‐in and wash‐out were markedly slowed. The presence of 129Xe signal (in some cases, even an accentuated 129Xe signal) in these regions could be explained by a reduced concentration of molecular oxygen in these poorly ventilated regions. This could theoretically be encountered in areas of gas trapping, where some contrast gas is able to enter the region, perhaps by collateral ventilation, but encounters an environment that is relatively devoid of oxygen. This would thereby reduce the rate of HP 129Xe depolarization and, in turn, cause a paradoxically higher 129Xe signal. If this is the case, 129Xe MRI may at times under‐report true ventilation defects, as the result of the complex relationship between 129Xe polarization and the local lung oxygen tension. While further testing is required to fully assess gas trapping effects on 129Xe MRI images, our results show that the addition of dynamic 19F imaging in registration with HP 129Xe has provided important additional insights into lung ventilation dynamics.
The peak 19F value at the end of the inhalation sequences was also able to differentiate these three different filling patterns, suggesting that the delayed phase filling with PFP as a single parameter may be the most informative of the ventilation status (Table 2). Further work in other disease states could better inform the clinical utility of the dynamic 19F approaches. Although we did not perform repeatability scans as a part of this study, others have shown that dynamic 19F ventilation imaging, albeit with a different scanning protocol, has good repeatability in normal subjects and subjects with chronic obstructive pulmonary diseases. 26
Several technical factors impacted our data, including challenges related to co‐registration of 19F, 129Xe, and 1H images. Proton images of the thoracic cavity and gas ventilation images were obtained during separate maximal inhalation breath‐holds, making it likely that the same inspiratory capacity might not be reached consistently. As a result, differences in lung inflation volumes can be expected to cause co‐registration errors, both in 19F and 1H images. This problem is avoided with the 129Xe‐MRI method, as a fixed inhalation volume can be achieved simply through the use of a fixed volume gas delivery bag. Differences in lung inflation may have led to additional ventilation defects around the lung edges. Thus, the ability to simultaneously acquire anatomical and ventilation images within a single breath‐hold, as done for HP ventilation imaging, would likely benefit the 19F method. 27 , 28 Recent work to accelerate 19F ventilation imaging, which could allow for acquisition of 19F/1H images in a single breath hold, would accomplish this goal. 29 , 30 A related minor limitation for the study was the need to reposition the patient between the two inhaled gas studies.
Finally, the use of a multi‐channel 19F lung coil led to B1 inhomogeneities that were subject and coil position dependent and could not be corrected. B1 inhomogeneities made ventilation thresholds position dependent, preventing the application of typical linear binning techniques that delineate regions of high, medium and low intensity areas based on universal thresholds. 31 Moreover, retrospective bias‐field estimation techniques, often used to reduce subject‐dependent B1 effects in 129Xe studies, 31 created spurious gas‐filled regions from noise level intensity in low SNR 19F images. This is not surprising as these techniques have been developed for high‐SNR images and, in 19F images, where SNR is on the order of the bias‐field correction, they artificially change image intensities by a factor of 2 or 3. 31 , 32
5. CONCLUSIONS
In CF subjects, ventilation abnormalities are identified by both 19F and HP 129Xe imaging but are not entirely congruent across all areas of ventilation. The use of both modalities in this study allowed us to identify an “imaging phenotype” that resulted from normally ventilated, slowly ventilated, and non‐ventilated regions. Although further work is needed to evaluate these techniques in other patient populations, these data strongly suggest the complimentary nature of 19F and HP 129Xe imaging; however, VDPs obtained from each method should not be considered equivalent. These data also highlight the utility of ventilation kinetic analyses with 19F MRI and the inherent limitations of relying on a single breath VDP assessment for the characterization of airway function.
ACKNOWLEDGMENTS
This work was supported by the Cystic Fibrosis Foundation (DONALD14XX0 and GORALS19Y5) and the NIDDK (P30 DK 065988 and DK 108231). We gratefully acknowledge the regulatory assistance of the North Carolina Translational and Clinical Sciences (NC TraCS) Institute, which is supported by the National Center for Advancing Translational Sciences (NCATS), National Institute of Health, through Grant Award Number UL1TR002489. Dr Goralski also acknowledges support from the Doris Duke Charitable Foundation (Grant 2015213).
McCallister A, Chung SH, Antonacci M, et al. Comparison of single breath hyperpolarized 129Xe MRI with dynamic 19F MRI in cystic fibrosis lung disease. Magn Reson Med. 2020;85:1028–1038. 10.1002/mrm.28457
Andrew McCallister and Sang Hun Chung contributed equally to this manuscript.
DATA AVAILABILITY STATEMENT
All data and processing algorithms have been uploaded to the UNC Libraries Carolina Digital Repository and is available online at https://cdr.lib.unc.edu/concern/data_sets/m900p0761?locale=en.
REFERENCES
- 1. Collins FS. Cystic fibrosis: Molecular biology & therapeutic implications. Science (80‐ ). 1992;256:774‐779. [DOI] [PubMed] [Google Scholar]
- 2. Eichinger M, Heussel CP, Kauczor HU, Tiddens H, Puderbach M. Computed tomography and magnetic resonance imaging in cystic fibrosis lung disease. J Magn Reson Imaging. 2010;32:1370‐1378. [DOI] [PubMed] [Google Scholar]
- 3. Johnson KM, Fain SB, Schiebler ML, Nagle S. Optimized 3D ultrashort echo time pulmonary MRI. Magn Reson Med. 2013;70:1241‐1250. [DOI] [PMC free article] [PubMed] [Google Scholar]
- 4. Roos JE, McAdams HP, Kaushik SS, Driehuys B. Hyperpolarized gas MRI: Technique and applications. Magn Reson Imaging Clin N Am. 2016;23:217‐229. [DOI] [PMC free article] [PubMed] [Google Scholar]
- 5. Altes TA, Eichinger M, Puderbach M. Magnetic resonance imaging of the lung in cystic fibrosis. Proc Am Thorac Soc. 2007;4:321‐327. [DOI] [PubMed] [Google Scholar]
- 6. Kanhere N, Couch MJ, Kowalik K, et al. Correlation of lung clearance index with hyperpolarized 129 Xe magnetic resonance imaging in pediatric subjects with cystic fibrosis. Am J Respir Crit Care Med. 2017;196:1073‐1075. [DOI] [PubMed] [Google Scholar]
- 7. Ouriadov A, Farag A, Kirby M, McCormack DG, Parraga G, Santyr GE. Lung morphometry using hyperpolarized 129Xe apparent diffusion coefficient anisotropy in chronic obstructive pulmonary disease. Magn Reson Med. 2013;70:1699‐1706. [DOI] [PubMed] [Google Scholar]
- 8. Hamedani H, Clapp JT, Kadlecek SJ, et al. Regional fractional ventilation by using multibreath wash‐in 3 He MR imaging. Radiology. 2017;285:1063‐1063. [DOI] [PMC free article] [PubMed] [Google Scholar]
- 9. Thomen RP, Walkup LL, Roach DJ, Cleveland ZI, Clancy JP, Woods JC. Hyperpolarized 129Xe for investigation of mild cystic fibrosis lung disease in pediatric patients. J Cyst Fibros. 2017;16:275‐282. [DOI] [PMC free article] [PubMed] [Google Scholar]
- 10. Ebner L, Kammerman J, Driehuys B, Schiebler ML, Cadman RV, Fain SB. The role of hyperpolarized 129xenon in MR imaging of pulmonary function. Eur J Radiol. 2017;86:343‐352. [DOI] [PMC free article] [PubMed] [Google Scholar]
- 11. Zhang L, Burant A, McCallister A, et al. Accurate MR thermometry by hyperpolarized 129 Xe. Magn Reson Med. 2016;78:1070‐1079. [DOI] [PMC free article] [PubMed] [Google Scholar]
- 12. Rao M, Stewart NJ, Norquay G, Griffiths PD, Wild JM. High resolution spectroscopy and chemical shift imaging of hyperpolarized 129Xe dissolved in the human brain in vivo at 1.5 Tesla. Magn Reson Med. 2016;75:2227‐2234. [DOI] [PMC free article] [PubMed] [Google Scholar]
- 13. Kennedy RR, Stokes JW, Downing P. Anaesthesia and the “inert” gases with special reference to xenon. Anaesth Intensive Care. 1992;20:66‐70. [DOI] [PubMed] [Google Scholar]
- 14. Shukla Y, Wheatley A, Kirby M, et al. Hyperpolarized 129Xe magnetic resonance imaging. Tolerability in healthy volunteers and subjects with pulmonary disease. Acad Radiol. 2012;19:941‐951. [DOI] [PubMed] [Google Scholar]
- 15. Walkup LL, Thomen RP, Akinyi TG, et al. Feasibility, tolerability and safety of pediatric hyperpolarized 129Xe magnetic resonance imaging in healthy volunteers and children with cystic fibrosis. Pediatr Radiol. 2016;46:1651‐1662. [DOI] [PMC free article] [PubMed] [Google Scholar]
- 16. Couch MJ, Ball IK, Li T, et al. Pulmonary ultrashort echo time 19F MR imaging with inhaled fluorinated gas mixtures in healthy volunteers: Feasibility. Radiology. 2013;269:903‐909. [DOI] [PubMed] [Google Scholar]
- 17. Couch MJ, Ball IK, Li T, Fox MS, Biman B, Albert MS. 19F MRI of the lungs using inert fluorinated gases: Challenges and new developments. 2019;49:343‐354. [DOI] [PubMed] [Google Scholar]
- 18. Gutberlet M, Kaireit TF, Voskrebenzev A, et al. Free‐breathing dynamic (19)F gas MR imaging for mapping of regional lung ventilation in patients with COPD. Radiology. 2018;286:1040‐1051. [DOI] [PubMed] [Google Scholar]
- 19. Goralski JL, Chung SH, Glass TM, et al. Dynamic perfluorinated gas MRI reveals abnormal ventilation despite normal FEV1 in cystic fibrosis. JCI Insight. 2019;5:e133400. [DOI] [PMC free article] [PubMed] [Google Scholar]
- 20. Halaweish AF, Moon RE, Foster WM, et al. Perfluoropropane gas as a magnetic resonance lung imaging contrast agent in humans. Chest. 2013;144:1300‐1310. [DOI] [PubMed] [Google Scholar]
- 21. Maunder A, Hughes PJC, Chan H, et al. Comparing 19 F C3F8 lung ventilation imaging with hyperpolarized 129 Xe: Similarities and limitations. Proc Intl Soc Mag Reson Med. 2018;26:1083‐1085. [Google Scholar]
- 22. Miller MR, Hankinson J, Brusasco V, et al. Standardisation of spirometry. Eur Respir J. 2005;26:319‐338. [DOI] [PubMed] [Google Scholar]
- 23. Guyer RA, Hellman MD, Emami K, et al. A robust method for estimating regional pulmonary parameters in presence of noise. Acad Radiol. 2008;15:740‐752. [DOI] [PMC free article] [PubMed] [Google Scholar]
- 24. Chon D, Simon BA, Beck KC, et al. Differences in regional wash‐in and wash‐out time constants for xenon‐CT ventilation studies. Respir Physiol Neurobiol. 2005;148:65‐83. [DOI] [PubMed] [Google Scholar]
- 25. Kirby M, Svenningsen S, Owrangi A, et al. Hyperpolarized 3He and 129Xe MR imaging in healthy volunteers and patients with chronic obstructive pulmonary disease. Radiology. 2012;265:600‐610. [DOI] [PubMed] [Google Scholar]
- 26. Gutberlet M, Kaireit TF, Voskrebenzev A, et al. Repeatability of regional lung ventilation quantification using fluorinated (19F) gas magnetic resonance imaging. Acad Radiol. 2019;26:395‐403. [DOI] [PubMed] [Google Scholar]
- 27. Wild JM, Ajraoui S, Deppe MH, et al. Synchronous acquisition of hyperpolarised 3He and 1H MR images of the lungs—Maximising mutual anatomical and functional information. NMR Biomed. 2011;24:130‐134. [DOI] [PubMed] [Google Scholar]
- 28. Wild JM, Marshall H, Norquay G, Parnell SR, Clemence M, Griffiths PD. Simultaneous imaging of lung structure and function with triple‐nuclear hybrid MR imaging. Radiology. 2013;267:251‐255. [DOI] [PubMed] [Google Scholar]
- 29. Neal MA, Pippard BJ, Hollingsworth KG, et al. Optimized and accelerated 19 F‐MRI of inhaled perfluoropropane to assess regional pulmonary ventilation. Magn Reson Med. 2019;82:1301‐1311. [DOI] [PMC free article] [PubMed] [Google Scholar]
- 30. Obert AJ, Gutberlet M, Kern AL, et al. 1H‐guided reconstruction of 19F gas MRI in COPD patients. Magn Reson Med. 2020;84:1336‐1346. [DOI] [PubMed] [Google Scholar]
- 31. He M, Kaushik SS, Robertson SH, et al. Extending semiautomatic ventilation defect analysis for hyperpolarized 129Xe ventilation MRI. Acad Radiol. 2014;21:1530‐1541. [DOI] [PMC free article] [PubMed] [Google Scholar]
- 32. Li C, Gore JC, Davatzikos C. Multiplicative intrinsic component optimization (MICO) for MRI bias field estimation and tissue segmentation. Magn Reson Imaging. 2014;32:913‐923. [DOI] [PMC free article] [PubMed] [Google Scholar]
Associated Data
This section collects any data citations, data availability statements, or supplementary materials included in this article.
Data Availability Statement
All data and processing algorithms have been uploaded to the UNC Libraries Carolina Digital Repository and is available online at https://cdr.lib.unc.edu/concern/data_sets/m900p0761?locale=en.


