

Abstract
Recent data from immuno‐oncology clinical studies have shown the exposure–response (E–R) relationship for therapeutic monoclonal antibodies (mAbs) was often confounded by various factors due to the complex interplay of patient characteristics, disease, drug exposure, clearance, and treatment response and presented challenges in characterization and interpretation of E–R analysis. To tackle the challenges, exposure relationships for therapeutic mAbs in immuno‐oncology and oncology are reviewed, and a general framework for an integrative understanding of E–R relationship is proposed. In this framework, baseline factors, drug exposure, and treatment response are envisioned to form an interconnected triangle, driving the E–R relationship and underlying three components that compose the apparent relationship: exposure‐driven E–R, baseline‐driven E–R, and response‐driven E–R. Various strategies in data analysis and study design to decouple those components and mitigate the confounding effect are reviewed for their merits and limitations, and a potential roadmap for selection of these strategies is proposed. Specifically, exposure metrics based on a single‐dose pharmacokinetic model can be used to mitigate response‐driven E–R, while multivariable analysis and/or case control analysis of data obtained from multiple dose levels in a randomized study may be used to account for the baseline‐driven E–R. In this context, the importance of collecting data from multiple dose levels, the role of prognostic factors and predictive factors, the potential utility of clearance at baseline and its change over time, and future directions are discussed.
Analysis of the exposure response (E–R) relationship has long been an important tool for dose selection and optimization and regulatory decisions during all stages of drug development. 1 , 2 , 3 In general, it is assumed that the E–R relationship is driven by the exposure and, therefore, a positive E–R correlation suggests that a higher exposure at a higher dose would lead to a better response. However, several recent reports from clinical studies with therapeutic monoclonal antibodies (mAbs) in oncology or immuno‐oncology field have shown that this is not always true. 4 , 5 , 6 , 7 , 8 , 9
An apparent E–R relationship for efficacy was observed for many therapeutic mAbs at the approved dose or at the dose studied in late‐stage clinical development, including program cell death protein 1 (PD1) or program death‐ligand 1 (PDL1) inhibitors, such as atezolizumab, 10 avelumab, 11 , 12 nivolumab, 7 and pembrolizumab, 8 cytotoxic T‐lymphocyte associated protein 4 (CTLA4) inhibitors ipilimumab 13 and tremelimumab, 5 anti‐vascular endothelial growth factor (VEGF) antibody ramucirumab, 6 anti‐MET antibody rilotumumab, 14 , 15 human epidermal growth factor receptor 2 (HER2) receptor inhibitor trastuzumab, 16 anti‐CD‐20 antibody obinutuzumab, 17 and tumor necrosis factor (TNF)‐alpha inhibitors infliximab. 18 The apparent E–R relationship sometimes triggered further clinical studies at a higher dose, yet an improved efficacy at a higher dose has not always been confirmed. For example, a positive exposure–efficacy relationship with tremelimumab was observed at 15 mg/kg every 12 weeks, 19 but a later study with a higher dose intensity (10 mg/kg every 4 weeks for 24 week followed by 10 mg/kg every 12 weeks) failed to confirm a better efficacy. 5 , 20 Similarly, for trastuzumab, a postmarketing study at a dose higher than the approved dose did not confirm a better response. 21 There was also confusion in the literature on whether a higher dose of nivolumab should be considered due to an apparent E–R relationship. 22 , 23 , 24
Thus, the apparent E–R relationship for these therapeutic mAbs is not always informative and sometimes can be misleading. The phenomenon is not well understood and has created challenges regarding the dose selection and optimization of these agents. Current literature has shed some light on interpretation of these exposure–efficacy relationships for anticancer therapeutic mAbs by highlighting the confounding effect of baseline disease factors, disease progression, and modification in the E–R relationship. 25 However, several important questions need to be further clarified. For example, how are the factors in apparent E–R relationship related to each other? What are the common characteristics of the baseline disease factors that confound the E–R relationship? Does the confounded E–R relationship have broader implications beyond efficacy end points and oncology? What are the mathematical principles for such confounding effects? With these questions in mind, an extensive literature review was conducted focusing on the interplay of various factors involved in the E–R relationship. In addition, current and emerging strategies in characterizing the E–R relationship were reviewed and then integrated into a potential roadmap for practical use.
The Confounded E–R Relationship for Therapeutic mAbs
Table 1 summarizes the apparent E–R relationship for selected therapeutic mAbs. Most of them are in the area of immuno‐oncology and oncology for a wide range of targets including PD1, PDL1, CTL4, HERs, VEGF, and CD20. An example of a therapeutic mAb in therapeutic areas outside of oncology (infliximab, an antibody against tumor necrosis factor‐alpha) is also included. As evident from Table 1 , apparent exposure–efficacy relationships were observed for these therapeutic mAbs regardless of efficacy end points (tumor response, progression free survival, or overall survival) or exposure metrics (minimum concentration (Cmin) or area under the curve (AUC)).
Table 1.
Apparent exposure–response relationship with selected therapeutic proteins
| Cemiplimab | Nivolumab | Pembrolizumab | Atezolizumab | Avelumab | Durvalumab | Bintrafusp Alfa (M7824) | Ipilimumab | Tremelimumab | Trastuzumab emtansine | Infliximab | Ramucirumab | Obinutuzumab | |
|---|---|---|---|---|---|---|---|---|---|---|---|---|---|
| Target | PD‐1 | PD‐1 | PD‐1 | PD‐L1 | PD‐L1 | PD‐L1 | PD‐L1 & TGF‐β | CTLA4 | CTLA4 | HER2 | TNF‐α | VEGFR2 | CD‐20 |
| Exposure metrics used in E–R analysis | C ,1 | C 1, C ss | AUC based on CL in 1st cycle |
C 1, C ss for mUC C ss for NSCLC |
C 1, C ss | C 1, C 2 and C ss | C 1 | C ss | C ss | C 1 | C trough at different time points during treatment | C ss | C avg,all |
| Efficacy end points | BOR | BOR and OS | BOR and OS | BOR and OS | BOR, PFS and OS | BOR | BOR and PFS | BOR and OS | OS | BOR, PFS and OS | Clinical response (Mayo score), mucosal healing and clinical remission | PFS and OS | BOR, PFS and OS |
| Apparent overall E–R relationship for efficacy | Flat relationship when C 1 was used | Within‐dose E–R positive | Within‐dose E–R Positive | mUC: flat relationship with C 1 but a positive trend with C ss; NSCLC: Positive with C ss | Positive |
Inconclusive for C 1, C 2 A positive trend with C ss for mUC |
Positive | Positive | Positive for malignant mesothelioma | Positive for model‐predicted exposure metrics but a shallow slope for observed metrics | Positive for ulcerative colitis | Positive for GC, NSCLC and CRC | Positive for CLL |
| Time varying clearance (i.e., response‐driven E–R)? | Yes | Yes | Yes |
No for mUC Yes for NSCLC |
Yes |
Yes for MCC No for other tumor types |
No | Yes | No | Not reported | Not reported | Not reported | Yes |
| Baseline factors that affect efficacy response (B_shared + B_response) in multivariable E–R model | Not reported | Baseline CL, baseline body weight, age, ECOG, LDH and tumor burden |
All indications: Baseline CL NSCLC: ALB, LDH, histology, gender, BSLD, ECOG, WTRATE, ALBRATE; Melanoma: BSLD, PDL‐1, PLT, ALB, BRAF, ECOG, WTRATE |
ECOG, PD‐L1 status, tumor size, albumin, LDH, alkaline phosphatase and tumor type | PD‐L1 status, HGB, ALT, race, LDH, VMET, baseline body weight, NACT, PARTRACT, baseline tumor burden | Only PDL‐1 status reported | Baseline CL, PDL1 status and metastasis | ECOG performance status and baseline serum LDH. | Sex, inflammatory status (CRP), baseline tumor size, ECOG and EORTC status | ECOG, tumor burden, number of disease sites and HER2 ECD | Body weight, sex and corticosteroid therapy affecting E‐R while baseline clearance, serum albumin concentration, occurrence of anti‐TNF inhibitor antibodies affecting exposure | Time to progression after beginning first line therapy, KRAS status, ECOG, number of metastatic sites, liver only metastasis, CEA, gender and prior bevacizumab use | Baseline tumor burden, baseline CIRS score, baseline circulating lymphocytes, time from diagnosis to randomization |
| Does univariable regression has steeper slope/higher hazard than Multivariable regression for efficacy? a | Only univariable analysis was reported | Yes | Yes | flat slope for both | Yes | Only univariable analysis was reported | Similar slope for univariable and multivariable analysis | Yes | Only univariable analysis was done | Yes | Inconclusive | Yes | No |
| Does case control analysis mitigate confounding of efficacy E–R? | Not reported | Yes when C 1 was used; No when C SS was used | Yes, partial | Not reported | Not reported | Not reported | Not reported (no control group) | Not reported | Not reported | Not reported for across exposure analysis | Not reported | No | Not reported |
| Apparent E–R relationship for safety | Flat relationship (Grade ≥ 3 AEs and SAEs) | Flat relationship | Flat relationship |
mUC: Flat relationship (Grade ≥ 3 AEs) and a positive trend for AESI with C ss; NSCLC: Positive for AESI and negative for Grade ≥ 3 AEs with C ss; flat for AESI and Grade ≥ 3 AEs with C 1 |
Flat relationship between C 1 and IRR; Positive trend for C ss‐irAEs; Negative trend between C ss‐Grade ≥ 3 AEs |
Flat relationship |
Weak or flat relationship for C 1 and different AEs; a negative trend for Grade ≥ 3 AEs; a positive trend for irAEs |
Positive for irAE | Not reported | Flat relationship for most Grade ≥ 3 AEs | Not reported | Positive for Grade ≥ 3 AEs in GC, NSCLC and CRC | Flat with a positive trend |
| References | 33 | 4, 7, 29, 69, 70 | 8, 30, 71 | 10, 34, 54, 72 | 11, 12, 31, 73 | 38, 74 | 26, 39, 41, 75 | 13, 76 | 5, 19 | 9, 77 | 18 | 6, 78 | 17 |
AEs, Adverse events; AESI, Adverse event of special interest; ALB, Serum Albumin; ALBRATE, on‐study rate of albumin change; AUC, area under the concentration‐time curve; B‐response, baseline factors affecting response only; BRAF, BRAF mutation status; B‐shared, baseline factors affecting both exposure and response; BSLD, baseline sum of the longest diameter of the target lesion; BOR, best overall response; C 1, exposure metrics at cycle 1; C 2, exposure metrics at cycle 2; C avg,all, average concentration during all treatment cycles; CEA, carcinoembryonic antigen; CIRS, Cumulative Illness Rating Scale; CL, clearance; CLL, chronic lymphocytic leukemia; CRC, colorectal cancer; CRP, C‐reactive protein; C ss, exposure metrics at steady state; ECOG, Eastern Cooperative Oncology Group performance status; EORTC, European Organization for Research and Treatment of Cancer; E–R, exposure–response; GC, gastric cancer; HER2, human epidermal growth factor receptor 2 extracellular domain; HGB, hemoglobin; irAE, immune‐related adverse event; IRR, infusion related adverse event; LDH, lactate dehydrogenase; mUC, metastatic urothelial carcinoma; NACT, number of prior anticancer therapies; NSCLC, non‐small cell lung cancer; PARTRACT, tumor sub‐site, upper or lower; OS, overall survival; PDL1, tumor PD‐L1 expression positivity; PFS, progression free survival; PLT, platelet count; SAEs, serious adverse events; TNF, tumor necrosis factor; VMET, visceral metastasis status; WTRATE, body weight change rate.
Determined based on regression plots and coefficients.
Several baseline disease conditions, such as Eastern Cooperative Oncology Group (ECOG) status, number of metastatic sites, baseline tumor burden, cancer‐related cachexia, lactate dehydrogenase (LDH), albumin, etc., were found to be the confounding factors for the E–R relationship. Specifically, severity of disease condition at the baseline were shown to be negatively associated with efficacy response, leading to an apparent positive E–R efficacy slope. 4 , 8 , 25 In addition, clearance (CL) was also a strong covariate for efficacy and a confounding factor for the E–R relationship. A strong correlation was observed between baseline CL and patient survival in oncology studies. 4 , 5 , 7 , 8 , 23 , 26 Once CL was included as a covariate, the correlation between exposure and survival diminished. It appears that CL is closely related to the baseline disease condition, such as cancer‐related cachexia. 8 , 27 It is conjectured that the elevated inflammation and proteolytic activity in cancer‐related cachexia is responsible for the high CL. 27 , 28 Under this hypothesis, CL would be reduced, and exposure would be increased after treatment and disease modification over time. In fact, a decrease in CL and increase in exposure over time was observed after chronic treatment with PD‐1/PD‐L1 inhibitors. For example, nivolumab, 29 pembrolizumab, 30 avelumab, 31 atezolizumab, 10 durvalumab, 32 and cemiplimab 33 have been shown to reduce CL after multiple dosing (approximate reduction of 15–30%) compared with that at the first dose in some tumor types, per population pharmacokinetic (PopPK) analysis. This change in CL over time is different from the time‐dependent induction or inhibition observed with small‐molecule drugs in that the latter is not caused by treatment response (i.e., disease progression or disease modification) other than direct effect on the metabolic enzymes and has not been reported to have any effect on the E–R relationship. Of note, the presence of time‐varying CL seems to depend on the type of disease or tumor. For example, time‐varying CL was observed for atezolizumab with non‐small cell lung cancer 10 but not with urothelial carcinoma, 34 and only pronounced in Merkel cell carcinoma for avelumab among various tumor types examined so far. 31
The presence of time‐varying CL further complicates the interpretation of the observed E–R relationship for therapeutic mAbs. Simulation showed that even a subtle change in CL over time may lead to a biased E–R relationship and make a true flat relationship appear to be steep. 35 Clinical data showed that apparent E–R relationships for these drugs were more pronounced when late‐stage exposure metrics were used compared with those with early‐exposure metrics. For example, nivolumab pharmacokinetic (PK) exposure at steady state was significantly correlated with efficacy, while PK exposure at the 1st cycle (C 1) was not. 4 , 7 , 29 , 36 , 37 Similarly, in the case of durvalumab, there was a trend (albeit not significant) of positive correlation between the steady‐state exposure and efficacy, but not between the early exposure metrics and efficacy. 38 For cemiplimab, 33 only the first cycle exposure was used for E–R efficacy analysis and showed no apparent E–R relationship, while E–R for steady‐state exposure metrics was not reported presumably due to the concern of confounding effect. Of note, sometimes the confounding was not fully mitigated by using C 1, which likely reflects the confounding by baseline factors. 9
Other observations on E–R relationship of these therapeutic mAbs are also worth noting. The apparent E–R relationships were shown to be steeper with data from a single dose level compared with data from multiple dose levels, and with univariable analysis compared with multivariable analysis (as summarized in Table 1 ). The E–R relationship for some safety end points with several therapeutic mAbs seems to have a negative trend, 10 , 11 , 12 , 39 but the mechanism is not well understood or explained.
Clearly E–R relationships for therapeutic mAbs in immuno‐oncology/oncology are complex and involve multiple factors and mechanisms. A framework that could integrate all the elements would be valuable for understanding the confounding effects on the E–R relationship and for selecting appropriate strategies to address them. At a minimum, such a framework would have three major elements: exposure (E), response (R), and various baseline factors (B) related to patient characteristics and disease condition.
A Framework for the E–R Relationship
Logically, like the relationship between any two variables, the E–R relationship can only be a consequence of three fundamental interactions: (i) E causes the change in R, with E being the independent variable and R as the dependent variable; (ii) vice versa; or (iii) a third factor(s), B in this case, affects both E and R, i.e., both E and R are dependent variables. Among these three interactions, only the first one is typically considered important and the E–R relationship has been traditionally viewed as a one‐way relationship in which R is driven by E. The other two interactions were generally not appreciated until recently with the observation of complex E–R relationships of therapeutic mAbs in immuno‐oncology, and ignoring them has sometimes led to biased interpretation. Thus, all three interactions should be considered in interpreting the E–R relationship. In this context, it is envisioned that three elements, B, E, and R, form an interconnected triangle and contribute to the E–R relationship from their respective angles (Figure 1a ). Further, it is conceived that apparent E–R relationship can be dissected to three components based on the causes: exposure‐driven E–R, response‐driven E–R, and baseline‐driven E–R. Yet, the latter two components are often falsely perceived as being driven by exposure (Figure 1b ), which is explained with algebraic equations (Box S1 ). Mechanistically, E and B would affect R first, and subsequently R would affect E as illustrated in Figure 1c .
Figure 1.
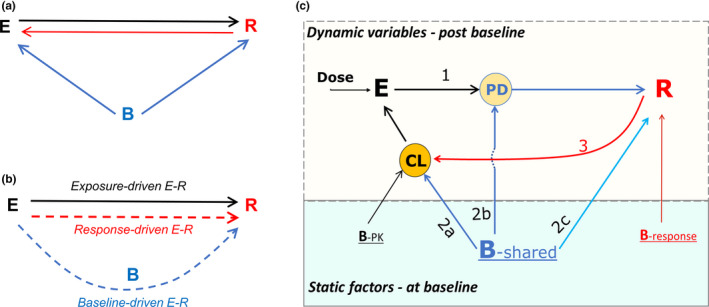
Framework for E–R relationship. (a) Concept of triangular relationship among baseline factors (B), exposure (E) and response (R): logically E–R relationship can only be a consequence of (i) E causing the change in R; (ii) vice versa; or (iii) a third factor(s), B in this case, affecting both E and R. (b) Perception of the relationship: Two of three putative components of apparent E–R relationship, response‐driven E–R and baseline‐driven E–R, are often falsely perceived as being driven by exposure as shown by dotted lines with arrows pointing from E to R. The false perception confounds the identification of the true E–R relationship (i.e., exposure‐driven E–R). (c) Mechanism of the relationship with three major interactions being labeled with numbers: 1, E modulates PD (pharmacodynamic) factors leading to the change in R; 2a, B affects PK parameters such as CL (clearance) and subsequently E; 2b, baseline predictive factors either become PD factors during treatment or modulate PD factors, and thus may promote disease progression in control arm but enhance R in the treatment arm; 2c, baseline prognostic factors have similar effects on R in treatment and control arms; 3, R (disease modification or progression) changes PK parameters such as CL and subsequently E, forming a circle between E and R; Top box includes postbaseline dynamic variables and the bottom box has static factors (i.e., time‐invariant) at the baseline; B‐PK, B‐response, and B‐shared are the baseline factors associated with PK only, response only, and both, respectively.
Effect of E on R and on the E–R relationship
Exposure‐driven E–R is the true E–R relationship that is dictated by dose/exposure and is the basis for dose selection and optimization. The underlying mechanism of exposure‐driven E–R is that drug binds the drug target, leading to downstream pharmacodynamic (PD) changes, and efficacy/safety response (Figure 1c ). In addition to dose, “purely” PK‐related baseline factors (BPK), defined as factors that affect PK parameters only (having no association with response), are expected to affect the exposure‐driven E–R relationship.
Effect of B on both E and R, and on the E–R relationship
Baseline factors are a medley of various baseline factors like disease status, patient intrinsic characteristic, demographic factors, etc. Some are the aforementioned “purely” PK‐related (B‐PK); some are “purely” response‐related factors that affect response only; and others are the “shared” ones between exposure and response (B‐shared). For mAbs in immuno‐oncology/oncology, cancer‐related cachexia is considered as one of the most important disease‐related “shared” baseline factors that could confound the E–R relationship. 27 , 28 , 40 When B‐shared affects both E and R (Figure 1c ), an indirect relationship between exposure and response can be established as described in Box S1 and is called baseline‐driven E–R.
B‐shared affects exposure by influencing PK parameters such as CL. For several immuno‐oncology therapeutic mAbs, baseline disease conditions are shown to be positively associated with baseline CL 31 , 32 , 36 , 41 (Figure 1c , component 2a). B‐shared also affects R, such as efficacy (disease modification or progression), safety, or PD response. Interestingly, while most apparent E–R slopes for efficacy end points are positive, a negative E–R relationship was observed for some safety end points with several therapeutic mAbs, but the mechanism is not well understood. 10 , 11 , 12 , 39 This phenomenon could be explained with the framework as such: Subjects with severe disease condition often have a higher rate of safety events and in the meantime are associated with a lower exposure (via increasing CL for therapeutic proteins). This opposing effects by baseline disease condition on E and R (safety in this case) would lead to a negative E–R slope, as described mathematically in Box S2 .
Based on their interaction with the treatment, baseline factors can be classified as prognostic or predictive factors. 42 , 43 , 44 During the treatment, baseline predictive factors either become PD factors (or drug target) or modulate PD factors (Figure 1c , component 2b). Thus, predictive factors can directly or indirectly interact with drug treatment (via exposure) and lead to enhanced treatment response (disease modification) in the treatment group but may exacerbate the disease progression in the control group. For example, subjects with a high expression of PDL1 45 , 46 or MET mutations 14 have shown to have better efficacy in the treatment arm (with anti‐PD1/PDL1 or anti‐MET drugs), but have a lower response in the control arm compared with subjects with low expression in both arms. On the other hand, prognostic baseline factors do not interact with drug effect (exposure) and are expected to have a similar effect between the treatment group and the control group (Figure 1c , component 2c). For oncology indications, this difference translates to different effects on the hazard ratio (HR) between the control and treatment arms by two types of baseline factors. Though both prognostic and predictive factors may confound the exposure‐driven E–R, they should not be treated as the same in case control analysis, which is discussed in the next section.
Effect of R on E and on the E–R relationship
As mentioned above, it is believed that treatment response or lack of it (disease modification or progression) changes CL and exposure over time (Figure 1c ) via affecting inflammation status and proteolytic capacity, which is manifested as time‐varying CL. 27 , 29 , 31 Consistently, a higher exposure was observed in the responders than that in nonresponders with chronic dosing. 29 , 31 The E–R relationship in this case is driven by treatment response, and thus is called response‐driven E–R. However, this relationship is often perceived as if exposure were the driver (Figure 1b ). Box S1 explains how this perception is formed mathematically. Of note, while exposure‐driven E–R is related to exposure itself, the response‐driven E–R is related to the change in exposure due to treatment response. It should also be noted that the interactions are circular: When CL is affected by R, E will be changed, leading to a loop from E to PD, to R, to CL and back to E which would repeat along with disease progression or modification during the treatment (Figure 1c ).
In summary, baseline‐driven E–R or response‐driven E–R can bias the apparent overall E–R relationship for efficacy of therapeutic mAbs. Given they often affect the exposure–efficacy relationship in the same direction, combination of the two would further exacerbate the bias.
Strategies to Mitigate the Confounding Effect
To decouple the confounding effect by baseline‐driven E–R or response‐driven E–R on the exposure‐driven E–R, several approaches have been used, and new approaches are emerging. These approaches along with their merits and limitations are summarized in Table 2 . Most of the reported approaches are landmark E–R analysis, in which exposure data at a certain fixed timepoint (the landmark time) are analyzed with matched response data. A few longitudinal analyses are also reported. While some approaches are used during the data analysis stage to address the confounding effect, others are deployed during the study design stage to tackle more fundamental issues caused by suboptimal designs, such as only one dose level studied, inadequate PK and baseline factor sampling schemes, lack of control group, and/or lack of alternative response end points. These approaches/strategies are discussed below based on the stage they can be deployed in—data analysis or study design.
Table 2.
Current and emerging approaches to address confounders of E–R interpretation in support of dose selection
| Stage | Purpose | Merits | Limitations | Comments | References | ||
|---|---|---|---|---|---|---|---|
| Landmark analysis | |||||||
| Using first dose exposure, C 1 | Data analysis | To mitigate response‐driven E–R |
Not affected by affected by time‐varying PK Rich PK data are more readily available in 1st cycle than steady‐state PK data |
C 1 may not reflect the exposure relevant to response with chronic dosing when there is a change in dosing regimen or treatment interruption (leading to change in relative ranking by exposure), or crossover between arms after disease progression. In such cases, the cumulative or average exposure may be considered more biologically relevant |
C p,SDPK may be an alternative. More examples and simulations are needed. |
25, 53 | |
| Identifying confounding baseline factors using of E–R data set | Data analysis | To mitigate baseline‐driven E–R | Enables case control and multivariable analysis | Does not account for hidden baseline confounding factors |
Can be done via PopPK analysis and graphical analysis of E–R data set Empirical approach |
5 | |
| Case control analysis | Data analysis | To mitigate baseline driven E–R |
Utilizes information in the control arm Allows to account for imbalance of prognostic factors across exposure subgroups |
Assumes all baseline factors act similarly between control and treatment arms May be affected by patient crossover Needs a large sample size for reasonable match Effectively reduces the sample size for E–R analysis Does not account for hidden baseline confounding factors |
Similar approach is used in observation studies The distinction between predictive factors and prognostic factors needs to be considered in postmatch analysis |
8, 16, 25, 48 | |
| Multivariable analysis | Data analysis | To mitigate baseline driven E–R |
May separate the contribution of exposure from baseline factors Compared with the case control, it does not reduce the sample size available for E–R |
May be confounded by the correlation between exposure and baseline factors when only one dose level is evaluated Often overparametrized for commonly available data sets difficult to account for interaction between various factors Hidden baseline confounding factors cannot be ruled out |
Needs to be combined with multiple dose level design Can be done in combination with case control of baseline factors |
7, 8, 12, 26, 50, 74, 79 | |
| Baseline CL as a surrogate marker for shared baseline factors | Data analysis | To mitigate baseline driven E–R |
May account for most unknown baseline factors Less prone to overparametrization compared with using multiple baseline factors |
Applies only when CL is not predominantly affected by BPK | Needs to be combined with multiple dose level design | 7, 8, 32, 37 | |
| Multiple dose levels with randomized design | Study design | To mitigate baseline driven E–R | Reduces the correlation between CL and exposure | High cost | The correlation between exposure and baseline CL is decreasing with the number of dose levels | 7, 8, 22, 26 | |
| Control arm | Study design | Account for the baseline factors | Data from control arm may be used to account for the baseline factors in E–R relationship | Crossover between arms may confound the analysis | Information is treatment agnostic and may be collected and used across different therapeutics | 8, 48, 49, 79 | |
| Disease‐driven catabolic signature as a marker for baseline CL | Data analysis & study design | To mitigate baseline‐driven E–R and to stratify population |
Unlike CL, it is a baseline prognostic factor and can be obtained prior to treatment May be used for patient stratification and selection May account for most hidden unknown baseline factors |
Not well understood | Emerging science, additional research is needed to identify the signature | Discussed in 8 | |
| Response end points: PD such as target engagement and tumor response | Data analysis & study design | To mitigate response‐driven E–R and baseline‐driven E–R |
Short‐term markers allowing flexible study design (crossover, multiple dose level, longitudinal data) Data could be pooled from multiple tumor types and dose escalation phase Allows to integrate clinical and nonclinical PK/PD to define target concentration at the site of action PD markers of target engagement may have less affected by baseline confounding factors with compared with long‐term efficacy end points. |
The link between PD biomarker and efficacy or safety may be difficult to establish and requires validation on independent data set Difference between blood circulation and tissue may create challenges |
Target engagement (when used as PD marker) is typically projected at the end of dosing interval | 53, 54, 55 | |
| Response end points: Change in CL from baseline (∆CL) | Data analysis & study design | To mitigate response‐ driven E–R |
Relatively short‐term end point Can be readily obtained with PopPK modeling |
Not validated with clinical data May not be applicable to all indications |
Lack of ∆CL over time upon treatment does not necessarily mean lack of treatment effect | 10, 29, 30, 32, 62 | |
| Longitudinal analysis | |||||||
| Longitudinal model without feedback back to PK: PK‐TGI ‐survival (or surrogate) | Data analysis & study design | To mitigate response‐driven E–R and baseline‐driven E–R | Captures the impact of the longitudinal exposure on the tumor response | Circular interaction between PK and disease is not fully accounted for without the feedback to PK | Mechanistic PK/PD modeling (i.e., accounting for disease‐driven effect on PK) is needed | ||
| Mechanistic longitudinal mode with feedback to PK | Data analysis & study design | To model circular interaction of exposure and disease | Mitigation of response‐driven and baseline driven E–R simultaneously in a dynamic setting | It may be challenging due to lack of sufficient data and proper methodology | More work is needed | 56, 57, 80, 81 | |
C 1, first cycle exposure metric; C p,SDPK, projected exposure based on single‐dose PK model (SDPK) at any time during repeated dosing; CL, clearance; E, exposure; PD, pharmacodynamic; PK, pharmacokinetic; PopPK, population pharmacokinetic; R, response; SoC, standard of care; TGI, tumor growth inhibition.
Data analysis
Using early exposure in E–R analysis
Steady‐state exposure, Css, matching the response end point after chronic treatment, has been a preferred exposure metric for landmark E–R analyses. However, when Css is affected by treatment response, using it in E–R analysis would confound the interpretation 25 which is the basis of response‐driven E–R. To minimize such a confounding effect, C 1 has been recently used in E–R analysis (see Table 1 ). In this case C 1 is a surrogate for C ss. The advantage of C 1 is that rich PK data from the first dose is more commonly available compared with the later time PK data. However, C 1 may not always be a good surrogate of later exposure, e.g., C 1 may not adequately account for the effect of later exposure on efficacy/safety response when it is different from C 1, especially when the relative ranking of exposure among the patients is changed during the study. 25 Specifically, a dose interruption/reduction due to adverse events or noncompliance, a planned regimen change in a subgroup during the study, or crossover between arms after disease progression (commonly seen in oncology trials) limits the utility of C 1 for E–R analysis. Alternatively, we propose that another exposure metric, the exposure projected for repeated dosing using single‐dose (or first‐dose) pharmacokinetic model, Cp ,SDPK, may be used in lieu of C 1. Like C 1, Cp ,SDPK is not expected to be affected by treatment response or disease progression and would be able to minimize the confounding effect of response‐driven E–R, as explained mathematically in Box S3 . Yet, unlike C 1, Cp ,SDPK can be a PK metric at any time during the study, including early stage, later stage, or the cumulative or average concentration during the study and can incorporate actual administered dosing information, which gives more flexibility to choose a metric relevant to a response end point.
However, neither C 1 nor Cp ,SDPK accounts for the circular interaction between exposure and disease. Modeling such a dynamic circular interaction requires a mechanistic PK/PD model that includes a feedback loop from disease status to PK (such as time‐dependent disease effect on CL in PopPK model) and from PK back to disease progression/modification (see Longitudinal Analysis in Table 2 ). Time variant disease‐related covariates on CL were used in PopPK model for durvalumab 32 and nivolumab, 29 but no effect from PK to disease was incorporated in these models, i.e., they are not mechanistic PK/PD models. Modeling the circular interactions requires serial PK sampling after first dose and multiple dosing along with serial data on disease factors and treatment response. Even when those data are available, modeling the circular interactions is still challenging due to the complexity of the interaction, limitation of the software, missing data, and nonrandom dropout in the data set commonly seen in oncology studies. It has been shown that informative censoring of the data due to nonrandom dropout could lead to biased estimation of parameters in a PK/PD model. 47
In summary, the confounding effect by the time‐varying clearance (response‐driven E–R) could be mitigated by using an early exposure metric in the landmark E–R analysis, though it does not account for the dynamic circular integration between disease status and PK.
Identify the confounding baseline factors
To decouple the confounding effect by baseline factors and characterize the E–R relationship appropriately, baseline factors, specifically B‐shared, need to be identified at first. Baseline factors that affect exposure can be identified by PopPK analysis and/or graphical analysis of an E–R data set based on their correlation with exposure. In the same manner, the factors that affect response can be found by graphical analysis of an E–R data set and/or univariable analysis of response. The intersection of two sets is B‐shared. This principle has been used by Baverel et al. in the evaluation of E–R for tremelimumab, an antibody against CTLA4. 5 Once shared baseline factors are identified, their confounding effect can be further addressed. Two approaches have been reported in landmark E–R analyses: (i) case control analysis, and (ii) multivariable analysis of data from multiple dose levels.
Case control analysis
Case control analysis has been used to account for baseline‐driven E–R when a control arm is available. This method has been widely used in epidemiological or observational studies to account for the effect of baseline factors. In the case control, subjects in the treatment arm are divided into subgroups based on drug exposure, and then a corresponding subgroup from the control arm is matched to each of the exposure subgroups based on the similarity of baseline factors with an assumption that matched baseline factors have similar effects on response in the two arms. Further analysis after matching is performed to examine the efficacy trend across exposure subgroups. For example, in the case control analysis for pembrolizumab for the E–R relationship, 8 patients from control groups were selected based on risk factors matching to those in pembrolizumab exposure subgroups (Q1 and Q4 subgroup). HR for overall survival (OS) was then calculated for each paired subgroup using Cox regression. Results show that the difference in HR between Q1 and Q4 is reduced by case control analysis. However, the difference did not disappear after matching, and the slope of HR vs. exposure appeared markedly steeper within‐dose compared with the one from pooled data across doses. The authors attributed this to hidden baseline factors that are not measured/accounted for in case‐control analysis. Similar conclusions were drawn in other E–R analyses using case control analysis. 16 , 25
There are several limitations with case control analysis. First, not all factors are measured or can be identified, i.e., some baseline factors may be “hidden.” Second, it requires a large sample size in order to have a reasonable match. The more factors that need to be matched, the larger the sample size would be required. Based on the framework, “B‐shared” represents the relevant factors and should be used in the matching. Including additional baseline factors on top of B‐shared may reduce the goodness of matching and make matching more complicated. Third, the assumption that all matched baseline factors have similar effects on response in the two arms needs to be carefully examined. While prognostic factors may have similar effects on disease progression regardless of treatment, predictive biomarkers are different 42 , 43 , 44 due to their interaction with treatment. For example, MET mutation 14 and PDL1 expression 45 , 46 are predictive factors for MET inhibitor and for anti‐PD1/PDL1 treatment, respectively. MET‐positive patients or high‐PDL1 expressors have shown to be associated with a shorter survival in chemotherapy but associated with a longer survival with MET inhibitor or anti‐PD1/PDL1 treatment compared with MET‐negative subjects or low‐PDL1 expressors. 14 , 45 , 46 Of note, some prognostic factors can also be predictive factors and are expected to have different effects to some degree between the treatment arm and the control arm. 42 , 43 , 44 Because prognostic factors have similar effects in two arms, matched prognostic factors should have a zero net effect on HR within paired subgroups, and across exposure subgroups even if they are imbalanced across them. In contrast, predictive factors would not have net zero effect on HR even if they are matched within paired subgroups. If a predictive biomarker is imbalanced by chance across exposure subgroups, especially in a relatively small efficacy study which is not randomized to a predictive biomarker, its effect on HR across exposure subgroups could be falsely attributed to exposure, leading to an apparent E–R relationship. The distinction between prognostic and predictive biomarkers, if confirmed by real data, may also partially explain the reported failure of case control analysis to fully account for the confounding effect, in addition to the unaccounted confounding effect of potential hidden baseline factors. 8 , 16 , 25 So far, the implication of this distinction in case control analysis is mostly overlooked in the literature. 8 , 25 , 48 To address this limitation, postmatch analysis, such as examining the response trend across matched exposure groups, should consider inclusion of predictive markers as covariates. In anti‐PD1/PDL1 case control analysis, including PDL1 in post‐match Cox regression as a covariate may further improve concordance between the E–R within dose and that across doses.
Multivariable analysis
Multivariable analysis including exposure and baseline factors has been used in landmark E–R analysis to account for the confounding effect of baseline factors on E–R relationship and decouple the baseline‐driven E–R from exposure‐driven E–R (Table 1 ). Univariable E–R analysis (with exposure as the only independent variable) was shown to result in a steeper E–R slope compared with multivariable models (Table 1 ) because potential effects by other baseline factors may be falsely attributed to exposure in a univariable model. Examples of multivariable exposure–response analysis using data from multiple dose levels include pembrolizumab, 8 nivolumab, 7 and bintrafusp alfa. 26
Study design
Part of the challenge in mitigating the confounding effect is lack of an appropriate data set due to inadequate study design in oncology trials. In order to have meaningful multivariable or case‐ controlled E–R analysis, there are several requirements in study design related to dose, PK data and baseline factor data, control arm, and response end points.
Multiple dose levels
As shown for the nivolumab example (Figure 2 ), the E–R slopes obtained with data from the single dose level are much steeper than the one estimated from the multiple dose levels. 7 When only one dose is studied, baseline factors and exposure are highly correlated, and their effects cannot be decoupled. 12 This is because baseline factors affect CL, and CL is highly correlated with exposure at one dose level. Therefore, ideally data should be collected from a prospective study with multiple randomized dose levels and analyzed using multivariable E–R analysis.
Figure 2.
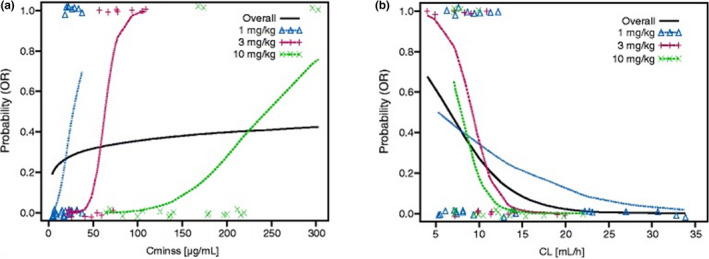
Nivolumab data from multiple dose levels for (a) exposure–efficacy relationship and (b) clearance‐efficacy relationship. Figures adapted from Agrawal et al. 7 and are distributed under the terms of the Creative Commons Attribution 4.0 International License (http://creativecommons.org/licenses/by/4.0/).
With a sufficiently large sample size and multiple dose groups, randomization is expected to lead to balanced distribution of baseline CL across dose groups. The great number of dose levels are studied, the more likely it is to reduce the correlation between exposure and baseline CL and to separate the effects of baseline CL and exposure, and thus more accurately the exposure‐driven E–R can be estimated. 7 , 8 , 22 , 26 However, there is a high cost associated with studying a large number of dose levels. It has been shown with pembrolizumab and bintrafusp alfa that E–R data from at least two dose levels was helpful to decouple the above correlation and support dosing decision. 8 , 26 Simulation should be able to facilitate selecting the appropriate number of dose levels as well as the dose range and space for a specific therapeutic agent.
Control arm
Control arm can provide valuable information on study population in terms of prognostic factors which can be used in case control analysis as described above. 8 , 48 Since prognostic factors are drug‐independent, their effect on CL and on response may be estimated using data from the control arm within a study, across multiple clinical studies, or even from real‐world data. This information can then be used for another therapeutic mAb in the same patient population, analogous to drug‐independent PK parameters in physiologically‐based PK models. However, crossover from control arm to the treatment arm may confound the long‐term survival end points. 49
Data collection for PK, baseline factors, and baseline CL
As mentioned previously, an appropriate PK sampling schedule after the first dose and repeated dosing is needed to evaluate the presence of response‐driven E–R (or time‐varying PK). If the treatment duration is too short or insufficient PK samples are collected, the time‐varying PK may not be identifiable. Similarly, adequate serial data on disease factors and treatment response are also required for longitudinal PK/PD modeling.
A common limitation for clinical data is that some baseline factors may not be measured or identifiable. In this case, baseline CL may be used as a surrogate for shared baseline factors given the high correlation between them. 7 , 50 The caveat is that baseline CL should not be predominantly affected by B‐PK. It should be noted that inability to identify time‐varying CL or shared baseline factors does not mean they do not exist, but it does mean that the ability to mitigate the confounding effect would be hindered.
Response end points
PD end point
Commonly available oncology efficacy end points include objective response rate (ORR), progression‐free survival, and OS. It is reported that the correlation between ORR and OS is moderate. 51 This may be related to the pseudo progression at the early phase of the treatment and the delayed benefit of immune response on survival on top of tumor shrinkage. 52 Therefore, it is plausible that OS may be more prone to the immune‐related baseline factors than ORR.
One obvious downside of evaluating a long‐term efficacy end point such as OS at multiple dose levels is the long duration and the associated high cost. Alternatively, a short‐term PD marker (including target engagement and tumor response, see Table 2 ) may be considered as a response end point in landmark analysis for early dosing decision. 53 , 54 , 55
Rich PK/PD data can be collected at multiple dose levels within a subject in either a fixed sequence or crossover design over a relatively short time period. With a rich data set collected under such design, the effect by baseline and treatment effect can be accounted for and the baseline‐driven E–R and response‐driven E–R can be mitigated. However, a link between short‐term PD and long‐term efficacy needs to be established. For example, tumor size end points from tumor growth inhibition (TGI) model was used to link exposure and OS in exposure‐TGI‐OS models in an attempt to resolve the confounding effect by baseline prognostic disease marker. 56 , 57 , 58 The association between survival and a short‐term end point such as response rate 59 , 60 , 61 or TGI 58 has been shown in some indications, but more work needs to be done in this direction.
Change in CL from baseline
In addition to PD end point, change in CL from baseline (∆CL) may also be considered as a surrogate end point for treatment effect. While baseline CL has been shown to be correlated to patient survival in immuno‐oncology settings 5 , 7 , 8 , 26 and can be incorporated as baseline covariate for E–R analysis, ∆CL over time has also been shown to be associated with disease improvement and/or survival after treatment with checkpoint inhibitors such as atezolizumab, 10 nivolumab, 29 , 62 durvalumab, 32 and pembrolizumab. 30 Therefore, ∆CL could be a potential surrogate end point for treatment effect. The magnitude of ∆CL could vary for different baseline disease conditions or specific populations. For example, significant ∆CL for nivolumab was observed for patients with poor disease status and higher baseline CL. 62 In contrast, in the same study, CL was time‐invariant in patients whose tumors were removed by surgical resection. 62 On the other hand, lack of ∆CL over time upon treatment does not necessarily mean lack of treatment effect at the subject level. For a study with no change in mean CL (mean ∆CL = 0), an increase in CL in some subjects (the responders) may be negated by a decrease in others (nonresponders). For a subject with stable disease, the treatment effect on CL may be negated by disease progression. Lastly, PopPK analysis estimated that 50% ∆CL occurred ~ 60 days after the first dose of anti‐PDL1 or anti‐PD1 mAbs, 10 , 29 making ∆CL an early response end point compared with survival. Given that longitudinal PK data are commonly collected, ∆CL can be readily estimated and may be supplementary to survival or tumor size. Thus, ∆CL may be explored as a potential surrogate marker for treatment effect in some indications for dosing decision, but further exploration is needed in clinical studies.
Recommended roadmap to identify the exposure‐driven E–R relationship
Given that various approaches have been developed and can be used at different stages and for different purposes, it can be confusing to choose the right one. Here we propose a practical roadmap to find an appropriate strategy for minimizing various confounding effects and identifying a true E–R relationship for therapeutic mAbs (Figure 3 ). First, if the PK data are sufficient, the presence of a response‐driven E–R can be investigated by checking whether time‐varying CL exists in the overall population or in any exposure subgroups, then a relevant exposure metric, C 1, C p,SDPK, or C ss, should be chosen based on existence of response‐driven E–R or lack of it for further E–R analysis. If PK data are inadequate to identify the time‐varying CL, using either C 1 or C p,SDPK could be a conservative approach in addressing a potential response‐driven E–R. Second, if data allow, shared baseline factors between PK and response should be identified. Baseline‐driven E–R may be accounted for using the shared baseline factors by either multivariable analysis with data from multiple dose levels or by case control analysis with data from a control group. If data do not allow the identification of shared baseline factors, baseline CL may be used as a surrogate for shared baseline factors provided it is not predominately affected by B‐PK. If no long‐term efficacy is studied at multiple dose levels, rich short‐term PD data from multiple dose levels can be used as a surrogate for efficacy in cases where the link between PD and efficacy variables can be established. Similarly, ∆CL after treatment, if it exists, may also be explored as a surrogate for efficacy response in the context of PK/PD analysis. In addition to the above landmark analyses, a longitudinal model with or without a mechanistic feedback from response to exposure may be explored (Table 2 ).
Figure 3.
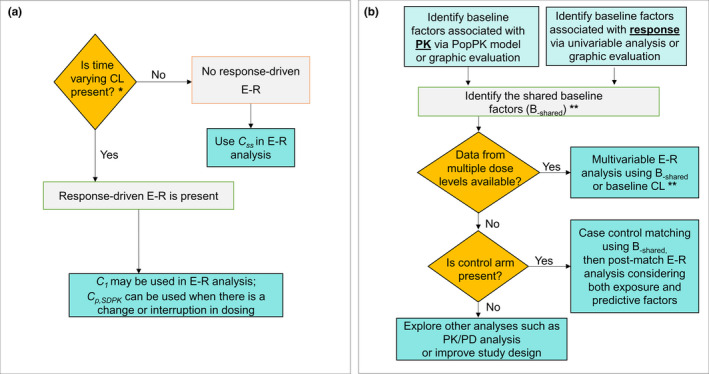
Recommended roadmap to identify the true E–R relationship. (a) Minimizing response‐driven E–R: Response‐driven E–R can be identified by checking whether there is time‐varying CL (clearance). If response‐driven E–R is present in overall population or in any exposure subgroups, C p,SDPK should be used for E–R analysis to account for dose interruptions / change in a subgroup. C 1 can also be used in lieu of C p,SDPK, if appropriate. If response‐driven E–R can be ruled out, Css can be used for E–R. *If PK data are inadequate to identify the time‐varying CL, using either C 1 or C p,SDPK could be a conservative approach in addressing potential response‐driven E–R. (b) Accounting for baseline‐driven E–R: Baseline‐driven E–R can be accounted for by case control analysis and/or multivariable analysis using B‐shared or other methods (see Table 2 ). **If data do not allow the identification of shared baseline factors, baseline CL may be used as a surrogate for shared baseline factors. C 1, first‐dose exposure; C p,SDPK, projected exposure based on single‐dose PK model (SDPK) at any time during repeated dosing; Css, steady‐state exposure; E–R, exposure–response; PK, pharmacokinetic; PK/PD, pharmacokinetic/pharmacodynamic; PopPK, population pharmacokinetic. [Colour figure can be viewed at wileyonlinelibrary.com]
It should be noted that the feasibility of each method and its effectiveness are highly dependent on study designs and available data sets. More attention is needed for proper study design in oncology trials to aid E–R analysis for dose selection. Another challenge is to assess the effectiveness of each method and whether confounding effects have been successfully mitigated. Examining the concordance between the E–R relationship and dose–response relationship, or the agreement between the within‐dose E–R relationship vs. the one obtained using pooled data across doses, has been used for this purpose, 7 , 8 which requires data from at least two dose levels. Lack of concordance suggests that either baseline‐driven E–R or response‐driven E–R is not fully accounted for.
Each approach for E–R analysis has its own limitation. Even if all above approaches are applied, the potential confounding effect may not be fully mitigated due to the complexity of the model and limitations of the data set or study design. Therefore, a holistic approach is needed to consider the totality of evidence and has been proven to be useful in dose selection. 26 , 53 The approach takes into consideration various types of data, including the target exposures associated with a full PD effect in blood circulation and/or target tissue from preclinical studies, clinical PK/PD data, projection of tissue exposures in tumors, tumor kinetics, safety profile, historical data, real‐world data, dose–response relationship, and E–R relationship.
Future Directions
The framework shown In Figure 1 is built upon review of the literature including reports of clinical data and simulations. 35 More simulations and/or clinical studies would further substantiate the framework predictions and help to illustrate the framework's potential applications including finding novel approaches to mitigate the confounding effects. The framework is intended to provide a snapshot of the interplay among E, R, and B. In future, a more complex model can be built to describe the dynamic interdependencies between these three variables. However, such a complex model may likely be overparametrized for the data commonly available in clinical studies. Therefore, future work that enables longitudinal circular modeling is needed.
Future work is also needed to identify “hidden” baseline factors in order to fully account for the effect of baseline factors in E–R analysis and for potential patient stratification/selection. According to the proposed framework, all baseline factors that affect the E–R relationship are expected to affect CL. Thus, baseline CL or a biomarker signature representing baseline CL may be useful to address the hidden factors. To this end, cachexia score is being considered as a candidate biomarker, because it is related to inherent catabolic capacity and is also a prognostic factor for efficacy. Several standardized cachexia scoring systems have been developed, including CASCO (cachexia score), which consists of laboratory tests, physician evaluation, and patient questionnaires. 40 However, these scoring systems remain to be validated. More investigation is needed to identify other novel biomarkers or disease‐driven catabolic signature for cachexia and cancer‐associated changes in protein catabolism. Such a signature, once available, may be used to identify poor responders and aid clinical trial designs in terms of patient stratification or inclusion/exclusion criteria.
It is also noted that, while the focus of review is for immuno‐oncology, the phenomenon of confounded E–R relationships was also observed with other mAbs in inflammation therapeutic area (including rheumatoid arthritis and inflammatory bowel disease). In addition, apparent E–R relationships were observed for several small‐molecule drugs for oncology or inflammatory indications such as axitinib, sunitinib, pazopanib, and osimertinib, and the impact of disease condition on exposure of these small‐molecule drugs has been mentioned in the literature. 63 , 64 , 65 , 66 , 67 , 68 Whether the framework can be expanded to small molecules and how their E–R relationships may be affected need further investigation.
Conclusions
Complex E–R relationship have been observed with therapeutic mAbs, in particular, for oncology, immuno‐oncology, and immune disorders due to the confounding effect by various baseline factors and disease progression and modification, which creates challenges in E–R analysis for dose selection. We review the current learnings in the field and propose a general framework to integrate various elements involved in the E–R relationship: exposure, response, and disease‐related baseline factors that affect both PK and treatment response. Various approaches that mitigate the confounding effects of baseline factors (baseline‐driven E–R) and time‐varying CL (response‐driven E–R), as well as their merits and limitations related to study designs and data sets, are reviewed and discussed. A roadmap is proposed to select relevant approaches to characterize E–R relationship. Specifically, exposure metrics based on a single‐dose PK model can be used to mitigate response‐driven E–R, while multivariable analysis and/or case control analysis can be used to account for baseline‐driven E–R. However, due to the complexity of the issue, more work is needed to further improve existing approaches and find new ones.
The proposed framework and roadmap highlight (i) the importance of conducting E–R analyses using data from multiple dose levels, and (ii) the role of predictive/prognostic biomarkers in dose selection and optimization, and the need to consider them in conjunction with drug exposure for selecting the right dose and the right population, the two key goals in drug development.
Funding information
No funding was received for this work.
Conflict of Interest
H.I.D., Y.V., and N.M. are employees of EMD Serono. Y.V. has patent applications with EMD Serono.
Supporting information
Box S1‐S3
Acknowledgments
The authors would like to thank Dietmar Gross, Alain Munafo, Pascal Girard, and Ping Hu for their insightful feedback and suggestions during development of this manuscript, and especially thank the journal’s reviewers for their thoughtful comments towards improving the manuscript.
References
- 1. Ji, Y. , Jin, J.Y. , Hyman, D.M. , Kim, G. & Suri, A. Challenges and opportunities in dose finding in oncology and immuno‐oncology. Clin. Transl. Sci. 11, 345–351 (2018). [DOI] [PMC free article] [PubMed] [Google Scholar]
- 2. European Medicines Agency . Dose–response information to support drug registration E4: ICH Harmonised Tripartite Guidelines <https://www.ema.europa.eu/en/documents/scientific‐guideline/ich‐e‐4‐dose‐response‐information‐support‐drug‐registration‐step‐5_en.pdf> (1994).
- 3. US Food and Drug Administration . Guidance for industry: exposure–response relationships‐study design, data analysis, and regulatory applications <https://www.fda.gov/media/71277/download> (2003).
- 4. Bajaj, G. , Gupta, M. , Feng, Y. , Statkevich, P. & Roy, A. Exposure–response analysis of nivolumab in patients with previously treated or untreated advanced melanoma. J. Clin. Pharmacol. 57, 1527–1533 (2017). [DOI] [PMC free article] [PubMed] [Google Scholar]
- 5. Baverel, P. et al Exposure–response analysis of overall survival for tremelimumab in unresectable malignant mesothelioma: the confounding effect of disease status. Clin. Transl. Sci. 12, 450–458 (2019). [DOI] [PMC free article] [PubMed] [Google Scholar]
- 6. Cohn, A.L. et al Exposure–response relationship of ramucirumab in patients with advanced second‐line colorectal cancer: exploratory analysis of the RAISE trial. Cancer Chemother. Pharmacol. 80, 599–608 (2017). [DOI] [PMC free article] [PubMed] [Google Scholar]
- 7. Agrawal, S. , Feng, Y. , Roy, A. , Kollia, G. & Lestini, B. Nivolumab dose selection: challenges, opportunities and lessons learned for cancer immunotherapy. J. Immunother. Cancer 4, 72 (2016). [DOI] [PMC free article] [PubMed] [Google Scholar]
- 8. Turner, D.C. et al Pembrolizumab exposure–response assessments challenged by association of cancer cachexia and catabolic clearance. Clin. Cancer Res. 24, 5841–5849 (2018). [DOI] [PubMed] [Google Scholar]
- 9. Chen, S.‐C. et al Population pharmacokinetics and exposure–response of trastuzumab emtansine in advanced breast cancer previously treated with ≥2 HER2‐targeted regimens. Br. J. Clin. Pharmacol. 83, 2767–2777 (2017). [DOI] [PMC free article] [PubMed] [Google Scholar]
- 10. Center for Drug Evaluation and Research , US Food and Drug Administration . Clinical pharmacology and biopharmaceutics review 761041Orig1s000 <https://www.accessdata.fda.gov/drugsatfda_docs/nda/2016/761041Orig1s000ClinPharmR.pdf> (2016).
- 11. Center for Drug Evaluation and Research, US Food and Drug Administration . Multi‐discipline review 761049Orig1s000 <https://www.accessdata.fda.gov/drugsatfda_docs/nda/2017/761049Orig1s000MultidisciplineR.pdf> (2016).
- 12. Vugmeyster, Y. et al Exposure‐response analysis of avelumab in patients with advanced urothelial carcinoma via a full‐model approach. Ninth American Conference on Pharmacometrics, San Diego, CA October 7–10, 2018. Abstract W‐088. [Google Scholar]
- 13. Feng, Y. , Roy, A. , Masson, E. , Chen, T.‐T. , Humphrey, R. & Weber, J.S. Exposure–response relationships of the efficacy and safety of ipilimumab in patients with advanced melanoma. Clin. Cancer Res. 19, 3977–3986 (2013). [DOI] [PubMed] [Google Scholar]
- 14. Zhu, M. et al Exposure–response analysis of rilotumumab in gastric cancer: the role of tumour MET expression. Br. J. Cancer 112, 429–437 (2015). [DOI] [PMC free article] [PubMed] [Google Scholar]
- 15. Doshi, S. et al Rilotumumab exposure–response relationship in patients with advanced or metastatic gastric cancer. Clin. Cancer Res. 21, 2453–2461 (2015). [DOI] [PubMed] [Google Scholar]
- 16. Yang, J. et al The combination of exposure–response and case‐control analyses in regulatory decision making. J. Clin. Pharmacol. 53, 160–166 (2013). [DOI] [PubMed] [Google Scholar]
- 17. Gibiansky, E. , Gibiansky, L. , Carlile, D. , Jamois, C. , Buchheit, V. & Frey, N. Population pharmacokinetics of obinutuzumab (GA101) in chronic lymphocytic leukemia (CLL) and non‐Hodgkin's lymphoma and exposure–response in CLL. CPT Pharmacometrics Syst. Pharmacol. 3, 1–11 (2014). [DOI] [PMC free article] [PubMed] [Google Scholar]
- 18. Adedokun, O.J. et al Association between serum concentration of infliximab and efficacy in adult patients with ulcerative colitis. Gastroenterology 147, 1296–1307.e5 (2014). [DOI] [PubMed] [Google Scholar]
- 19. Wang, E. , Kang, D. , Bae, K.‐S. , Marshall, M.A. , Pavlov, D. & Parivar, K. Population pharmacokinetic and pharmacodynamic analysis of tremelimumab in patients with metastatic melanoma. J. Clin. Pharmacol. 54, 1108–1116 (2014). [DOI] [PubMed] [Google Scholar]
- 20. Maio, M. et al Tremelimumab as second‐line or third‐line treatment in relapsed malignant mesothelioma (DETERMINE): a multicentre, international, randomised, double‐blind, placebo‐controlled phase 2b trial. Lancet Oncol. 18, 1261–1273 (2017). [DOI] [PubMed] [Google Scholar]
- 21. Shah, M.A. et al HELOISE: Phase IIIb randomized multicenter study comparing standard‐of‐care and higher‐dose trastuzumab regimens combined with chemotherapy as first‐line therapy in patients with human epidermal growth factor receptor 2‐positive metastatic gastric or gastroesophageal junction adenocarcinoma. J. Clin. Oncol. 35, 2558–2567 (2017). [DOI] [PubMed] [Google Scholar]
- 22. Basak, E.A. et al Correlation between nivolumab exposure and treatment outcomes in non–small‐cell lung cancer. Eur J Cancer 109, 12–20 (2019). [DOI] [PubMed] [Google Scholar]
- 23. Badawi, M., Cross, C.C. & Phelps, M.A. Letter to the Editor: Exposure–response or clearance–response relationship in immune checkpoint therapy?—A comment on ‘correlation between nivolumab exposure and treatment outcomes in non‐small‐cell lung cancer’ by Basak et al. Eur. J. Cancer 114, 25–26 (2019). [DOI] [PubMed] [Google Scholar]
- 24. Hurkmans, D.P. et al A prospective cohort study on the pharmacokinetics of nivolumab in metastatic non‐small cell lung cancer, melanoma, and renal cell cancer patients. J. Immunother. Cancer 7, 192 (2019). [DOI] [PMC free article] [PubMed] [Google Scholar]
- 25. Wang, Y. , Booth, B. , Rahman, A. , Kim, G. , Huang, S.M. & Zineh, I. Toward greater insights on pharmacokinetics and exposure–response relationships for therapeutic biologics in oncology drug development. Clin. Pharmacol. Ther. 101, 582–584 (2017). [DOI] [PubMed] [Google Scholar]
- 26. Vugmeyster, Y. et al Selection of the recommended phase 2 dose for Bintrafusp Alfa, a bifunctional fusion protein targeting TGF‐beta and PD‐L1. Clin. Pharmacol. Ther. (2020). https://doi.org/ 10.1002/cpt.776. [DOI] [PMC free article] [PubMed] [Google Scholar]
- 27. Porporato, P.E. Understanding cachexia as a cancer metabolism syndrome. Oncogenesis 5, e200 (2016). [DOI] [PMC free article] [PubMed] [Google Scholar]
- 28. Lelbach, A. , Muzes, G. & Feher, J. Current perspectives of catabolic mediators of cancer cachexia. Med. Sci. Monit. 13 , RA168–RA173 (2007). [PubMed] [Google Scholar]
- 29. Liu, C. et al Association of time‐varying clearance of nivolumab with disease dynamics and its implications on exposure response analysis. Clin. Pharmacol. Ther. 101, 657–666 (2017). [DOI] [PubMed] [Google Scholar]
- 30. Li, H. et al Time dependent pharmacokinetics of pembrolizumab in patients with solid tumor and its correlation with best overall response. J. Pharmacokinet. Pharmacodyn. 44, 403–414 (2017). [DOI] [PubMed] [Google Scholar]
- 31. Wilkins, J.J. et al Time‐varying clearance and impact of disease state on the pharmacokinetics of avelumab in merkel cell carcinoma and urothelial carcinoma. CPT Pharmacometrics Syst. Pharmacol. 8, 415–427 (2019). [DOI] [PMC free article] [PubMed] [Google Scholar]
- 32. Baverel, P.G. et al Population pharmacokinetics of durvalumab in cancer patients and association with longitudinal biomarkers of disease status. Clin. Pharmacol. Ther. 103, 631–642 (2018). [DOI] [PMC free article] [PubMed] [Google Scholar]
- 33. Center for Drug Evaluation and Research, US Food and Drug Administration . Multi‐discipline review 761097Orig1s000 <https://www.accessdata.fda.gov/drugsatfda_docs/nda/2018/761097Orig1s000MultidisciplineR.pdf> (2018).
- 34. Center for Drug Evaluation and Research, US Food and Drug Administration . Clinical Pharmacology and Biopharmaceutics Review 761034Orig1s000 <https://www.accessdata.fda.gov/drugsatfda_docs/nda/2016/761034Orig1s000ClinPharmR.pdf> (2016).
- 35. Li, R.‐J. , Liu, C. & Wang, Y. Time‐varying clearance of therapeutic monoclonal antibody in inflammatory bowel diseases: association with disease dynamics and implication on exposure response analysis. Ninth American Conference on Pharmacometrics, San Diego, CA October 7–10, 2018. Abstract W‐018.
- 36. Bajaj, G. , Wang, X. , Agrawal, S. , Gupta, M. , Roy, A. & Feng, Y. Model‐based population pharmacokinetic analysis of nivolumab in patients with solid tumors. CPT Pharmacometrics Syst. Pharmacol. 6, 58–66 (2017). [DOI] [PMC free article] [PubMed] [Google Scholar]
- 37. Wang, X. et al Quantitative characterization of the exposure–response relationship for cancer immunotherapy: a case study of nivolumab in patients with advanced melanoma. CPT Pharmacometrics Syst. Pharmacol. 6, 40–48 (2017). [DOI] [PMC free article] [PubMed] [Google Scholar]
- 38. Center for Drug Evaluation and Research, US Food and Drug Administration . Clinical Pharmacology and Biopharmaceutics review 761069Orig1s000 <https://www.accessdata.fda.gov/drugsatfda_docs/nda/2017/761069Orig1s000ClinPharmR.pdf> (2016).
- 39. Wilkins, J.J. et al Exposure‐response analyses of the bifunctional fusion protein bintrafusp alfa (M7824) in early drug development. Twenty‐eighth Population Approach Group in Europe (PAGE) meeting, Stockholm, Sweden, June 11–14, 2019. Abstract 9086.
- 40. Argilés, J.M. , López‐Soriano, F.J. , Toledo, M. , Betancourt, A. , Serpe, R. & Busquets, S. The cachexia score (CASCO): a new tool for staging cachectic cancer patients. J. Cachexia Sarcopenia Muscle 2, 87–93 (2011). [DOI] [PMC free article] [PubMed] [Google Scholar]
- 41. Wilkins, J.J. , Vugmeyster, Y. , Dussault, I. , Girard, P. & Khandelwal, A. Population pharmacokinetic analysis of bintrafusp alfa in different cancer types. Adv. Ther. 36, 2414–2433 (2019). [DOI] [PubMed] [Google Scholar]
- 42. Adolfsson, J. & Steineck, G. Prognostic and treatment‐predictive factors—is there a difference? Prostate Cancer Prostatic Dis. 3, 265–268 (2000). [DOI] [PubMed] [Google Scholar]
- 43. Clark, G.M. Prognostic factors versus predictive factors: examples from a clinical trial of erlotinib. Mol. Oncol. 1, 406–412 (2008). [DOI] [PMC free article] [PubMed] [Google Scholar]
- 44. Bundred, N. Prognostic and predictive factors in breast cancer. Cancer Treat. Rev. 27, 137–142 (2001). [DOI] [PubMed] [Google Scholar]
- 45. Aguiar Jr, P.N. , De Mello, R.A. , Hall, P. , Tadokoro, H. & de Lima Lopes, G. PD‐L1 expression as a predictive biomarker in advanced non‐small‐cell lung cancer: updated survival data. Immunotherapy 9, 499–506 (2017). [DOI] [PubMed] [Google Scholar]
- 46. Vrankar, M. , Zwitter, M. , Kern, I. & Stanic, K. PD‐L1 expression can be regarded as prognostic factor for survival of non‐small cell lung cancer patients after chemoradiotherapy. Neoplasma 65, 140–146 (2018). [DOI] [PubMed] [Google Scholar]
- 47. Johansson, Å.M. Methodology for handling missing data in nonlinear mixed effects modelling. Acta Universitatis Upsaliensis <http://uu.diva‐portal.org/smash/get/diva2:715330/FULLTEXT01.pdf> (2014). [Google Scholar]
- 48. Wilbur, J.D. , Gupta, M. , Passey, C. & Roy, A. Evaluating effectiveness of case‐matching for exposure–response analysis. Twenty‐fifth Population Approach Group in Europe (PAGE) meeting, Lisbon, Portugal, June 7–10, 2016. Abstract 5982.
- 49. Morden, J.P. , Lambert, P.C. , Latimer, N. , Abrams, K.R. & Wailoo, A.J. Assessing methods for dealing with treatment switching in randomised controlled trials: a simulation study. BMC Med. Res. Methodol. 11, 4 (2011). [DOI] [PMC free article] [PubMed] [Google Scholar]
- 50. Feng, Y. et al Nivolumab exposure–response analyses of efficacy and safety in previously treated squamous or nonsquamous non–small cell lung cancer. Clin. Cancer Res. 23, 5394–5405 (2017). [DOI] [PubMed] [Google Scholar]
- 51. Buyse, M. , Burzykowski, T. & Saad, E.D. The search for surrogate endpoints for immunotherapy trials. Ann. Transl. Med. 6, 231 (2018). [DOI] [PMC free article] [PubMed] [Google Scholar]
- 52. Mushti, S.L. , Mulkey, F. & Sridhara, R. Evaluation of overall response rate and progression‐free survival as potential surrogate endpoints for overall survival in immunotherapy trials. Clin. Cancer Res. 24, 2268–2275 (2018). [DOI] [PubMed] [Google Scholar]
- 53. Roy, A. Translational and Clinical Pharmacology Perspectives of Cancer Immunotherapy [presentation]. Annual Meeting of American Society for Clinical Pharmacology & Therapeutics (ASCPT) Annual Meeting, Washington DC, March 13–16, 2019.
- 54. Stroh, M. et al Clinical pharmacokinetics and pharmacodynamics of atezolizumab in metastatic urothelial carcinoma. Clin. Pharmacol. Ther. 102, 305–312 (2017). [DOI] [PubMed] [Google Scholar]
- 55. Hua, F. , Lin, L. , Gruenbaum, L. , Millard, B.L. , Burke, J.M. & Apgar, J.F. Inferring target occupancy from fitting nonlinear‐PK data with mechanistic PKRO model for Pembrolizumab. American Association for Cancer Research (AACR) Annual Meeting, Atlanta, GA, March 29–April 3, 2019. Abstract 4126.
- 56. Bruno, R. , Mercier, F. & Claret, L. Evaluation of tumor size response metrics to predict survival in oncology clinical trials. Clin. Pharmacol. Ther. 95, 386–393 (2014). [DOI] [PubMed] [Google Scholar]
- 57. Han, K. et al Exposure–response and tumor growth inhibition analyses of the monovalent anti‐c‐MET antibody onartuzumab (MetMAb) in the second‐ and third‐line non‐small cell lung cancer. AAPS J. 19, 527–533 (2017). [DOI] [PubMed] [Google Scholar]
- 58. Bruno, R. et al Progress and opportunities to advance clinical cancer therapeutics using tumor dynamic models. Clin. Cancer Res. 26, 1787–1795 (2020). [DOI] [PMC free article] [PubMed] [Google Scholar]
- 59. Mangal, N. , Salem, A.H. , Li, M. , Menon, R. & Freise, K.J. Relationship between response rates and median progression‐free survival in non‐Hodgkin's lymphoma: a meta‐analysis of published clinical trials. Hematol. Oncol. 36, 37–43 (2018). [DOI] [PubMed] [Google Scholar]
- 60. Agarwal, S.K. , Mangal, N. , Menon, R.M. , Freise, K.J. & Salem, A.H. Response rates as predictors of overall survival: a meta‐analysis of acute myeloid leukemia trials. J. Cancer 8, 1562–1567 (2017). [DOI] [PMC free article] [PubMed] [Google Scholar]
- 61. Mangal, N. , Salem, A.H. , Menon, R.M. & Freise, K.J. Use of depth of response to predict progression‐free survival in relapsed or refractory multiple myeloma: Evaluation of results from 102 clinical trials. Hematol. Oncol. 36, 547–553 (2018). [DOI] [PubMed] [Google Scholar]
- 62. Hamuro, L. , Statkevich, P. , Bello, A. , Roy, A. & Bajaj, G. Nivolumab clearance is stationary in patients with resected melanoma on adjuvant therapy: implications of disease status on time‐varying clearance. Clin. Pharmacol. Ther. 106, 1018–1027 (2019) . [DOI] [PubMed] [Google Scholar]
- 63. Rini, B.I. et al Axitinib in metastatic renal cell carcinoma: results of a pharmacokinetic and pharmacodynamic analysis. J. Clin. Pharmacol. 53, 491–504 (2013). [DOI] [PMC free article] [PubMed] [Google Scholar]
- 64. Houk, B.E. , Bello, C.L. , Poland, B. , Rosen, L.S. , Demetri, G.D. & Motzer, R.J. Relationship between exposure to sunitinib and efficacy and tolerability endpoints in patients with cancer: results of a pharmacokinetic/pharmacodynamic meta‐analysis. Cancer Chemother. Pharmacol. 66, 357–371 (2010). [DOI] [PubMed] [Google Scholar]
- 65. Teo, Y.L. et al Association of drug exposure with toxicity and clinical response in metastatic renal cell carcinoma patients receiving an attenuated dosing regimen of sunitinib. Target Oncol. 10, 429–437 (2015). [DOI] [PubMed] [Google Scholar]
- 66. Sternberg, C.N. et al Pazopanib exposure relationship with clinical efficacy and safety in the adjuvant treatment of advanced renal cell carcinoma. Clin. Cancer Res. 24, 3005–3013 (2018). [DOI] [PMC free article] [PubMed] [Google Scholar]
- 67. Brown, K. et al Population pharmacokinetics and exposure‐response of osimertinib in patients with non‐small cell lung cancer. Br. J. Clin. Pharmacol. 83, 1216–1226 (2017). [DOI] [PMC free article] [PubMed] [Google Scholar]
- 68. Kacevska, M. , Robertson, G.R. , Clarke, S.J. & Liddle, C. Inflammation and CYP3A4‐mediated drug metabolism in advanced cancer: impact and implications for chemotherapeutic drug dosing. Expert Opin. Drug Metab. Toxicol. 4, 137–149 (2008). [DOI] [PubMed] [Google Scholar]
- 69. Center for Drug Evaluation and Research, US Food and Drug Administration . Clinical Pharmacology and Biopharmaceutics Review 125527Orig1s000 <https://www.accessdata.fda.gov/drugsatfda_docs/nda/2015/125527Orig1s000ClinPharmR.pdf> (2015).
- 70. Center for Drug Evaluation and Research, US Food and Drug Administration . Clinical Pharmacology and Biopharmaceutics Review 125554Orig1s000 <https://www.accessdata.fda.gov/drugsatfda_docs/nda/2014/125554Orig1s000ClinPharmR.pdf> (2014).
- 71. Center for Drug Evaluation and Research, US Food and Drug Administration . Clinical Pharmacology and Biopharmaceutics Review 125514Orig1s000 <https://www.accessdata.fda.gov/drugsatfda_docs/nda/2014/125514Orig1s000ClinPharmR.pdf> (2014).
- 72. Morrissey, K.M. et al Alternative dosing regimens for atezolizumab: an example of model‐informed drug development in the postmarketing setting. Cancer Chemother. Pharmacol. 84, 1257–1267 (2019). [DOI] [PMC free article] [PubMed] [Google Scholar]
- 73. Center for Drug Evaluation and Research, US Food and Drug Administration . Multi‐discipline review 761078Orig1s000 <https://www.accessdata.fda.gov/drugsatfda_docs/nda/2017/761078Orig1s000MultidisciplineR.pdf> (2016).
- 74. Jin, C. et al Exposure‐efficacy and safety analysis of durvalumab in patients with urothelial carcinoma (UC) and other solid tumors. J. Clin. Oncol. 35(suppl. 15), 2568 (2017).28514183 [Google Scholar]
- 75. Vugmeyster, Y. et al Selection of the recommended phase 2 dose (RP2D) for M7824 (MSB0011359C), a bifunctional fusion protein targeting TGF‐β and PD‐L1. J. Clin. Oncol. 36(suppl. 15), 2566 (2018).29945529 [Google Scholar]
- 76. Sanghavi, K. et al Population pharmacokinetics of ipilimumab in combination with nivolumab in patients with advanced solid tumors. CPT Pharmacometrics Syst. Pharmacol. 9, 29–39 (2020). [DOI] [PMC free article] [PubMed] [Google Scholar]
- 77. Li, C. et al Exposure‐response analyses of trastuzumab emtansine in patients with HER2‐positive advanced breast cancer previously treated with trastuzumab and a taxane. Cancer Chemother. Pharmacol. 80, 1079–1090 (2017). [DOI] [PubMed] [Google Scholar]
- 78. Tabernero, J. et al Exposure‐response analyses of ramucirumab from two randomized, phase III trials of second‐line treatment for advanced gastric or gastroesophageal junction cancer. Mol. Cancer Ther. 16, 2215–2222 (2017). [DOI] [PubMed] [Google Scholar]
- 79. Jin, R. et al Exposure‐response (ER) and case‐control analyses of ramucirumab leading to recommendation for dosing optimization in patients with gastric cancer. J Clin. Oncol. 33(suppl. 15), 2578 (2015).26124476 [Google Scholar]
- 80. Bender, B.C. , Schindler, E. & Friberg, L.E. Population pharmacokinetic–pharmacodynamic modelling in oncology: a tool for predicting clinical response. Br. J. Clin. Pharmacol. 79, 56–71 (2015). [DOI] [PMC free article] [PubMed] [Google Scholar]
- 81. Chanu, P. et alPK/PD relationship of the monoclonal anti‐BAFF antibody tabalumab in combination with bortezomib in patients with previously treated multiple myeloma: comparison of serum M‐protein and serum free light chains as predictors of progression free survival. Twenty‐second Population Approach Group in Europe (PAGE) meeting, Glasgow, Scotland, June 11–14, 2013. Abstract 2732.
Associated Data
This section collects any data citations, data availability statements, or supplementary materials included in this article.
Supplementary Materials
Box S1‐S3