

Abstract
Aims
To investigate real‐world short‐term clinical outcomes in adults with type 2 diabetes (T2D) who initiated semaglutide in a specialist endocrinology practice in Canada.
Materials and methods
This study was a retrospective observational study using data from the Canadian LMC Diabetes Registry. Adults with T2D who were naïve to glucagon‐like peptide‐1 receptor agonist (GLP‐1RA) therapy, initiated semaglutide therapy as usual standard of care between February 2018 and February 2019, and maintained semaglutide therapy during follow‐up, were eligible for analysis. The primary outcome was mean change in glycated haemoglobin (HbA1c) at 3‐ to 6‐month follow‐up.
Results
In the final analytical cohort (n = 937), there was a statistically significant mean ± SD reduction in HbA1c of −1.03 ± 1.24% (11.3 ± 13.6 mmol/mol, P < 0.001) and weight of −3.9 ± 4.0 kg (P < 0.001), with no significant change in self‐reported incidence of hypoglycaemia. There was a significant reduction in HbA1c and weight regardless of number of co‐therapies or semaglutide dose. However, adults using the 1.0‐mg dose had a significantly greater reduction in HbA1c compared to adults using the 0.25‐ to 0.5‐mg dose (between‐group difference − 0.24 ± 0.06%, 2.6 ± 0.7 mmol/mol; P < 0.001). Adults using basal‐bolus therapy required a significantly lower median total daily dose of insulin after adding semaglutide (0.82 vs. 0.93 U/kg; P < 0.001).
Conclusions
This retrospective observational study demonstrated that GLP‐1RA‐naïve adults with T2D initiating semaglutide in a real‐world clinical practice had a statistically and clinically significant reduction in HbA1c and body weight after 3 to 6 months, regardless of semaglutide dose or order of semaglutide therapy, with no significant change in reported incidence of hypoglycaemia.
Keywords: glycaemic control, hypoglycaemia, type 2 diabetes
1. INTRODUCTION
Treatment options for individuals with type 2 diabetes (T2D) include lifestyle modification, oral antidiabetic drugs, injectable non‐insulin medications, and insulin therapy. 1 Glucagon‐like peptide‐1 receptor agonists (GLP‐1RAs) are injectable glucose‐lowering therapies that induce insulin secretion, and control glucagon secretion, in a glucose‐dependent manner. In addition, gastric emptying is delayed and appetite is reduced. 2 , 3 Semaglutide, in the subcutaneous formulation, became the newest GLP‐1RA available in Canada from 2018, and is administered subcutaneously once weekly. In the SUSTAIN clinical trials programme, semaglutide was superior in reducing glycated haemoglobin (HbA1c) and body weight compared to placebo, 4 sitagliptin, 5 exenatide extended release, 6 basal insulin, 7 , 8 dulaglutide, 9 canagliflozin 10 and liraglutide. 11
Randomized controlled trials (RCTs) are considered the 'gold standard' for assessing the efficacy of a new therapy. RCTs generally enroll a highly selective participant group, who are usually younger and healthier than those typically seen in real‐world clinical practice. 12 The US Food and Drug Administration now recognizes real‐world evidence studies as important in supporting regulatory decision making. 13 Real‐world studies have the advantage of including people with a broad age range, different socio‐economic backgrounds, multiple comorbidities, and using polytherapy, which may make the results more generalizable to real‐world clinical practice.
To better understand the impact of semaglutide treatment on clinical outcomes in a T2D population in a real‐world setting, we examined the short‐term changes in glycaemic control and body weight in adults who initiated once‐weekly semaglutide, in a diabetes specialist practice group in Canada.
2. MATERIALS AND METHODS
2.1. Study design and data source
This study was a retrospective cohort analysis of the LMC Diabetes Registry. The LMC Diabetes Registry represents the active health records of 42 000 patients with diabetes from 13 community‐based clinics across Canada (10 in Ontario, two in Quebec and one in Alberta), representing the combined health records data of over 60 endocrinologists and endocrine physician assistants. All healthcare providers practice according to the Canadian Clinical Practice Guidelines, 1 operating within a publicly funded healthcare system. The registry contains sociodemographic information, medical history, all prescriptions, and laboratory investigations that are updated in real‐time. A detailed description of this registry has been previously provided. 14 , 15 The study was conducted in compliance with the ethics principles of the Declaration of Helsinki and in compliance with all International Council on Harmonization Good Clinical Practice Guidelines. An independent ethics committee approved the protocol and patients provided consent for their medical data to be used for research purposes. This study is registered at clinicaltrials.gov (NCT04175665).
Individuals were included in the analysis if they were adults (aged >18 years) with a clinical diagnosis of T2D for ≥ 6 months and met the following criteria: a first prescription for semaglutide between February 2018 and February 2019, with no prior GLP‐1RA use (within 12 months of the index date) and with a follow‐up visit post index date, and at least one HbA1c measurement at baseline and during the 3‐ to 6‐month follow‐up period. People were excluded if they had a clinical diagnosis of type 1 diabetes, a recent estimated glomerular filtration rate (eGFR) <40 mL/min/1.73m2, if they initiated another diabetes therapy on the index date, or if they had a documented history of bariatric surgery.
The baseline date (index date) was the first day that semaglutide was prescribed. Baseline data were the most recently available values on or up to 6 months prior to the index date (baseline observation period from August 2017 to February 2019). Follow‐up data were the last available values 3 to 6 months ( ± 6 weeks) post index‐date (follow‐up observation period from May 2018 to September 2019). The follow‐up period reflects the real‐world practice at LMC clinics where patients visit their endocrinologist every 3 to 6 months.
2.2. Study outcomes
The primary outcome was the mean change in HbA1c between baseline and 3‐ to 6‐month follow‐up. Secondary outcomes included: mean change in weight, body mass index (BMI), systolic blood pressure (SBP), diastolic blood pressure (DBP), triglycerides, LDL cholesterol, non‐HDL cholesterol, eGFR and alanine aminotransferase (ALT); proportion who reported ≥1 weekly incidence of hypoglycaemia (stratified by sulphonylurea [SU] vs. non‐SU use, and by insulin vs. non‐insulin use); proportion who reported ≥1 yearly incidence of severe hypoglycaemia (stratified by SU vs. non‐SU use, and by insulin vs. non‐insulin use); proportion with HbA1c ≤7.0% (53 mmol/mol) and ≤ 8.0% (64 mmol/mol) at follow‐up; and proportion with weight loss ≥5% and ≥ 10%. Exploratory endpoints included: time to addition of another diabetes therapy; time to discontinuation of semaglutide; and insulin dose at baseline and follow‐up in those using insulin.
The Canadian dosing guidance for semaglutide 16 suggests a recommended starting dose of 0.25 mg weekly, uptitrated after 4 weeks to 0.5 mg weekly. If additional glycaemic control is then needed, the dose may then be increased to 1 mg weekly. Exploratory subgroup analyses for HbA1c and weight were reported in subgroups based on the resulting semaglutide dosing (0.5 mg vs. 1.0 mg weekly), as well on adjunct insulin use, discontinuation of dipeptidyl peptidase‐4 (DPP‐4) inhibitor use at baseline, discontinuation of any anti‐hyperglycaemic agent (AHA) at baseline, duration of follow‐up (13 weeks vs. 26 weeks), and semaglutide addition as second‐, third‐ or fourth‐line therapy (excluding insulin use).
2.3. Statistical analysis
The population used for the primary and secondary endpoints included individuals who initiated and were using semaglutide therapy and had follow‐up outcome data available at the end of the follow‐up period. For the endpoint of time to semaglutide discontinuation, all those who had initiated semaglutide were analysed.
Baseline demographics and clinical characteristics were summarized. Continuous variables are reported using means, SD values and confidence intervals (CIs), or medians and interquartile ranges. Discrete variables are reported using counts (n) and percentages. The primary endpoint of change in HbA1c between baseline and follow‐up was assessed with a paired t‐test. Change in weight, BMI, blood pressure, lipids, eGFR and ALT was also analysed with a paired t‐test. The proportions who achieved pre‐defined HbA1c targets and weight targets are reported descriptively. Differences in change in HbA1c and change in weight between pre‐specified sub‐groups were analysed with multivariable linear regression, with the following variables considered for covariates: baseline value, age, duration of T2D, semaglutide dose, insulin use, and number of oral anti‐hyperglycaemic agent (OHAs) during the pre‐index period. Change in HbA1c and change in weight in the order‐of‐therapy subgroups were compared to the mean change in the overall cohort using an analysis of means, adjusting for baseline value, and using a Nelson‐Hsu adjustment for multiplicity. The proportion who reported ≥1 incidence of any hypoglycaemia at baseline and follow‐up, and the proportion who reported ≥1 incidence of severe hypoglycaemia at baseline and follow‐up, were analysed with McNemar's test. Change in total daily dose of insulin between baseline and follow‐up was analysed using a Wilcoxon signed rank test. Time to initiation of an additional anti‐hyperglycaemic agent post‐index date, and time to discontinuation of semaglutide, were reported descriptively. Missing data were not replaced. P values <0.05 were taken to indicate statistical significance, and all tests were two‐sided. All statistical analyses were performed using SAS 9.4 (Cary, North Carolina).
3. RESULTS
Between February 2018 and February 2019, 3033 patients received a prescription for semaglutide, of whom 2967 initiated the therapy. After exclusions for duration of T2D < 6 months (n = 54), history of bariatric surgery (n = 20), switching from another GLP‐1RA to semaglutide (n = 1474), initiating an additional AHA on the index date (n = 6), and an eGFR <40 mL/min/1.73m2 (n = 8), there were 1405 individuals remaining. Further exclusions for no follow‐up visit (n = 105), no baseline HbA1c available within the baseline observation period (n = 44) and no follow‐up HbA1c available within the follow‐up observation period (n = 123) led to a final full cohort of 1133 people. Finally, 937 individuals had remained on treatment and formed the main analysis population of 937 (Table 1). The mean age was 57.1 ± 10.2 years, the mean duration of T2D was 11.4 ± 7.5 years, and nearly 40% were adding semaglutide to insulin.
TABLE 1.
Baseline characteristics of the analysis cohort
| Number of participants | 937 |
| Age, years | 57.1 ± 10.2 |
| Duration of T2D, years | 11.4 ± 7.5 |
| Men, n (%) | 562 (60.0) |
| Ethnicity, n (%) | |
| White | 508 (54.2) |
| South or East Asian | 176 (18.8) |
| Other | 99 (10.6) |
| Declined | 154 (16.4) |
| Education, n (%) | |
| High school | 226 (24.1) |
| College or university | 478 (51.0) |
| Declined | 233 (24.9) |
| Household income, n (%) | |
| $0 to $30,000 | 85 (9.1) |
| $30,000 to $60,000 | 151 (16.1) |
| $60 000 to $90,000 | 111 (11.9) |
| $90,000 to $120,000 | 109 (11.6) |
| >$120,000 | 144 (15.4) |
| Declined | 337 (36.0) |
| History of macrovascular complication, n (%) | 273 (29.1) |
| History of microvascular complication, n (%) | 276 (29.5) |
| Number of OHAs used during the pre‐index period, n (%) | 2.6 ± 1.0 |
| Order of semaglutide therapy, n (%) | |
| Semaglutide added to 1 oral AHA | 165 (17.6) |
| Semaglutide added to 2 oral AHAs | 242 (25.8) |
| Semaglutide added to 3 oral AHAs | 158 (16.9) |
| Semaglutide added to insulin | 372 (39.7) |
| Concomitant diabetes therapies during the pre‐index period, n (%) | |
| Metformin | 850 (90.7) |
| DPP‐4 inhibitors | 572 (61.1) |
| SGLT2 inhibitors | 610 (65.1) |
| SUs | 375 (40.0) |
| Any insulin use | 386 (41.2) |
| Basal insulin | 213 (22.7) |
| Basal‐bolus insulin | 152 (16.2) |
| Pre‐mixed insulin | 21 (2.2) |
Abbreviations: AHA, anti‐hyperglycaemic agent; DPP‐4, dipeptidyl peptidase‐4; OHA, oral anti‐hyperglycaemic agent; SGLT2, sodium‐glucose co‐transporter‐2; SU, sulphonylurea; T2D, type 2 diabetes.
3.1. Glycated haemoglobin
The mean ± SD (median) follow‐up time for HbA1c was 4.9 ± 1.4 (5.2) months. The follow‐up HbA1c was 7.31 ± 1.16% (56 ± 12.7 mmol/mol), which was significantly lower than the baseline HbA1c of 8.34 ± 1.43% (68 ± 15.6 mmol/mol) (change of −1.03 ± 1.24%, 95% CI −1.11 to −0.95; 11.3 ± 13.6 mmol/mol, 95% CI −12.1 to ‐), P < 0.001 [Figure 1A]). At follow‐up, 45.3% of the cohort had an HbA1c ≤7.0% (<53 mmol/mol) (vs. baseline of 12.1%) and 79.1% had an HbA1c ≤8.0% (<64 mmol/mol) (vs. baseline of 46.4%). In addition, 66.2% of the cohort had an HbA1c reduction ≥0.5% (≥5.5 mmol/mol), and 44.8% of the cohort had an HbA1c reduction ≥1.0% (≥10.9 mmol/mol).
FIGURE 1.
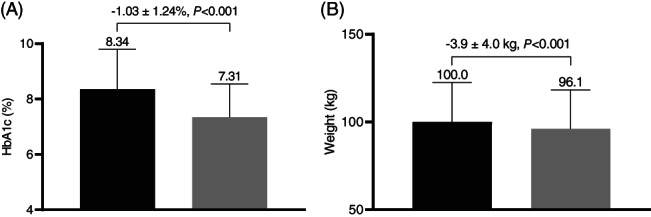
Glycated haemoglobin (HbA1c) and weight in patients initiating semaglutide. A, Baseline and follow‐up HbA1c. B, Baseline and follow‐up weight. Black bars = baseline value; grey bars = follow‐up value
3.2. Weight
There was a significant reduction in weight from baseline to follow‐up of −3.9 ± 4.1 kg (Figure 1B). At follow‐up, 33.4% of the cohort achieved a weight loss of ≥5%, and 7.3% achieved a weight loss ≥10%.
3.3. Subgroup analyses of HbA1c and weight
Change in HbA1c and weight in pre‐specified subgroups is presented in Table 2. The 42% of individuals who were using semaglutide 1.0 mg weekly at follow‐up had a significantly greater reduction in HbA1c (−0.24 ± 0.06%, −2.6 ± 0.7 mmol/mol; P < 0.001) and weight (−1.5 ± 0.3 kg; P < 0.001) compared to those using 0.25 to 0.5 mg weekly. There was no difference in change in HbA1c or weight between those who discontinued a DPP‐4 inhibitor at baseline and those who did not. Similar results were observed for those who discontinued any AHA at baseline and those who did not. Non‐insulin users had a significantly greater reduction in HbA1c (−0.21 ± 0.02%, −2.3 ± 0.2 mmol/mol; P = 0.003) compared to insulin users. Individuals who provided a 6‐month follow‐up had a statistically significantly greater reduction in HbA1c (−0.18 ± 0.06%, −5.2 ± 0.7 mmol/mol; P < 0.01) compared to those who only provided a 3‐month follow‐up.
TABLE 2.
HbA1c and weight outcomes in pre‐defined subgroups
| Baseline | Mean change | Baseline | Mean change | LS mean difference | 95% CI | P | |||
|---|---|---|---|---|---|---|---|---|---|
| Subgroups | n | 1.0 mg dose | n | 0.25–0.5 mg dose | |||||
| HbA1c (%) | 400 | 8.33 ± 1.44 (68 ± 15.7 mmol/mol) | −1.15 ± 1.27 (−12.6 ± 13.9 mmol/mol) | 537 | 8.35 ± 1.42 (68 ± 15.7 mmol/mol) |
−0.94 ± 1.21 (−10.3 ± 13.2 mmol/mol) |
−0.24 ± 0.06 (−2.6 ± 0.7 mmol/mol) | −0.36 to −0.12 (−3.9 ± 1.3 mmol/mol) | <0.001 |
| Weight (kg) | 391 | 103.1 ± 22.1 | −4.8 ± 4.2 | 517 | 97.6 ± 22.5 | −3.1 ± 3.7 | −1.5 ± 0.3 | −2.1 to −1.0 | <0.001 |
| Subgroups | DPP‐4 inhibitor discontinuation | No DPP‐4 inhibitor discontinuation | |||||||
| HbA1c (%) | 561 | 8.41 ± 1.40 (68 ± 15.3 mmol/mol) | −1.00 ± 1.24 (−10.9 ± 13.6 mmol/mol) | 376 | 8.22 ± 1.46 (66 ± 16 mmol/mol) | −1.07 ± 1.23 (−11.7 ± 13.4 mmol/mol) | 0.06 ± 0.08 (0.7 ± 0.9 mmol/mol) | −0.10 to 0.21 (−1.1 to 2.3 mmol/mol) | 0.48 |
| Weight (kg) | 547 | 97.7 ± 21.5 | −3.6 ± 3.6 | 361 | 103.5 ± 23.6 | −4.3 ± 4.4 | 0.6 ± 0.3 | −0.1 to 1.2 | 0.09 |
| Subgroups | Any AHA discontinuation | No AHA discontinuation | |||||||
| HbA1c (%) | 597 | 8.39 ± 1.40 (68 ± 15.3 mmol/mol) | −0.98 ± 1.24 (−10.7 ± 13.6 mmol/mol) | 340 | 8.25 ± 1.47 (67 ± 16.1 mmol/mol) | −1.10 ± 1.24 (−12 ± 13.6 mmol/mol) | 0.00 ± 0.08 (0 ± 0.9 mmol/mol) | −0.16 to 0.15 (−1.7 to 1.6 mmol/mol) | 0.96 |
| Weight (kg) | 593 | 97.8 ± 21.4 | −3.5 ± 3.8 | 326 | 104.0 ± 23.8 | −4.4 ± 4.4 | −0.7 ± 0.3 | −1.4 to −0.1 | 0.03 |
| Subgroups | Non‐insulin users | Insulin users | |||||||
| HbA1c (%) | 565 | 8.13 ± 1.38 (65 ± 15.1 mmol/mol) | −0.99 ± 1.21 (−10.8 ± 13.2 mmol/mol) | 372 | 8.65 ± 1.45 (71 ± 15.8 mmol/mol) | −1.08 ± 1.28 (−11.8 ± 14.0 mmol/mol) | −0.21 ± 0.02 (−2.3 ± 0.2 mmol/mol) | −0.34 to −0.07 (3.7 to −0.8 mmol/mol) | 0.003 |
| Weight (kg) | 552 | 99.6 ± 22.5 | −3.9 ± 3.7 | 356 | 100.6 ± 22.7 | −3.8 ± 4.4 | −0.4 ± 0.3 | −1.1 to 0.1 | 0.13 |
| Subgroups | 6‐month follow‐up | 3‐month follow‐up | |||||||
| HbA1c (%) | 590 | 8.32 ± 1.40 (67 ± 15.3 mmol/mol) | −1.09 ± 1.29 (−11.9 ± 14.1 mmol/mol) | 347 | 8.38 ± 1.46 (68 ± 16 mmol/mol) | −0.92 ± 1.13 (−10.1 ± 12.4 mmol/mol) | −0.18 ± 0.06 (−2 ± 0.7 mmol/mol) | −0.30 to −0.05 (−3.3 to −0.5 mmol/mol) | 0.006 |
| Weight (kg) | 570 | 101.4 ± 23.3 | −4.2 ± 4.3 | 338 | 97.6 ± 20.9 | −3.3 ± 3.4 | −0.5 ± 0.3 | −1.0 to 0.0 | 0.06 |
Abbreviations: CI, confidence interval; DPP‐4, dipeptidyl peptidase‐4; HbA1c, glycated haemoglobin; LS, least squares.
Data for baseline and within‐group change are presented as mean ± SD and data for between‐group change are presented as LS mean ± SE.
Weight and HbA1c according to order of initiation of semaglutide therapy is presented in Table 3. There was a significant reduction in HbA1c regardless of order of semaglutide therapy. Compared to the overall cohort reduction in HbA1c of 1.03% (11.3 mmol/mol), semaglutide added to either one OHA or two OHAs was associated with a significantly greater reduction in HbA1c. Semaglutide added to three or more OHAs and semaglutide added to insulin was associated with a significantly smaller reduction in HbA1c compared to the overall cohort. There was a significant reduction in body weight regardless of order of semaglutide therapy. The weight reduction in each order‐of‐therapy subgroup was not statistically significantly different compared to the mean weight reduction in the overall cohort (−3.9 kg).
TABLE 3.
Baseline and change in HbA1c and weight according to order of semaglutide therapy, and the difference compared to the overall mean change
| Order of therapy | Baseline | Unadjusted change | LS mean change | Difference compared to overall mean change (95% CI) | P | |
|---|---|---|---|---|---|---|
| Semaglutide added to 1 OHA | ||||||
| HbA1c, % | 165 | 7.78 ± 1.55 (62 ± 16.9 mmol/mol) | −1.00 ± 1.29 (−10.9 ± 14.1 mmol/mol)* | −1.35 ± 0.08 (−14.8 ± 0.9 mmol/mol)* | −0.31 (−0.48 to −0.14) (−3.4 [−5.2 to −1.5 mmol/mol]) | <0.001 |
| Weight, kg | 161 | 102.7 ± 24.0 | −4.3 ± 4.2* | −4.4 ± 0.3* | −0.4 (−1.1 to 0.3) | 0.54 |
| Semaglutide added to 2 OHA | ||||||
| HbA1c, % | 242 | 8.11 ± 1.21 (65 ± 13.2 mmol/mol) | −1.04 ± 1.17 (−11.4 ± 12.8 mmol/mol)* | −1.18 ± 0.06 (−12.9 ± 0.7 mmol/mol)* | −0.15 (−0.28 to −0.02) (−1.6 [−3.1 to −0.2]) | 0.02 |
| Weight, kg | 237 | 98.5 ± 22.4 | −4.1 ± 3.7* | −4.2 ± 0.3* | −0.3 (−0.9 to 0.2) | 0.45 |
| Semaglutide added to 3+ OHA | ||||||
| HbA1c, % | 158 | 8.56 ± 1.31 (70 ± 14.3 mmol/mol) | −0.90 ± 1.17 (−9.8 ± 12.8 mmol/mol)* | −0.76 ± 0.08 (−8.3 ± 0.9 mmol/mol)* | 0.26 (0.09 to 0.42) (2.8 [1.0 to 4.6]) | <0.001 |
| Weight, kg | 154 | 97.4 ± 20.2 | −3.2 ± 3.1* | −3.4 ± 0.3* | 0.6 (−0.1 to 1.3) | 0.16 |
| Semaglutide added to insulin | ||||||
| HbA1c, % | 372 | 8.65 ± 1.45 (71 ± 15.8 mmol/mol) | −1.08 ± 1.28 (−11.8 ± 14 mmol/mol)* | −0.87 ± 0.05 (−9.5 ± 0.5 mmol/mol)* | 0.12 (0.03 to 0.22) (1.3 [0.3 to 2.4]) | 0.005 |
| Weight, kg | 356 | 100.5 ± 22.6 | −3.8 ± 4.4* | −3.6 ± 0.2* | 0.1 (−0.3 to 0.5) | 0.86 |
Abbreviations: CI, confidence interval; HbA1c, glycated haemoglobin; LS, least squares; OHA, oral anti‐hyperglycaemic agent.
The model was adjusted for baseline value. The overall mean change in HbA1c for the cohort was −1.03% and the overall mean change in weight for the cohort was −3.9 kg. For the comparison of each mean difference to the overall mean difference, P values were adjusted for multiplicity by the Nelson‐Hsu adjustment.
Significant change from baseline (P < 0.001).
3.4. Other clinical outcomes
At follow‐up, there was a significant reduction in BMI (−1.3 ± 1.3 kg/m2; P < 0.001), SBP (−4.0 ± 13.1 mmHg; P < 0.001), DBP (−1.5 ± 8.8 mmHg; P < 0.001), triglycerides (−0.4 ± 1.3 mmol/L; P < 0.001), LDL cholesterol (−0.2 ± 0.7 mmol/L; P < 0.001), non‐HDL cholesterol (−0.4 ± 0.8 mmol/L; P < 0.001), and ALT (−2.5 ± 12.7 U/L; P < 0.001), with no significant difference in eGFR (−0.5 ± 8.9 mL/min/1.73m2; P = 0.10 [Table 4]).
TABLE 4.
Secondary clinical outcomes
| N | Baseline | Follow‐up | Change | 95% CI | P | |
|---|---|---|---|---|---|---|
| Weight, kg | 908 | 100.0 ± 22.5 | 96.1 ± 22.2 | −3.9 ± 4.0 | −4.1 to −3.6 | <.001 |
| BMI, kg/m2 | 881 | 34.7 ± 7.0 | 33.5 ± 7.0 | −1.3 ± 1.3 | −1.3 to −1.2 | <.001 |
| SBP, mmHg | 902 | 126.6 ± 14.5 | 122.7 ± 13.1 | −4.0 ± 13.1 | −4.8 to −3.1 | <.001 |
| DBP, mmHg | 902 | 74.9 ± 8.8 | 73.4 ± 8.8 | −1.5 ± 8.8 | −2.1 to −1.0 | <.001 |
| Triglycerides | 641 | 2.3 ± 1.7 | 1.9 ± 1.2 | −0.4 ± 1.3 | −0.5 to −0.3 | <.001 |
| LDL cholesterol | 591 | 1.9 ± 0.8 | 1.7 ± 0.8 | −0.2 ± 0.7 | −0.3 to −0.2 | <.001 |
| Non‐HDL cholesterol | 626 | 2.9 ± 1.1 | 2.5 ± 0.9 | −0.4 ± 0.8 | −0.5 to −0.3 | <.001 |
| eGFR (ml/min/1.73m2) | 869 | 90.1 ± 19.4 | 89.6 ± 19.4 | −0.5 ± 8.9 | −1.1 to 0.1 | .10 |
| ALT (U/L) | 485 | 30.3 ± 15.6 | 27.8 ± 14.1 | −2.5 ± 12.7 | −3.6 to −1.3 | <.001 |
Abbreviations: ALT, alanine aminotransferase; BMI, body mass index; CI, confidence interval; DBP, diastolic blood pressure; eGFR, estimated glomerular filtration rate; SBP, systolic blood pressure.
Data are presented as mean ± SD.
3.5. Hypoglycaemia
Of the 815 participants with available self‐reported hypoglycaemia data, there was no change in the proportion reporting at least one incidence of weekly hypoglycaemia between baseline (4.3%) and follow‐up (4.7%; P = 0.70), or in the proportion reporting at least one incidence of yearly severe hypoglycaemia (baseline 0.4%, follow‐up 0.5%; P = 0.65). In those who maintained SU use during the pre‐index and follow‐up period, the proportion reporting at least one incidence of weekly hypoglycaemia between baseline (2.4%) and follow‐up (3.4%) was not significantly different (P = 0.41). No participant who maintained SU therapy reported any incidence of severe hypoglycaemia. In those people who maintained insulin use, the proportion reporting at least one incidence of weekly hypoglycaemia between baseline (7.5%) and follow‐up (8.4%) was not different (P = 0.65).
3.6. Insulin dose
Data for insulin dose at baseline and follow‐up in those with available insulin dose data who maintained their baseline insulin regimen during follow‐up are presented in Table S1. The median total daily dose in units and in units/kg was 10% lower at follow‐up for those using basal insulin only (44.0 U vs. 40.0 U and 0.44 U/kg vs. 0.42 U/kg; P < 0.01). Total daily dose of insulin was 20% lower in those using basal‐bolus therapy (99.0 U vs. 79.5 U and 0.93 U/kg vs. 0.82 U/kg; P < 0.01).
3.7. AHA addition during follow‐up
During the 3‐ to 6‐month (± 6 week) follow‐up period, 61 individuals (6.5%) added another AHA. The mean ± SD (range) time to addition of another AHA was 20.0 ± 7.2 (6.4−31.9) weeks. Of those who added additional therapy during follow‐up, 22 added a sodium‐glucose co‐transporter‐2 (SGLT2) inhibitor, 11 added an SU, five added metformin, 24 added a basal insulin and three added a bolus insulin. The baseline HbA1c in those who added AHA therapy during the follow‐up period was higher than in the overall cohort (9.05% vs. 8.34%, 75 ± 68 mmol/mol). The change in HbA1c in those who added therapy during follow‐up was similar to the change in the overall cohort (−0.99% vs. −1.03%, −10.8 vs. −11.3 mmol/mol).
3.8. Semaglutide discontinuation
During the 3‐ to 6‐month (± 6 week) follow‐up period, 196 people (17.3%) in the full cohort discontinued semaglutide. The mean ± SD (median) time to the recording of discontinuation was 14.3 ± 9.2 (14.0) weeks. There were no reported events of pancreatitis, medullary carcinoma of thyroid, or new or progressing retinopathy noted in the follow‐up period.
4. DISCUSSION
The present study (the SPARE study) investigated real‐world clinical outcomes during the first year of semaglutide availability in Canada, in patients with T2D attending a referral‐based specialist practice. People who persisted on semaglutide therapy throughout the 3‐ to 6‐month follow‐up period had a mean HbA1c reduction of 1.03% and a mean weight reduction of nearly 4 kg. These individuals' mean age (57.1 ± 10.2 years), duration of T2D (11.4 ± 7.5 years) and baseline HbA1c (8.34 ± 1.43%, 68 ± 15.6 mmol/mol) were entirely consistent with those of the cohort studies in the SUSTAIN series, which ranged in age from 53.7 to 58.8 years, 4 , 5 , 6 , 7 , 8 , 9 , 11 in diabetes duration from 4.2 to 13.3 years and in baseline HbA1c from 8.1% to 8.4% (65 to 68 mmol/mol).
Semaglutide was associated with a significant HbA1c and weight reduction regardless of whether a DPP‐4 inhibitor or another AHA was discontinued on the index date, and regardless of order of introduction of semaglutide therapy. However, the mean reduction in HbA1c in those who initiated semaglutide following treatment with one or two OHAs was significantly greater than the mean HbA1c reduction in the overall cohort. Conversely, when semaglutide was added to three OHAs or added to insulin, the mean reduction in HbA1c was still statistically and clinically significant, but was lower than the reduction observed in the overall cohort.
Although the reduction in HbA1c was both statistically and clinically significant, the reduction in HbA1c in those using the 0.5‐mg dose, and the 1.0‐mg dose, was 0.5% (5.5 mmol/mol) and 0.35% (3.8 mmol/mol) smaller, respectively, than the reduction seen with the same doses in the SUSTAIN 1 RCT comparing semaglutide to placebo. 4 Participants in SUSTAIN 1 were younger, with a shorter duration of T2D, were treatment‐naïve and had a longer on‐treatment time until endpoint assessment. This real‐world cohort, in contrast, was using multiple AHAs and had multiple comorbidities. Furthermore, RCTs provide additional healthcare provider support, as well as scheduled dispensing of a therapy, that are not routinely available to the larger populations being assessed in real‐world evaluations. Interestingly, the weight losses in these real‐world cohorts of semaglutide 0.5 mg users (−3.1 kg), and 1.0 mg users (−4.8 kg), were actually similar to the weight loss observations in SUSTAIN 1. 4
In the present study, significant improvements were also observed in BMI, blood pressure and lipid profile following initiation of semaglutide. Therapies for diabetes that improve not only glycaemia but also weight, blood pressure and lipids may have additional benefit in the risk reduction of the cardiovascular and microvascular complications that are associated with diabetes. 1 Importantly, self‐reported hypoglycaemia did not significantly differ between baseline and follow‐up, even among those using SU or insulin therapy. Individuals using insulin experienced a significant reduction in insulin dose, particularly for those using a basal‐bolus insulin regimen. A reduction in insulin dose was also reported in participants adding semaglutide to basal insulin in the SUSTAIN 5 trial. 8
During the 3‐ to 6‐month follow‐up period, 17.3% of the cohort discontinued semaglutide therapy, which is higher than that reported in RCTs. 4 , 5 , 6 , 7 , 8 , 9 Although this discontinuation rate is similar to a retrospective, real‐world study of a similar group of people initiating dulaglutide or liraglutide in the LMC Diabetes Registry, 17 the discontinuation rate is lower compared to other real‐world evaluations of dulaglutide, liraglutide, or exenatide. 18 , 19 , 20 Participants in this cohort were attending multidisciplinary specialist clinics operating in a well‐resourced public health system, which may have improved persistence.
The major strength of this study is the availability of many clinically important real‐life treatment outcomes from a large sample of people with T2D initiating semaglutide. In addition, we were able to report on the effectiveness of semaglutide in different order‐of‐therapy subgroups. A limitation of this study is that individuals were not randomly assigned to semaglutide. Due to the observational design of the study, causation cannot be inferred and results should be interpreted appropriately. We only reported outcomes in GLP‐1RA‐naïve individuals, and it is not known how the results would differ in those who switched from another GLP‐1RA to semaglutide. However, a small, recently published study that analysed the records of 40 patients who switched from liraglutide to semaglutide reported a significant reduction in HbA1c and weight. 21 Further, semaglutide did not become available on a publicly funded drug benefit formulary until September 2019, thus the majority of individuals studied had third‐party benefits, introducing a potential source of selection bias. Although we report lipid and blood pressure outcomes, we did not restrict changes in these therapies after semaglutide initiation. Finally, these individuals were attending a specialist endocrinology practice and the findings may not be generalizable to all people with T2D.
In conclusion, this real‐world study found that GLP‐1RA‐naïve adults with T2D initiating once‐weekly semaglutide had a statistically and clinically significant 3‐ to 6‐month reduction in HbA1c and weight, regardless of semaglutide dose or order of semaglutide therapy. Blood pressure and lipids also improved, and there was no change in reported incidence of hypoglycaemia. Future research should examine real‐world outcomes of semaglutide during a longer follow‐up period, compare the effectiveness to other diabetes therapy classes, and investigate real‐world outcomes in people who switch from another GLP‐1RA to semaglutide.
CONFLICTS OF INTEREST
R.E.B. has no conflicts of interest to declare. P.G.B. is an employee of, and shareholder of, Novo Nordisk. R.A. reports research grants from Sanofi, Novo Nordisk, Janssen, AstraZeneca, Becton Dickinson Technologies, Boehringer Ingelheim, Eli Lilly, Zealand, Xeris, Medpace, Kowa, Insulet, Dexcom, Bausch Health, Tandem Diabetes and Bayer, and consultancies/personal fees from Sanofi, Novo Nordisk, Janssen, AstraZeneca, Becton Dickinson Technologies, Boehringer Ingelheim, Eli Lilly, HTL Strefa, Gilead and Merck.
Supporting information
Table S1 Median insulin dose at baseline and follow‐up in the subgroup of patients using insulin.
Brown RE, Bech PG, Aronson R. Semaglutide once weekly in people with type 2 diabetes: Real‐world analysis of the Canadian LMC diabetes registry (SPARE study). Diabetes Obes Metab. 2020;22:2013–2020. 10.1111/dom.14117
Peer Review The peer review history for this article is available at https://publons.com/publon/10.1111/dom.14117.
Funding information This study was funded by Novo Nordisk.
REFERENCES
- 1. Diabetes Canada Clinical Practice Guidelines Executive Committee . Diabetes Canada 2018 clinical practice guidelines for the prevention and Management of Diabetes in Canada. Can J Diabetes. 2018;42(S1):S1‐S325. 10.1080/00945718308059306. [DOI] [PubMed] [Google Scholar]
- 2. Nauck M, Niedereichholz U, Ettler R, et al. Glucagon‐like peptide 1 inhibition of gastric emptying outweighs its insulinotropic effects in healthy humans. Am J Physiol. 1997;273(5):E981. [DOI] [PubMed] [Google Scholar]
- 3. Koliaki C, Doupis J. Incretin‐based therapy: a powerful and promising weapon in the treatment of type 2 diabetes mellitus. Diabetes Ther. 2011;2(2):101‐121. [DOI] [PMC free article] [PubMed] [Google Scholar]
- 4. Sorli C, Sichi H, Tsoukas GM, et al. Efficacy and safety of once‐weekly semaglutide monotherapy versus placebo in patients with type 2 diabetes (SUSTAIN 1): a double‐blind, randomised, placebo‐controlled, parallel‐group, multinational, multicentre phase 3a trial. Lancet Diab Endocrinol. 2017;5:251‐260. 10.1016/S2213-8587(17)30013-X. [DOI] [PubMed] [Google Scholar]
- 5. Ahrén B, Masmiquel L, Kumar H, et al. Efficacy and safety of once‐weekly semaglutide versus once‐daily sitagliptin as an add‐on to metformin, thiazolidinediones, or both, in patients with type 2 diabetes (SUSTAIN 2): a 56‐week, double‐blind, phase 3a, randomised trial. Lancet Diabetes Endocrinol. 2017;5(5):341‐354. 10.1016/S2213-8587(17)30092-X. [DOI] [PubMed] [Google Scholar]
- 6. Ahmann AJ, Capehorn M, Charpentier G, et al. Efficacy and safety of once‐weekly semaglutide versus exenatide ER in subjects with type 2 diabetes (SUSTAIN 3): a 56‐week, open‐albe, randomized clinical trial. Diabetes Care. 2017;43(7):1‐9. 10.2337/dc17-0417/-/DC1. [DOI] [PubMed] [Google Scholar]
- 7. Aroda VR, Bain SC, Cariou B, et al. Efficacy and safety of once‐weekly semaglutide versus once‐daily insulin glargine as add‐on to metformin (with or without sulfonylureas) in insulin‐naive patients with type 2 diabetes (SUSTAIN 4): a randomised, open‐label, parallel‐group, multicentre, Mul. Lancet Diabetes Endocrinol. 2017;5(5):355‐366. 10.1016/S2213-8587(17)30085-2. [DOI] [PubMed] [Google Scholar]
- 8. Rodbard HW, Lingvay I, Reed J, et al. Semaglutide added to basal insulin in type 2 diabetes (SUSTAIN 5): a randomized, controlled trial. J Clin Endocrinol Metab. 2018;103(6):2291‐2301. 10.1210/jc.2018-00070. [DOI] [PMC free article] [PubMed] [Google Scholar]
- 9. Pratley RE, Aroda VR, Lingvay I, et al. Semaglutide versus dulaglutide once weekly in patients with type 2 diabetes (SUSTAIN 7): a randomised, open‐label, phase 3b trial. Lancet Diabetes Endocrinol. 2018;6:1‐12. 10.1016/S2213-8587(18)30024-X. [DOI] [PubMed] [Google Scholar]
- 10. Lingvay I, Catarig A‐M, Frias JP, et al. Efficacy and safety of once‐weekly semaglutide versus daily canagliflozin as add‐on to metformin in patients with type 2 diabetes (SUSTAIN 8): a double‐blind, phase 3b, randomised controlled trial. Lancet Diabetes Endocrinol. 2019;7(11):834‐844. 10.1016/S2213-8587(19)30311-0. [DOI] [PubMed] [Google Scholar]
- 11. Capehorn MS, Catarig A‐M, Furberg JK, et al. Efficacy and safety of once‐weekly semaglutide 1.0 mg vs once‐daily liraglutide 1.2 mg as add‐on to 1–3 oral antidiabetic drugs in subjects with type 2 diabetes (SUSTAIN 10). Diabetes Metab. 2020;46(2):100‐109. 10.1016/j.diabet.2019.101117. [DOI] [PubMed] [Google Scholar]
- 12. Sherman RE, Anderson SA, Dal Pan GJ, et al. Real‐world evidence ‐ what is it and what can it tell us? N Engl J Med. 2016;375(23):2293‐2297. 10.1056/NEJMsb1609216. [DOI] [PubMed] [Google Scholar]
- 13. United States Food and Drug Administration . Use of Real‐World Evidence to Support Regulatory Decision‐Making for Medical Devices: Guidance for Industry and Food And Drug Administration Staff; 2017.
- 14. Aronson R, Orzech N, Ye C, Brown RE, Goldenberg R, Brown V. Specialist‐led diabetes registries and prevalence of poor glycemic control in type 2 diabetes: the diabetes registry outcomes project for A1C reduction (DROP A1C). Diabetes Care. 2016;39(10):1711‐1717. 10.2337/dc15-2666. [DOI] [PubMed] [Google Scholar]
- 15. Aronson R, Orzech N, Ye C, Goldenberg R, Brown V. Specialist‐led diabetes registries and predictors of poor glycemic control in type 2 diabetes: insights into the functionally refractory patient from the LMC diabetes registry database. J Diabetes. 2016;8(1):76‐85. 10.1111/1753-0407.12257. [DOI] [PubMed] [Google Scholar]
- 16. Novo Nordisk Canada Inc . Ozempic (Semaglutide Injection) Product Monograph; 2018.
- 17. Brown RE, Abitbol A, Bajaj HS, et al. Patient reported outcomes following initiation of glucagon‐like peptide‐1 receptor agonists in patients with type 2 diabetes in a specialist endocrinology practice of the LMC diabetes registry: the PROGRESS‐diabetes study. Diabetes Res Clin Pract. 2019;156:107820 10.1016/j.diabres.2019.107820. [DOI] [PubMed] [Google Scholar]
- 18. Alatorre C, Fernández Lando L, Yu M, et al. Treatment patterns in patients with type 2 diabetes mellitus treated with glucagon‐like peptide‐1 receptor agonists: higher adherence and persistence with dulaglutide compared with once‐weekly exenatide and liraglutide. Diabetes Obes Metab. 2017;19:953‐961. 10.1111/dom.12902. [DOI] [PMC free article] [PubMed] [Google Scholar]
- 19. Mody R, Grabner M, Yu M, et al. Real‐world effectiveness, adherence and persistence among patients with type 2 diabetes mellitus initiating dulaglutide treatment. Curr Med Res Opin. 2018;34(6):995‐1003. 10.1080/03007995.2017.1421146. [DOI] [PubMed] [Google Scholar]
- 20. Mody R, Huang Q, Yu M, Ruizhi MS, Mpharm HP. Adherence, persistence, glycaemic control and costs among patients with type 2 diabetes initiating dulaglutide compared with liraglutide or exenatide once weekly at 12‐month follow‐up in a real‐world setting in the United States. Diabetes Obes Metab. 2019;21:1‐10. 10.1111/dom.13603. [DOI] [PMC free article] [PubMed] [Google Scholar]
- 21. Goncalves E, Bell DS. Efficacy of semaglutide versus liraglutide in clinical practice. Diabetes Metab. 2019. in press. 10.1016/j.diabet.2019.10.001. [DOI] [PubMed] [Google Scholar]
Associated Data
This section collects any data citations, data availability statements, or supplementary materials included in this article.
Supplementary Materials
Table S1 Median insulin dose at baseline and follow‐up in the subgroup of patients using insulin.