Abstract
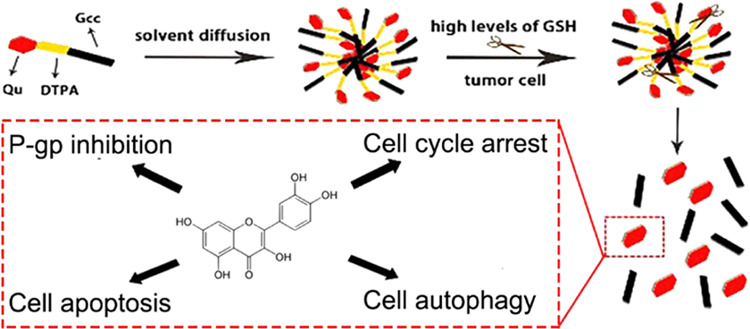
The encapsulation of hydrophobic drugs is a problem that many researchers are working on. The goal of this study is to achieve the delivery of hydrophobic drugs by means of prodrugs and nanoformulations for a stronger tumor cell-killing effect and explore related killing mechanisms. Lipophilic quercetin (Qu) was covalently linked to glyceryl caprylate-caprate (Gcc) via disulfide bonds-containing 3,3′-dithiodipropionic acid (DTPA) to synthesize novel lipid Qu-SS-Gcc. Qu-SS-Gcc lipid nanoparticles (Qu-SS-Gcc LNPs) were fabricated using the solvent diffusion technique. The intracellular release of Qu by cleavage of nanocarriers was determined by liquid chromatography and compared with the uptake of free Qu. Detection methods, such as fluorescent quantitation, flow cytometry, and western blot were applied to explore the action mechanism induced by Qu. It was revealed that Qu-SS-Gcc LNPs could be cleaved by the high concentrations of reduction molecules in MCF-7/ADR (human multidrug-resistant breast cancer) cells, followed by the release of Qu. The intracellular Qu content produced by dissociation of Qu-SS-Gcc LNPs was higher than that produced by internalization of free Qu. The resulting release of Qu exerted superior cell-killing effects on MCF-7/ADR cells, such as P-gp inhibition by binding to P-gp binding sites, blocking the cell cycle in the G2 phase, and causing cell apoptosis and autophagy. Moreover, it was revealed autophagy triggered by a low concentration of Qu-SS-Gcc LNPs was beneficial to cell survival, while at a higher concentration, it acted as a cell killer. Qu-SS-Gcc LNPs can realize massive accumulation of Qu in tumor cells and exert a multifaceted killing effect on tumor cells, which is a reference for the delivery of hydrophobic drugs.
Introduction
Quercetin (Qu) as a naturally occurred polyphenol flavonoid is rich in many plant fruits, flowers, etc.1 Compared with other natural ingredients,2 it has multiple physiological activities, including apoptosis initiation, angiogenesis inhibition and P-glycoprotein (P-gp) and oxidative stress alleviation.3−5 Though Qu has a variety of biological activities and pharmacological effects, it belongs to the biopharmaceutical classification system class IV and has limited clinical applications due to its low water solubility and bioavailability.
Nanodrug delivery systems have unique advantages in increasing drug solubility, improving bioavailability and therapeutic effects, and enhancing drug stability. Of many currently available nanoparticles for drug delivery, including, bubbles,6,7 fiber meshes,8,9 and patches,10 lipid nanoparticles (LNPs) have shown several irreplaceable advantages over these counterparts. LNPs are lipid-based nanocarriers (monostearin, phospholipids, sphingolipids, etc.), and compared with other carriers, the lipid material has advantages of simple molecular structures, good biocompatibility, and capability of large-scale production.11 LNPs are preferable drug delivery systems for improving the bioavailability of many lipophilic drugs due to their superior transmembrane delivery and preferable cellular internalization capabilities.12,13
The prodrugs are generally recognized as chemically modified and biologically inert drug molecules that can be activated at the target sites to release pharmacologically active drugs.14 Although prodrugs have been proved to show elevated benefits in cancer treatment,15 the mechanisms responsible for its functionalization and the methods to study their activation within cells are rarely been explored, which calls for more related efforts.16 Therefore, in this study, the lipid and drug were covalently combined in the form of a prodrug and then prepared into nanoparticles to achieve a satisfactory drug-loading. Meanwhile, the covalently linked bonds could achieve responsive cleavage at the target site to release the drug. We synthesized Qu-grafted glyceryl caprylate-caprate (Gcc) lipid containing disulfide bonds. The solvent diffusion technique was employed to prepare Qu-SS-Gcc LNPs. The synthesis and preparation of Qu-SS-Gcc LNPs had been published by our group,17 in which the cleavage property of Qu-SS-Gcc LNPs in response to the high reducing concentrations of glutathione (GSH) in cancer cells was verified by related experiments. In this study, we had a deeper exploration and studied the action mechanism of Qu produced by Qu-SS-Gcc LNPs in MCF-7/ADR cells. Our results suggested that the Qu produced along with the degradation of disulfide bonds in Qu-SS-Gcc LNPs could result in P-gp inhibition, induce cell cycle arrest, promote apoptosis, and induce autophagy in tumor cells; the combination of multifaceted killing mechanisms had a satisfactory killing effect on tumor cells.
Results and Discussion
Determination of Qu
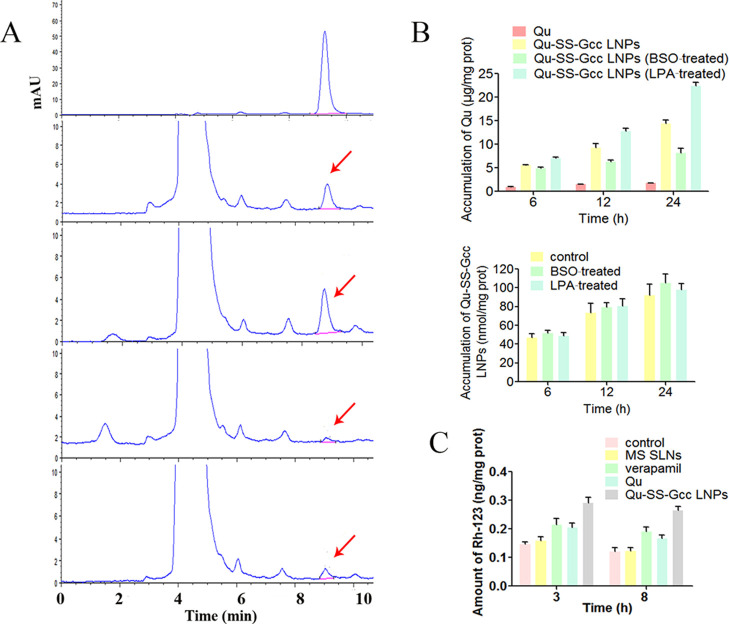
As a water-insoluble drug, it is difficult for Qu to be taken up by cells. When Qu was covalently linked to the lipid, it was easily taken up by cells due to the superior internalization ability of the lipid. The fabrication of Qu-SS-Gcc LNPs had been studied by our group,17 and it was verified by related experiments that Qu-SS-Gcc LNPs could respond to high levels of reducing substances in tumor cells, and Qu was produced via the cleavage of nanocarriers. First, it was doubted that after the internalization of Qu-SS-Gcc LNPs, could it be cleaved to produce enough Qu? To reveal the intracellular Qu content produced by cleavage of Qu-SS-Gcc LNPs or uptake of Qu in MCF-7/ADR cells at different time points, HPLC was employed for quantitative analysis (Figure 1A). It showed that the intracellular Qu level in the Qu-SS-Gcc LNP group was significantly higher than that in the free Qu group. This might be due to the strong internalization ability of Qu-SS-Gcc LNPs compared to that of free Qu, and a large number of nanoparticles were cleaved by intracellular GSH, followed by production of Qu. In addition, it showed that the amount of Qu cleaved in tumor cells was closely related to the GSH content in tumor cells. When the GSH content in MCF-7/ADR cells was regulated by BSO or LPA to change the intracellular GSH concentration (Figure S2), the corresponding intracellular Qu content was positively correlated with the GSH content; more intracellular GSH content led to more cleavage of Qu (Figure 1B). The quantitative determination of fluorescent-labeled nanoparticles showed that the intracellular GSH content had an indistinctive effect on the uptake of nanoparticles (Figure 1C), indicating that the change of intracellular Qu content was not caused by the uptake of nanoparticles. A simulative epithelial cell monolayer formed by MDCK cells was employed to investigate the molecular mechanisms of LNP transportation, and it showed that the endocytosis of Qu-SS-Gcc LNPs was an energy-dependent process, mainly dependent on lipid raft/caveolae- and clathrin-mediated pathways (Figure S3). The large amount of Qu that Qu-SS-Gcc LNPs produced in tumor cells is a positive signal for solving the issue of poor solubility and permeability of Qu.
Figure 1.
Determination of Qu. (A) HPLC analysis of Qu in MCF-7/ADR cells. MCF-7/ADR cells were incubated with Qu (50 μM) or Qu-SS-Gcc LNPs (50 μM) for 3 or 8 h: (a) determination of free Qu; (b, c) determination of intracellular Qu after treatment with Qu-SS-Gcc LNPs for 3 and 8 h, respectively; and (d, e) determination of intracellular Qu after treatment with Qu for 3 and 8 h, respectively. (B) Amount of intracellular Qu after incubation with Qu (50 μM) or Qu-SS-Gcc LNPs (50 μM) in different conditions for 6, 12, or 24 h (upper) and amount of intracellular Qu-SS-Gcc LNPs (50 μM) in different conditions for 6, 12, or 24 h (lower). (C) Rh-123 efflux of the MCF-7/ADR cells after treatment with MS SLNs (50 μM), Qu (50 μM), Qu-SS-Gcc LNPs (50 μM), or verapamil (20 μM) for 3 or 8 h. The error bars in the graphs represent the standard deviation (n = 3).
P-gp Inhibition
Ensuring that there was a large amount of Qu in tumor cells, we studied the multifaceted killing effects of Qu on tumor cells and its action mechanisms. Rhodamine-123 (Rh-123) is a P-gp substrate that can reflect P-gp inhibition and drug efflux.18 Verapamil is an inhibitor of P-gp and was used as a positive control. Monostearin solid lipid nanoparticles (MS SLNs), which had a similar particle size to Qu-SS-Gcc LNPs, were prepared as a control. The Rh-123 uptake (Figure 1C) showed that compared with that in control and MS SLN groups, the intracellular Rh-123 content increased significantly in the groups treated with verapamil, Qu, or Qu-SS-Gcc LNPs, and among which the Qu-SS-Gcc LNP group had more Rh-123 retention than the Qu group, indicating that Qu-SS-Gcc LNPs could inhibit the efflux of Rh-123 significantly and had better P-gp inhibition effect than free Qu. Immunofluorescence results (Figure 2A) showed that the fluorescence intensity of P-gp in the MS SLN group was similar to that in the control group, while the fluorescence intensity of P-gp in verapamil, Qu, or Qu-SS-Gcc LNP groups all weakened. P-gp determination by flow cytometry (Figure S4) also exhibited a similar result, which might be due to the reason that Qu occupied P-gp binding sites or reduced P-gp expression. Immunoblot analyses (Figure 2B) showed that treatment of Qu or Qu-SS-Gcc LNPs did not affect the expression of P-gp in MCF-7/ADR cells, indicating that P-gp inhibition induced by Qu was not due to the decrease of the P-gp expression but because of the occupancy of the P-gp binding sites by Qu.
Figure 2.
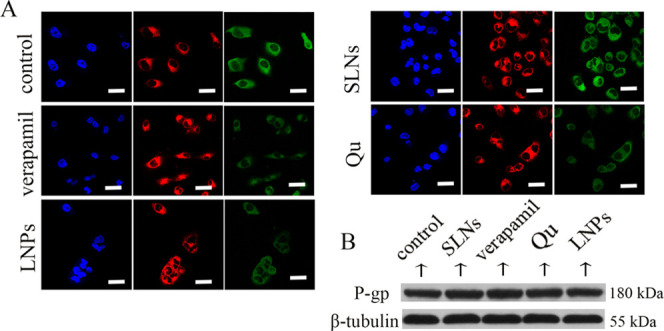
(A) Immunofluorescence staining of P-gp in MCF-7/ADR cells. Blue: DAPI-stained cell nucleus; green: P-gp; and red: FM4-64-stained plasma membrane. (B) Western blots of P-gp after treatment with various formulations in MCF-7/ADR cells. Scale bars, 20 μm.
Cell Cycle Arrest
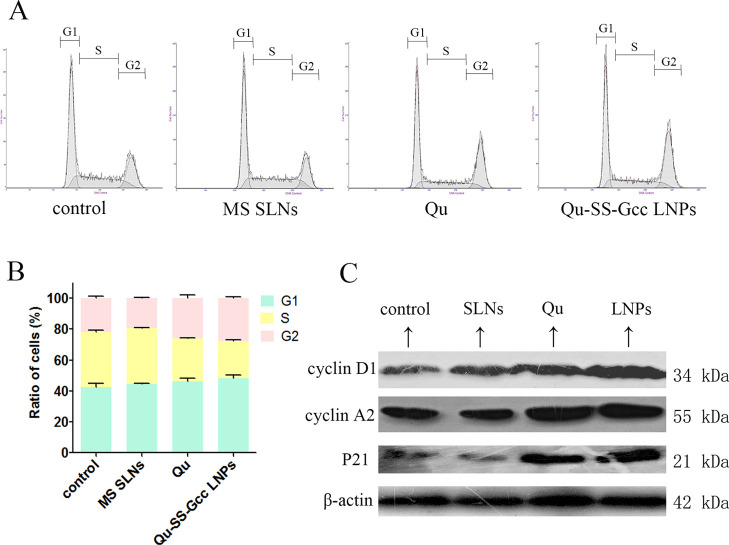
As shown in Figure 3A,B, there was no obvious change in the cell cycle of MCF-/ADR cells after treatment with MS SLNs, whereas after treatment with Qu or Qu-SS-Gcc LNPs, the cell ratios in G1 and S phases both decreased, while the cell ratio in the G2 phase was increased. In the Qu-SS-Gcc LNP group, the cell ratios in the G1 phase decreased from 42.5 to 37.6% and the cell ratio in the S phase decreased from 35.6 to 26.8%, while the cell ratio in the G2 phase increased from 21.9 to 35.6%, indicating that Qu produced by intracellular cleavage of Qu-SS- Gcc LNPs could block the tumor cell cycle in the G2 phase. For the cell cycle, cyclins, network systems including cyclin-dependent kinases (CDKs), and cyclin-dependent kinase inhibitors (CDKIs) play an important role.19 Cyclin D1 is the regulatory protein for G1 to S phases, and cyclin A2 is the regulatory protein for S to G2 phases. P21 is a member of the CDKI family that binds to cyclin, CDK, or cyclin-CDK, leading to cell cycle arrest and cell proliferation inhibition. The immunoblot analyses (Figure 3C) showed that the Qu or Qu-SS-Gcc LNP treatment increased the expressions of cyclin D1, cyclin A2, and P21. These results indicated that the cell cycle of MCF-7/ADR cells would be arrested by Qu-SS-Gcc LNPs in the G2 phase through the corresponding cell-cycle-mediated pathways.
Figure 3.
Cell cycle of MCF-7/ADR cells treated with MS SLNs (50 μM), Qu (50 μM), or Qu-SS-Gcc LNPs (50 μM). (A) Percentage of cells in G1, S, and G2 phases in MCF-7/ADR cells as detected by flow cytometry. (B) Histograms showing the percentage of cells in G1, S, and G2 phases. (C) Changes in cell-cycle-related proteins. Cyclin D1, cyclin A2, and P21 are shown as detected by western blots. The error bars in the graphs represent the standard deviation (n = 3).
Cell Apoptosis
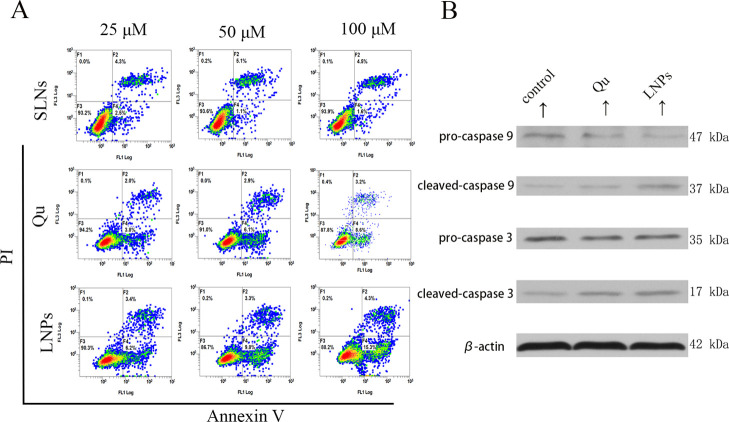
Apoptosis caused by Qu has also been mentioned in reports.20−22 Annexin-V and propidium iodide (PI) were used to study cell apoptosis and determined by flow cytometry. As shown in Figure 4A, both Qu- and Qu-SS-Gcc LNP-treated groups could induce apoptosis, and for the same dose of Qu and Qu-SS-Gcc LNPs, Qu-SS-Gcc LNPs promoted stronger cell apoptosis compared with free Qu; Qu or Qu-SS-Gcc LNPs exerted the apoptotic effect in a dose-dependent manner. This might be because Qu-SS-Gcc LNPs could produce more Qu than free Qu in the cell and exert a stronger apoptotic effect. Caspases are the central regulators of apoptosis, and initiator caspases (i.e., caspase-9, -10, and -12) cleave and activate downstream effector caspases (i.e., caspase-3, -6, and -7).23 Immunoblot analysis (Figure 4B) showed that both cleaved caspase-9 and cleaved caspase-3 were elevated upon the Qu or Qu-SS-Gcc LNP treatment, which indicated that Qu-SS-Gcc LNPs could produce Qu in tumor cells and achieve the apoptosis effect through the caspase-dependent pathway.
Figure 4.
Effect of various formulations on the MCF-7/ADR cell apoptosis. (A) Percentage of the MCF-7/ADR cells in apoptosis after treatment with MS SLNs (25, 50, and 100 μM), Qu (25, 50, and 100 μM), or Qu-SS-Gcc LNPs (25, 50, and 100 μM) for 24 h, as detected by flow cytometry. (B) Immunoblot analysis of apoptosis-related proteins. Caspase-3 and caspase-9 are shown after the Qu (50 μM) or Qu-SS-Gcc LNP (50 μM) treatment, as detected by western blots.
Cell Autophagy
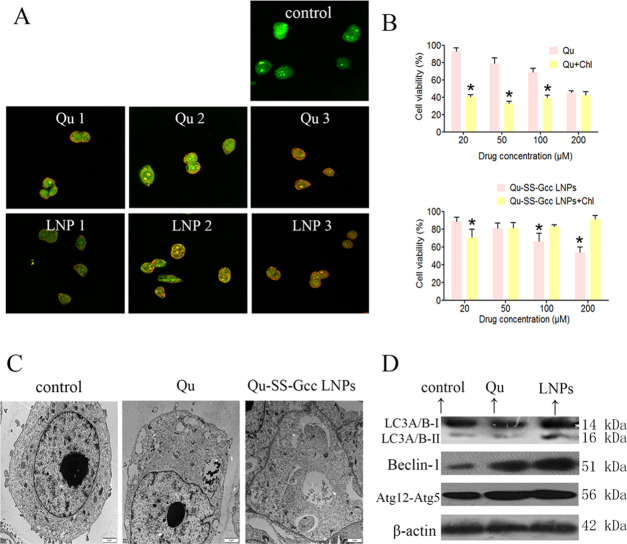
To better understand the tumor-cell-killing effect of Qu, we examined other cellular responses associated with cell death. Autophagy is a catabolic process for the autophagosomic–lysosomal degradation of proteins activated in response to nutrient deprivation and in neurodegenerative conditions.24 Some studies25−27 have shown that Qu could cause autophagy in some cell lines, and Qu-induced autophagy could have a protective or killing effect on cells. Acridine orange was used to indicate the presence of acidic vesicular organelles, a main feature of autophagy.28,29 As shown in Figure 5A, Qu and Qu-SS-Gcc LNPs induced pronounced formation of orange acidic vesicular organelles in a dose-dependent manner compared with the control group in MCF-7/ADR cells. Transmission electron microscopy (TEM) was used to observe the ultrastructural details of vacuoles. As shown in Figure 5C, double-membrane-associated vacuoles appeared in the cytoplasm of MCF-7/ADR cells treated with Qu or Qu-SS-Gcc LNPs, which directly indicated that Qu or Qu-SS-Gcc LNPs could result in the occurrence of autophagy. During autophagy, a series of autophagy genes associated with formation of autophagosome are activated.30 The isolation membrane is formed as a result of the activation of the Beclin-1-Vps34 complex and subsequently elongated with the help of the ubiquitin-conjugation system.31 Atg12 is activated by Atg7, then transferred to Atg10, and finally covalently attached to Atg5 to form the Atg12–Atg5 conjugate, which localizes to autophagosome precursors.32 The lipidated form of LC3 transforming from LC3-I to LC3-II has been considered to be an autophagosomal marker due to its localization and aggregation on autophagosomes.33,34 To examine whether autophagy genes were synergistically activated corresponding to Qu-induced autophagy, immunoblot analyses were utilized to measure the expressions of LC3, Beclin-1, and the Atg12–Atg5 conjugate. It showed (Figure 5D) that LC3-II was accumulated in Qu-SS-Gcc LNP-treated MCF-7/ADR cells, and the expression of Beclin-1 and Atg12–Atg5 both was increased in Qu or Qu-SS-Gcc LNP-treated MCF-7/ADR cells, which proved changes at the genetic level triggered by the autophagy of Qu-SS-Gcc LNPs.
Figure 5.
Qu and Qu-SS-Gcc LNPs induced cell autophagy in MCF-7/ADR cells. (A) Acridine orange staining of MCF-7/ADR cells treated with indicated concentrations of Qu or Qu-SS-Gcc LNPs for 24 h. Qu 1, 2, 3: Qu 25, 50, and 100 μM, respectively; LNPs 1, 2, 3: Qu-SS-Gcc LNPs 25, 50, and 100 μM, respectively. (B) Cell viability assessed by the MTT assay in MCF-7/ADR cells treated with Qu (top) or Qu-SS-Gcc LNPs (bottom) in the absence or presence of Chl (20 μM) for 48 h. (C) Representative TEM images of MCF-7/ADR cells treated with Qu (50 μM) or Qu-SS-Gcc LNPs (50 μM) for 24 h. (D) Immunoblot analysis of autophagy-related proteins. The error bars in the graphs represent the standard deviation (n = 3). Scale bars, 20 μm. *P < 0.05.
To explore whether Qu-induced autophagy was beneficial to tumor cell proliferation, we used Chl, an autophagy inhibitor, to study the proliferation of MCF-7/ADR cells when autophagy was inhibited. It was found that inhibition of autophagy promoted cell death in the free Qu group (Figure 5B, upper), whereas the Qu-SS-Gcc LNP group showed interesting results (Figure 5B, lower). Low concentrations of Qu-SS-Gcc LNPs blocked cell growth when autophagy was inhibited, while up to a certain concentration, Qu-SS-Gcc LNPs promoted the proliferation of cells. These results indicated that autophagy induced by free Qu could promote the growth of tumor cells, while Qu-SS-Gcc LNPs protected tumor cells at first, and when the concentration increased, they could exert cell death, which might be due to the fact that although it was free Qu that exerted autophagy effect in the Qu or Qu-SS-Gcc LNP group, the Qu content in these two groups differed greatly. Compared with the free Qu group, the Qu-SS-Gcc LNP group produced significantly more Qu in the cells, because of which the Qu group could only result in a low concentration of Qu in tumor cells and produce a protective effect, while a low concentration of Qu-SS-Gcc LNPs produced low concentration of intracellular Qu and exerted protective autophagy; moreover, as the concentration increased, a large number of Qu cleaved by Qu-SS-Gcc LNPs could induce nocuous autophagy on tumor cells.
Conclusions
In summary, based on the previously synthesized redox-sensitive Qu-SS-Gcc LNPs, we determined the Qu content produced by disulfide bond cleavage when Qu-SS-Gcc LNPs responded to high levels of GSH in tumor cells. The intracellular Qu content produced by Qu-SS-Gcc LNPs was higher than that in the free Qu group. The Qu produced by cleavage of Qu-SS-Gcc LNPs resulted in P-gp inhibition in MCF-7/ADR cells and can arrest the cell cycle in the G2 phase, promote cell apoptosis, and cause cell autophagy. Different from the effect of autophagy caused by free Qu that was beneficial to MCF-7/ADR cells, the effect of autophagy caused by Qu-SS-Gcc LNPs on MCF-7/ADR cells was dose-dependent. At a low concentration of Qu-SS-Gcc LNPs, autophagy was beneficial to cell survival, while at a higher concentration, it acted as a cell killer. These functions exerted a comprehensive effect on tumor cells. The studies reported in each section may not be particularly meticulous, and there are many studies on the mechanism that are worth exploring, which remains to be done.
Experimental Section
Materials
The source of materials adopted in this article can be found in our previous reported article.11 In addition, the flow cytometry (FCM) anti-P-glycoprotein antibody and mouse IgG2a isotype control were supplied by Abcam (Cambridge, UK). The anti-P-glycoprotein antibody, anti-cyclin A2 antibody, anti-β actin antibody, and anti-β tubulin antibody were offered by Abcam. The anti-cyclin D1 antibody was supplied by Beyotime (Shanghai, China). P21 Waf1/Cip1 (12D1) rabbit mAb, the caspase-9 antibody, the caspase-3 antibody, LC3A/B rabbit mAb, the Beclin-1 rabbit mAb, and Atg12 rabbit mAb were obtained from the Cell Signaling Technology, Inc. (Shanghai, China). All other chemicals unless otherwise indicated were of analytical grade from Alladin Co. Ltd (Shanghai, China).
Synthesis of Qu-SS-Gcc and Fabrication of Qu-SS-Gcc LNPs
The synthesis of Qu-SS-Gcc was performed using our previously published protocol.11 In brief, DTPA was activated by EDC in DMF under gentle agitation (45 °C for 30 min). In addition, Qu was reacted with DMAP in anhydrous DMF under gentle agitation (45 °C for 12 h) with the protection of nitrogen. Afterward, EDC was allowed to react for another 30 min, followed by the addition of Gcc and DMAP. The reaction was allowed to proceed at 45 °C for 12 h under nitrogen, and the product was obtained by precipitation using cold distilled water. The raw product was further purified by a silica gel column using 25:1 dichloromethane:methane (v:v) as the flowing phase to obtain pure Qu-SS-Gcc. The corresponding synthesis equation is shown in Figure S1.
Cell Culture
L-02 (human normal liver cell line) and MDCK (Madin–Darby canine kidney) epithelial cells were cultured in DMEM supplied with 10% FBS at 37 °C. MCF-7/ADR (human multidrug-resistant breast cancer cell line) cells were cultured with 1640 instead of DMEM, and other culture conditions were the same.
Quantification of Qu
MCF-7/ADR cells seeded in 6-well plates (1 × 10⁵ cells per well) were allowed to grow for 24 h. Then, MCF-7/ADR cells were cultured with GSH synthesis enhancer α-lipoic acid (LPA, 500 μM) for 24 h or glutathione synthesis inhibitor buthionine sulfoximine (BSO, 500 μM) for 12 h. Afterward, Qu (50 μM) or Qu-SS-Gcc LNPs (50 μM) were added for 6, 12, or 24 h, and then the cells were lysed by a RIPA solution. Afterward, the solution was added with excess methanol to dissolve Qu, followed by content determination using HPLC as reported in our previous article.
Quantification of Nanocarriers
The cells cultured with LPA or BSO were added with ODA-FITC/Qu-SS-Gcc LNPs (50 μM) for 6, 12, or 24 h and then subjected to lysis. The amount of ODA-FITC was determined by a fluorescence spectrophotometer (F-2500, Hitachi Co., Japan).
Investigation of the Molecular Transportation Mechanism of Qu-SS-Gcc LNPs
For the transportation mechanism studies, MDCK cells were seeded on a 24-well Transwell plate (Costar, MA; pore size = 0.4 μm). Typically, 1.5 mL of medium containing a cell density of 2 × 10⁵/mL was added into the apical side, and 1.5 mL of fresh medium was added to the basolateral side. After being cultured for 7 days, the transepithelial electrical resistance (TEER) values of the cell monolayer were determined by a Millicell-ERS volt-ohmmeter (Millipore Co.). TEER values above 180 Ω·cm2 were adopted for the transportation mechanism studies. The MDCK cell monolayers were cultured with different inhibitors (Table S1) in HBSS (Hank’s balanced salt solution) for 30 min and then incubated with ODA-FITC/Qu-SS-Gcc LNPs (100 μg/mL) for 2 h. The LNP content in the apical side was determined by a fluorescence spectrophotometer.
RH-123 Efflux
MCF-7/ADR cells seeded in 6-well plates (1 × 10⁵/well) for 24 h were incubated with Rh-123 for another 3 h. Afterward, the cells were treated with fresh medium containing different nanoparticles (50 μM) or verapamil (20 μM) for predesigned time intervals (3 or 8 h). Finally, the cells were lysed and the intracellular Rh-123 content was quantified by a fluorescence spectrophotometer.
Flow Cytometry of P-gp
MCF-7/ADR cells were added into 6-well plates (1 × 10⁵ cells per well) and cultured in 5% CO2 for 24 h. Thereafter, the cells were treated (or not treated) with Qu (20, 50, and 100 μM), Qu-SS-Gcc LNPs (20, 50, and 100 μM), MS SLNs (20, 50, and 100 μM), or verapamil (20 μM) for 6 h. After this, an anti-P-glycoprotein antibody was used to label P-gp at 37 °C for 30 min, and mouse IgG2a was used as the isotype control. Flow cytometry (FCM, FC500MCL, Beckman Coulter) was conducted to determine the mean fluorescence intensity.
Immunofluorescence of P-gp
MCF-7/ADR cells were seeded on coverslips (6 × 10³/well) for 12 h and then incubated with different nanoparticles (50 μM) or verapamil (20 μM) for another 12 h. Afterward, cells were fixed by 4% paraformaldehyde (15 min) and then stained with the anti-P-gp monoclonal antibody (37 °C, 4 h) and the corresponding secondary antibody (37 °C, 4 h). The nucleus was stained by Hoechst 33342 (15 min), and the plasma membrane was stained by FM4-64. Finally, the coverslips were sealed and subjected to imaging using a confocal laser scanning microscope (CLSM, Olympus BX61).
Western Blots of P-gp
After treatment with MS SLNs (50 μM), Qu (50 μM), Qu-SS-Gcc LNPs (50 μM), or verapamil (20 μM) for 24 h, cells were treated with lysis by RIPA and prepared for the western blots analysis. The P-gp antibodies were used according to the corresponding manufacturer’s instructions.
Flow Cytometry of Apoptosis
MCF-7/ADR cells were treated (or not treated) with Qu (25, 50, and 200 μM), Qu-SS-Gcc LNPs (25, 50, and 100 μM) or MS SLNs (25, 50, and 100 μM) for 24 h. Cells were harvested and washed with PBS. Annexin-V-FITC solution (5 μL) was added to 100 μL of the cell suspension and cultured for 5 min, and then 5 μL of PI was added and cultured for 5 min. Then, 400 μL of PBS was added, mixed gently, and analyzed by FCM.
Western Blots of Caspase-3 and Caspase-9
MCF-7/ADR cells treated with Qu (50 μM) or Qu-SS-Gcc LNPs (50 μM) for 24 h were subjected to lysis and further analyzed using a standard western blot assay. The antibodies were used according to the corresponding manufacturer’s instructions.
Flow Cytometry of Cell Cycle
MCF-7/ADR cells were treated (or not treated) with Qu (50, 100, and 200 μM), Qu-SS-Gcc LNPs (50, 100, and 200 μM), or MS SLNs (50, 100, and 200 μM) for 24 h. Cells were harvested and washed with PBS, and then 70% ethanol was used for fixing overnight. Cells were stained by PI as mentioned above and analyzed by FCM.
Western Blot of Cyclin D1, Cyclin A2, and P21
MCF-7/ADR cells were treated with MS SLNs (50 μM), Qu (50 μM), or Qu-SS-Gcc LNPs (50 μM) for 24 h, subjected to lysis, and further analyzed using the standard western blot assay. The antibodies were used according to the corresponding manufacturer’s instructions.
Acidic Vesicular Organelle Observation
MCF-7/ADR cells were plated on coverslips in 24-well plates and incubated overnight. Following treatment with Qu (25, 50, and 100 μM) or Qu-SS-Gcc LNPs (25, 50, and 100 μM) for 24 h, cells were stained with acridine orange (1 μg/mL, 15 min), rinsed with PBS, sealed with glycerol, and observed using CLSM.
Transmission Electron Microscopy (TEM) Observation of Autophagosomes
MCF-7/ADR cells were treated with MS SLNs (50 μM), Qu (50 μM), or Qu-SS-Gcc LNPs (50 μM) for 24 h. MCF-7/ADR cells were fixed in 2.5% glutaraldehyde and treated with a series of necessary steps for the TEM observation of autophagic vacuoles in cells.
Western Blots of LC3, Beclin-1, and Atg12-Atg5
MCF-7/ADR cells were treated with Qu (50 μM) or Qu-SS-Gcc LNPs (50 μM) for 24 h, subjected to lysis, and further analyzed using the standard western blot assay. The antibodies were used according to the corresponding manufacturer’s instructions.
Cell Viability
The cytotoxicity of different nanoparticles on different cell lines was assessed by the MTT assay. In detail, cells seeded in 96-well plates (6 × 10³/well) were allowed to grow for 12 h and then with/without 20 μM chloroquine (Chl) for another 12 h. The cells were then exposed to different concentrations of different nanoparticles for 48 h and assessed by MTT using the previously reported protocol.11
Statistical Analysis
All of the data are presented as the mean value ± standard deviation from at least three independent measurements. Differences between groups were analyzed with ANOVA (one-way) followed by Tukey–Kramer tests, and mean differences with *P < 0.05 were considered as statistically significant.
Acknowledgments
This work was supported by the National Natural Science Foundation of China under Contract Nos. 81773644, 81773648, and 81573366 and Natural Science Foundation of Zhejiang Province (No. LY16H180003).
Supporting Information Available
The Supporting Information is available free of charge at https://pubs.acs.org/doi/10.1021/acsomega.0c04795.
Inhibitors used in this study and their functions as well as concentrations (Table S1); synthetic route to Qu-SS-Gcc and structural characterization (Figure S1); change of glutathione content in the MCF-7/ADR cells after treating with BSO or LPA (Figure S2); effects of different inhibitors on the transport of Qu-SS-Gcc LNPs across the MDCK cell monolayer (Figure S3); flow cytometry of P-gp in the MCF-7/ADR cells treated with indicated concentrations of Qu or Qu-SS-Gcc LNPs for 24 h (Figure S4) (PDF)
The authors declare no competing financial interest.
Supplementary Material
References
- Hollman P. C. H.; Katan M. B. Health effects and bioavailability of dietary flavonols. Free Radical Res. 1999, 31, 75. 10.1080/10715769900301351. [DOI] [PubMed] [Google Scholar]
- Ahmed J.; Gultekinoglu M.; Edirisinghe M. Bacterial cellulose micro-nano fibres for wound healing applications. Biotechnol. Adv. 2020, 41, 107549 10.1016/j.biotechadv.2020.107549. [DOI] [PubMed] [Google Scholar]
- Roy S.; Sil A.; Chakraborty T. Potentiating apoptosis and modulation of p53, Bcl2, and Bax by a novel chrysin ruthenium complex for effective chemotherapeutic efficacy against breast cancer. J. Cell Physiol. 2019, 234, 4888–4909. 10.1002/jcp.27287. [DOI] [PubMed] [Google Scholar]
- Desale J. P.; Swami R.; Kushwah V.; Katiyar S. S.; Jain S. Chemosensitizer and docetaxel-loaded albumin nanoparticle: overcoming drug resistance and improving therapeutic efficacy. Nanomedicine 2018, 13, 2759–2776. 10.2217/nnm-2018-0206. [DOI] [PubMed] [Google Scholar]
- Calgarotto A. K.; Maso V.; Junior G. C. F.; Nowill A. E.; Filho P. L. Antitumor activities of quercetin and green tea in xenografts of human leukemia HL60 cells. Sci. Rep. 2018, 8, 3459 10.1038/s41598-018-21516-5. [DOI] [PMC free article] [PubMed] [Google Scholar]
- Khan A. H.; Jiang X.; Surwase S.; Gultekinoglu M.; Bayram C.; Sathisaran I.; Bhatia D.; Ahmed J.; Wu B.; Ulubayram K.; Edirisinghe M.; Dalvi S. V. Effectiveness of oil-layered albumin microbubbles produced using microfluidic T-junctions in series for in vitro inhibition of tumor cells. Langmuir 2020, 36, 11429–11441. 10.1021/acs.langmuir.0c01557. [DOI] [PubMed] [Google Scholar]
- Jamburidze A.; Huerre A.; Baresch D.; Poulichet V.; Corato M. D.; Garbin V. Nanoparticle-coated microbubbles for combined ultrasound imaging and drug delivery. Langmuir 2019, 35, 10087–10096. 10.1021/acs.langmuir.8b04008. [DOI] [PubMed] [Google Scholar]
- Aramide B.; Kothandaraman A.; Edirisinghe M.; Jayasinghe S. N.; Ventikos Y. General computational methodology for modeling electrohydrodynamic flows: prediction and optimization capability for the generation of bubbles and fibers. Langmuir 2019, 35, 10203–10212. 10.1021/acs.langmuir.8b03763. [DOI] [PubMed] [Google Scholar]
- Alenezi H.; Muhammet E. C.; Edirisinghe M. Experimental and theoretical investigation of the fluid behavior during polymeric fiber formation with and without pressure. Appl. Phys. Rev. 2019, 6, 041401 10.1063/1.5110965. [DOI] [Google Scholar]
- Mahalingam S.; Huo S.; Shervanthi H. V.; Edirisinghe M. Generation of core–sheath polymer nanofibers by pressurised gyration. Polymers 2020, 12, 1709. 10.3390/polym12081709. [DOI] [PMC free article] [PubMed] [Google Scholar]
- Mehnert W.; Mader K. Solid lipid nanoparticles: Production, characterization and applications. Adv. Drug Delivery Rev. 2001, 47, 165. 10.1016/S0169-409X(01)00105-3. [DOI] [PubMed] [Google Scholar]
- Chai G. H.; Hu F. Q.; Sun J. H.; Du Y. Z.; You J.; Yuan H. Transport pathways of solid lipid nanoparticles across madin-darby canine kidney epithelial cell monolayer. Mol. Pharmaceutics 2014, 11, 3716. 10.1021/mp5004674. [DOI] [PubMed] [Google Scholar]
- Chai G. H.; Xu Y. K.; Chen S. Q.; Cheng B. L.; Hu F. Q.; You J. A.; Du Y. Z.; Yuan H. Transport mechanisms of solid lipid nanoparticles across Caco-2 cell monolayers and their related cytotoxicology. ACS Appl. Mater. Interfaces 2016, 8, 5929. 10.1021/acsami.6b00821. [DOI] [PubMed] [Google Scholar]
- Rautio J.; Kumpulainen H.; Heimbach T.; Oliyai R.; Oh D.; Järvinen T.; Savolainen J. Prodrugs: design and clinical applications. Nat. Rev. Drug Discovery 2008, 7, 255–270. 10.1038/nrd2468. [DOI] [PubMed] [Google Scholar]
- Han H. K.; Amidon G. L. Targeted prodrug design to optimize drug delivery. AAPS PharmSci. 2000, 2, 48–58. 10.1208/ps020106. [DOI] [PMC free article] [PubMed] [Google Scholar]
- Liederer B. M.; Borchardt R. T. Enzymes involved in the bioconversion of ester-based prodrugs. J. Pharm. Sci. 2006, 95, 1177–1195. 10.1002/jps.20542. [DOI] [PubMed] [Google Scholar]
- Chen S. Q.; Wang C.; Tao S.; Wang Y. X.; Hu F. Q.; Yuan H. Rational design of redox-responsive and P-gp-inhibitory lipid nanoparticles with high entrapment of paclitaxel for tumor therapy. Adv. Healthcare Mater. 2018, 7, 1800485 10.1002/adhm.201800485. [DOI] [PubMed] [Google Scholar]
- Kobayashi H.; Takemura Y. Quantitative analysis of multidrug resistance phenotype in hematological malignancies. Rinsho Byori 1998, 46, 380. [PubMed] [Google Scholar]
- Graña X.; Reddy E. P. Cell cycle control in mammalian cells: role of cyclins, cyclin dependent kinases (CDKs), growth suppressor genes and cyclin-dependent kinase inhibitors (CKIs). Oncogene 1995, 11, 211–219. [PubMed] [Google Scholar]
- Zhang Y.; Chen S.; Wei C.; Rankin G. O.; Ye X.; Chen Y. C. Flavonoids from chinese bayberry leaves induced apoptosis and g1 cell cycle arrest via erk pathway in ovarian cancer cells. Eur. J. Med. Chem. 2018, 147, 218–226. 10.1016/j.ejmech.2018.01.084. [DOI] [PMC free article] [PubMed] [Google Scholar]
- Calgarotto A. K.; Maso V.; Junior G. C. F.; Nowill A. E.; Filho P. L.; Vassallo J.; Saad S. T. O. Antitumor activities of Quercetin and Green Tea in xenografts of human leukemia HL60 cells. Sci. Rep. 2018, 8, 3459 10.1038/s41598-018-21516-5. [DOI] [PMC free article] [PubMed] [Google Scholar]
- Granado-Serrano A. B.; Martín M. A.; Bravo L.; Goya L.; Ramos S. Quercetin induces apoptosis via caspase activation, regulation of Bcl-2, and inhibition of PI-3-kinase/Akt and ERK pathways in a human hepatoma cell line (HepG2). J. Nutr. 2006, 136, 2715–2721. 10.1093/jn/136.11.2715. [DOI] [PubMed] [Google Scholar]
- Johnson V. L.; Ko S. C. W.; Holmstrom T. H.; Eriksson J. E.; Chow S. C. Effector caspases are dispensable for the early nuclear morphological changes during chemical-induced apoptosis. J. Cell Sci. 2000, 113, 2941–2953. [DOI] [PubMed] [Google Scholar]
- Dunn W. A. Autophagy and related mechanisms of lysosome-mediated protein degradation. Trends Cell Biol. 1994, 4, 139–143. 10.1016/0962-8924(94)90069-8. [DOI] [PubMed] [Google Scholar]
- Jia L. J.; Huang S.; Yin X. R.; Zan Y.; Guo Y.; Han L. L. Quercetin suppresses the mobility of breast cancer by suppressing glycolysis through Akt-mTOR pathway mediated autophagy induction. Life Sci. 2018, 208, 123–130. 10.1016/j.lfs.2018.07.027. [DOI] [PubMed] [Google Scholar]
- Liu Y.; Gong W.; Yang Z. Y.; Zhou X. S.; Gong C.; Zhang T. R.; Wei X.; Ma D.; Ye F.; Gao Q. L. Quercetin induces protective autophagy and apoptosis through ER stress via the p-STAT3/Bcl-2 axis in ovarian cancer. Apoptosis 2017, 22, 544–557. 10.1007/s10495-016-1334-2. [DOI] [PubMed] [Google Scholar]
- Granato M.; Rizzello C.; Montani M. S. G.; Cuomo L.; Vitillo M.; Santarelli R.; Gonnella R.; D’Orazi G.; Faggioni A.; Cirone M. Quercetin induces apoptosis and autophagy in primary effusion lymphoma cells by inhibiting PI3K/AKT/mTOR and STAT3 signaling pathways. J. Nutr. Biochem. 2017, 41, 124–136. 10.1016/j.jnutbio.2016.12.011. [DOI] [PubMed] [Google Scholar]
- Paglin S.; Hollister T.; Delohery T.; Hackett N.; McMahill M.; Sphicas E. A novel response of cancer cells to radiation involves autophagy and formation of acidic vesicles. Cancer Res. 2001, 61, 439–444. [PubMed] [Google Scholar]
- Kabeya Y.; Mizushima N.; Ueno T.; Yamamoto A.; Kirisako T.; Noda T. LC3, a mammalian homologue of yeast Apg8p, is localized in autophagosome membranes after processing. EMBO J. 2000, 19, 5720–5728. 10.1093/emboj/19.21.5720. [DOI] [PMC free article] [PubMed] [Google Scholar]
- UMA K. A.; Komatsu M.; Mizushima N. Autophagy-monitoring and autophagy-deficient mice. Autophagy 2017, 13, 1619–1628. 10.1080/15548627.2017.1343770. [DOI] [PMC free article] [PubMed] [Google Scholar]
- Gallagher L. E.; Williamson L. E.; Chan E. Y. W. Advances in autophagy regulatory mechanisms. Cell 2016, 5, 24. 10.3390/cells5020024. [DOI] [PMC free article] [PubMed] [Google Scholar]
- Gatica D.; Hu G. W.; Liu X.; Zhang N. N.; Williamson P. R.; Klionsky D. J. The Pat1-Lsm complex stabilizes ATG mRNA during nitrogen starvation-induced autophagy. Mol. Cell 2019, 73, 314. 10.1016/j.molcel.2018.11.002. [DOI] [PMC free article] [PubMed] [Google Scholar]
- Padman B. S.; Nguyen T. N.; Uoselis L.; Skulsuppaisarn M.; Nguyen L. K.; Lazarou M. LC3/GABARAPs drive ubiquitin-independent recruitment of Optineurin and NDP52 to amplify mitophagy. Nat. Commun. 2019, 10, 408 10.1038/s41467-019-08335-6. [DOI] [PMC free article] [PubMed] [Google Scholar]
- Hu X. H.; Mullins R. D. LC3 and STRAP regulate actin filament assembly by JMY during autophagosome formation. J. Cell Biol. 2019, 218, 251–266. 10.1083/jcb.201802157. [DOI] [PMC free article] [PubMed] [Google Scholar]
Associated Data
This section collects any data citations, data availability statements, or supplementary materials included in this article.


