Abstract
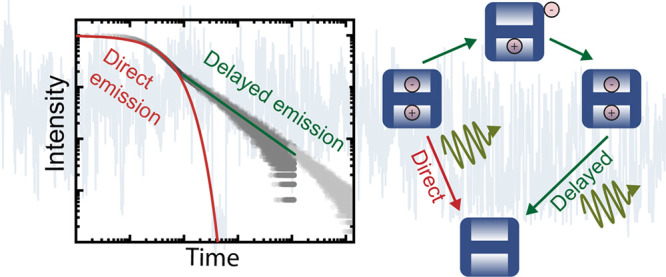
A common signature of nearly all nanoscale emitters is fluorescence intermittency, which is a rapid switching between “on”-states exhibiting a high photon emission rate and “off”-states with a much lower rate. One consequence of fluorescence intermittency occurring on time scales longer than the exciton decay time is the so-called delayed photon emission, manifested by a long radiative decay component. Besides their dominant fast radiative decay, fully inorganic cesium lead halide perovskite quantum dots exhibit a long fluorescence decay component at cryogenic temperatures that is often attributed to the decay of the dark exciton. Here, we show that its origin is delayed photon emission by investigating temporal variations in fluorescence intensity and concomitant decay times found in single CsPbBr3 perovskite quantum dots. We attribute the different intensity levels of the intensity trace to a rapid switching between a high-intensity exciton state and an Auger-reduced low-intensity trion state that occurs when the excitation is sufficiently strong. Surprisingly, we observe that the exponent of this power-law-dependent delayed emission is correlated with the emission intensity, which cannot be explained with existing charge carrier trapping models. Our analysis reveals that the long decay component is mainly governed by delayed emission, which is present in both the exciton and trion state. The absence of a fine structure in trions clarifies the vanishing role of the dark exciton state for the long decay component. Our findings are essential for the development of a complete photophysical model that captures all observed features of fluorescence variations in colloidal nanocrystals.
Keywords: perovskites, nanocrystals, quantum dots, blinking, fluorescence intermittency, delayed emission
Since the reproducible synthesis of colloidally stable nanocrystals, improvements of their emission properties in terms of stability and efficiency has been the major thrust.1,2 A mechanism that reduces the emission efficiency of colloidal nanocrystals is their tendency to randomly switch from a highly emissive state to a state with strongly reduced or no emission.3−6 It can take up to several minutes for the nanocrystal to revert to a highly emissive state, which consequently reduces their overall brightness. In the past, a connection between the emission intensity and the photoluminescence decay time was established,7 and two different types of blinking have been reported: one in which lower intensity levels correlate with shorter photoluminescence lifetimes (A-type) and a second type where the intensity is not correlated with the photoluminescence lifetime (B-type).8 In the blinking model for quantum dots proposed by Efros and Rosen,9 a charge carrier is ejected from the quantum dot and trapped in an acceptor-like state. When the trapped charge carrier returns to the quantum dot, it forms again an exciton that subsequently decays by emitting a photon. Photon emission that occurs due to the recovery of a trapped charge carrier on a nanosecond to microsecond time scale appears as the so-called delayed photon emission, which follows a power-law distribution in the histogram of delay times.10,11
Recently, a novel type of semiconductor nanocrystal, namely fully inorganic lead halide perovskite nanocrystals,12 was introduced that possesses outstanding optical properties.13−17 Several reports on blinking-free emission of single perovskite quantum dots with photostability over minutes have been reported,18,19 even though these nanocrystals do not contain a passivating shell. Compared to highly engineered core–shell nanocrystals of metal chalcogenides, some perovskite compositions show strongly reduced blinking events (see also Supporting Information S1). Contrary to these findings, other reports show that some perovskite nanocrystals are subject to fluorescence intermittency,20−22 and the corresponding delayed emission has been reported.23−25
In this work, we investigate the fluorescence intermittency (also known as blinking) and the connected delayed fluorescence of single CsPbBr3 perovskite quantum dots at cryogenic temperatures. We find that blinking is related to a random switching between a highly emissive exciton state and a trion state with reduced emission intensity, representing A-type blinking behavior. Furthermore, we discovered that both exciton and trion states, which are clearly resolved at cryogenic temperatures, possess a long decay component that follows a power-law distribution. This slow component in the photoluminescence decay of perovskite nanocrystals has been interpreted so far as being the decay of the dark exciton state.26−29 However, this contradicts the power-law dependence of the long decay component, since the decay from an excited state would result in an exponential decay with a fixed decay time. Furthermore, the long decay component of the trion state cannot be explained with the recombination of a dark exciton since the trion state does not possess a fine structure. Hence, we attribute the long decay component to delayed exciton emission, which has been observed in many quantum dot systems.10,11,30 We present a microscopic model based on existing charging models to explain the experimental observations and supply further validation by dynamical Monte Carlo simulations. These findings provide important insights for the microscopic understanding of fluorescence intermittency, which is crucial for the development of highly efficient bright quantum emitters.
Results and Discussion
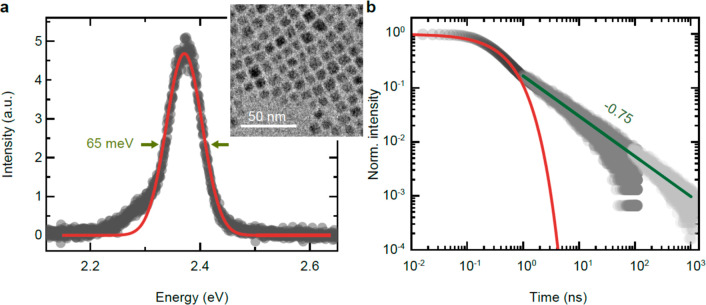
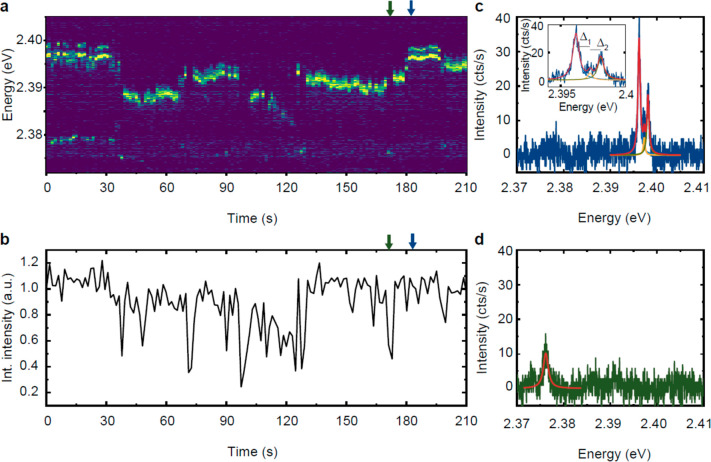
We start with investigating an ensemble of CsPbBr3 quantum dots with a lateral size of 6.2 ± 0.4 nm (see Supporting Information S2), as depicted in the inset of Figure 1a. The ensemble emission at 5 K peaks at 2.37 eV and shows a rather broad full-width at half-maximum of 65 meV, compared to CsPbBr3 nanocrystals of larger size, where the full-width at half-maximum is around 10 meV.14 For larger crystals, which are in the so-called intermediate or weak confinement regime, the emission energy is much less affected by size variations than for smaller nanocrystals. Hence, it is expected that the smaller 6 nm nanocrystals exhibit a larger inhomogeneous broadening. They are on the verge of strong confinement, with an exciton Bohr diameter of 7 nm.31 In Figure 1b, the photoluminescence decay of an ensemble of CsPbBr3 nanocrystals is shown over 5 orders of magnitude in delay time. Up to 1 ns, the photoluminescence decay follows an exponential decay with a typical exciton decay time of 448 ± 6 ps, which is in good agreement with previously reported data.13 However, after 1 ns, the emitted photoluminescence clearly deviates from an exponential decay and can be described with a power-law dependence with an exponent of −0.75 ± 0.03. To discern the origin of the long component in more detail, we investigated single perovskite nanocrystals at 5 K. Despite that CsPbBr2Cl and CsPbBr3 QDs display reduced blinking at cryogenic temperatures,14 we focus our investigation on QDs that exhibit photoluminescence blinking, which could return important specifics of the exciton and charge complex dynamics. Here, we provide an in-depth analysis for a representative CsPbBr3 quantum dot exhibiting fluorescence intermittency that can be used to gain further insight into the decay mechanisms of excitons and trions. Measurements on additional quantum dots exhibit similar blinking behavior (see Supporting Information S3 and S4). Consecutive photoluminescence emission spectra of a single CsPbBr3 quantum dot are shown in Figure 2a. In this time-dependent spectral series, we observe a fine structure splitting of the high-energy exciton emission. The exciton emission peaks are subject to spectral diffusion, which is evidence that we are measuring a single nanocrystal.32 Here, we excite the single nanocrystal at a repetition rate of 40 MHz with an excitation fluence of 0.2 μJ cm–2, which is sufficiently strong to observe significant temporal fluorescence variations. In Figure 2b, we plot the spectrally integrated intensity of each spectrum as a function of time, and we observe that the intensity occasionally drops for individual spectra. In Figure 2c and d, we show spectra with high (blue) and low (green) intensity, respectively (indicated by the blue and green arrows in a and b). The blue high-intensity spectrum shows a single exciton-emission spectrum from a quantum dot emitting at 2.397 eV subject to an exciton fine structure with three emission peaks and an energetic splitting of Δ1 = 1.1 meV and Δ2 = 0.8 meV between the low and intermediate energy peaks and the intermediate and high energy peaks, respectively (see inset). The Lorentzian fit reveals full-widths at half-maxima of 585, 439, and 561 μeV for the three peaks, in the order of their increasing emission energy. Due to the small amplitude of the middle-energy peak, mainly the high- and low-energy emission peaks are visible. The green low-intensity spectrum, however, shows an emission peak that is red-shifted by roughly 20 meV with a strongly reduced maximum intensity, a full-width at half-maximum of 1.2 meV, and no visible fine structure. Hence, we attribute this emission peak to trion emission. When the intensity of the exciton emission drops, we observe a trion emission peak (Figure 2a). The intensity of the trion emission is strongly reduced due to Auger recombination that typically quenches the photoluminescent emission of semiconductor nanocrystals. However, trion emission is not completely quenched but reduced to approximately 40%, calculated from the ratio of the peak areas ITrion/IExciton, implying that the Auger rate ΓAugerTrion of the trion state is comparable with its radiative decay rate ΓradTrion. By correlating Figure 2a and b, we observe that the intensity levels are slightly affected by spectral diffusion, probably due to some external charges that redistribute local electric fields.33 Such fields might also change the Auger recombination rate and even the trapping and detrapping rate, thereby affecting the overall emission intensity.
Figure 1.
Photoluminescence emission properties of CsPbBr3 nanocrystals with a size of 6 nm. (a) Photoluminescence spectrum of an ensemble of CsPbBr3 nanocrystals at 5 K. The fwhm of the Gaussian fit (red line) is 65 meV. The inset shows a TEM image of CsPbBr3 NCs. (b) Normalized photoluminescence decay measured over 5 orders of magnitude. The decay trace is stitched together from three different measurements, recorded with different time bins and excited with different repetition rates of 10 MHz, 250 kHz, and 32 kHz for the dark, medium, and light gray decay traces, respectively. The decay trace up to 1 ns is fitted with a single-exponential decay (red curve). We fit the decay from 1 to 100 ns with a power-law-dependent fit (green line).
Figure 2.
Emission states of a single CsPbBr3 quantum dot. (a) Time-dependent spectral series of a single CsPbBr3 nanocrystal at 5 K, excited with 0.2 μJ cm–2 and recorded with 1 s integration time. The emission is subject to spectral diffusion. (b) Spectrally integrated intensity of the recorded spectra in (a). (c, d) Photoluminescence spectrum taken from (a) with a high intensity (c), showing an exciton emission peak with fine structure splitting, and a low intensity spectrum (d), showing a trion emission spectrum. Blue and green arrows in (a) and (b) indicate where the high- and low-intensity spectra were taken from, respectively. The emission peaks are fitted with a Lorentzian function (red, green, yellow, and light blue solid line). Inset: Zoom-in to the exciton emission peak with indicated energetic fine structure splitting.
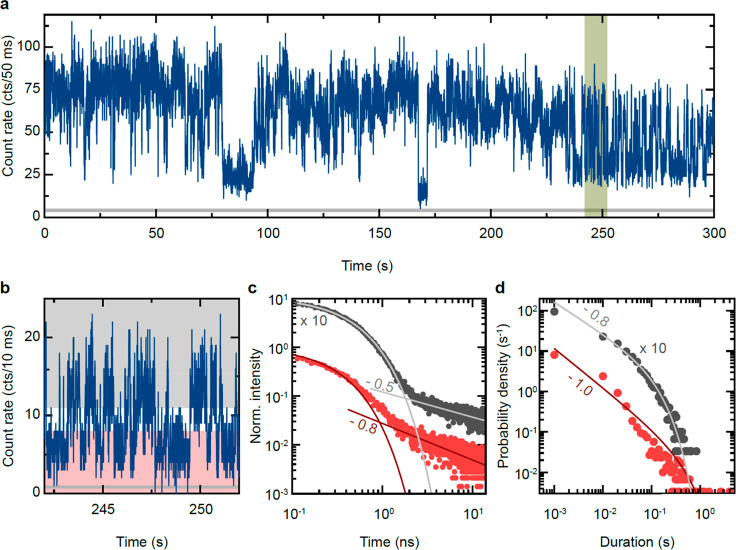
To investigate the fluorescence intermittency periods in more detail, we employ time-tagged time-resolved (TTTR) measurements of the same quantum dot. Figure 3a shows an intensity–time trace of the same single quantum dot and the same excitation conditions as in Figure 2. The intensity–time trace was recorded for 5 min and is shown with a bin size of 50 ms, exhibiting clear signs of fluorescence intermittency. In “off”-periods, the intensity drops to roughly 30–40% of the “on”-periods, being in good agreement with the intensity ratio ITrion/IExciton of the exciton and trion emission spectrum. The averaged background intensity is displayed as a gray horizontal bar in the intensity–time trace (see Supporting Information S5). For the following evaluation of the TTTR measurement, we used a bin size of 10 ms. For example, we plotted the intensity–time trace over a time scale of 10 s (highlighted as the green-shaded area in Figure 3a) with a bin size of 10 ms in Figure 3b. Here too, we observe a rapid switching between high-intensity and low-intensity levels. We evaluate the intensity level for every bin of the 30 000 bins in the intensity–time trace and sort them according to their intensity. The red- and gray-shaded areas indicate the intensity ranges used for the following analysis. In Figure 3c, we plot the normalized photoluminescence decay after the excitation pulse in a log–log plot for the high- and low-intensity range in gray and red, respectively. In both cases, we observe an initial single-exponential decay followed by a power-law decay, similar to the findings at the ensemble level in Figure 1b. The initial fast decay of the high- and low-intensity ranges resembles the exciton and trion decay times, being τX = 398 ± 5 ps and τT = 261 ± 6 ps, in good agreement with reported values.13,19 Additionally, both photoluminescence-decay curves exhibit a long decay component, fitted well by a power law (I(t) = tα) with exponents of αX = −0.5 ± 0.1 and αT = −0.8 ± 0.1 for the high-intensity (exciton) and low-intensity (trion) emission states, respectively. The long decay component for the low-intensity trion state cannot originate from a dark state since a trion state does not possess fine structure. Furthermore, this observation can also not be explained with existing models of delayed fluorescence as discussed below. In Figure 3d, we show the probability distribution of the duration of high- (gray) and low-intensity (red) periods of the intensity–time trace in Figure 3a with a bin size of 10 ms. Both distributions follow a truncated power-law distribution and are fitted with the function ∼tαe(−t/tc), using the weight function wi = 1/yi. We find exponents αlow = −1.0 ± 0.1 and αhigh = −0.7 ± 0.1 and cutoff times tchigh = 0.11 ± 0.02 s and tclow= 0.49 ± 0.19 s. These exponents αlow/high slightly deviate from the exponents of the long decay components, which were observed in other quantum dot systems.10,11
Figure 3.
Fluorescence intermittency of a single CsPbBr3 quantum dot. (a) Intensity trace of the emission intensity from an individual CsPbBr3 quantum dot at cryogenic temperatures with a bin size of 50 ms, revealing strong fluorescence intermittency. The gray horizontal line represents the averaged intensity of the background luminescence. (b) Segment of the intensity trace from (a) binned with 10 ms. Gray- and red-shaded areas represent the intensity ranges used to construct the photoluminescence decay in (c) and the probability distribution in (d). (c) Photoluminescence decay trace of two different intensity levels indicated in (b). The initial exponential decay times are different for the high- and low-intensity levels, known as A-type blinking behavior. In addition, the second decay components that follow a power-law decay show different exponents αX,T. (d) Probability distribution of the duration of high (gray) and low (red) intensity periods of the intensity trace in (a), binned with 10 ms. Solid lines represent fits with a truncated power-law function.
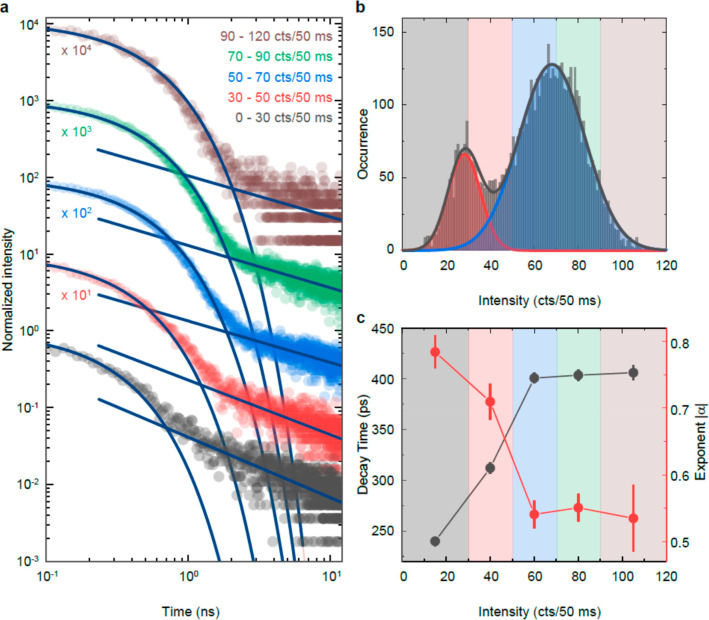
To analyze the intensity-dependent photoluminescence decay from Figure 3c in more detail, we define five intensity ranges and plot the resulting photoluminescence decay and the respective fits in Figure 4a. The intensity histogram is shown in Figure 4b, where the color-coded intensity levels from Figure 4a are shown shaded in the background. As expected, the intensity histogram reveals two clearly distinct intensity levels that we attributed to the exciton and trion emission that can be well approximated by two Gaussian distributions. The decay time of the exponential fit of the initial decay and the absolute value of the exponent of the power-law fit to the long decay component are summarized in Figure 4c. The fit parameters of the highest three intensity ranges are constant, and we obtain a decay time of ∼400 ps and an exponent in the range of −0.5 to −0.6. However, this trend changes at low-intensity levels, where a decrease of decay time can be seen due to the A-type blinking behavior. Similarly, the exponent of the power-law-dependent long decay component changes to −0.8, and it appears that both the initial and the long decay component are correlated.
Figure 4.
Intensity-dependent photoluminescence decay. (a) Photoluminescence decays for five different emission intensity ranges as specified in (b). Solid lines are best fits (exponential decay and power-law dependence) to the data. (b) Intensity histogram of the intensity trace in Figure 3a exhibiting two intensity peaks. The intensity ranges used to build intensity-dependent photoluminescence decay traces in (a) are visualized by the color-coded shaded background in the plot. (c) Decay time of the exponential fit and absolute exponent of the power-law fit obtained from (a) as a function of the emission intensity.
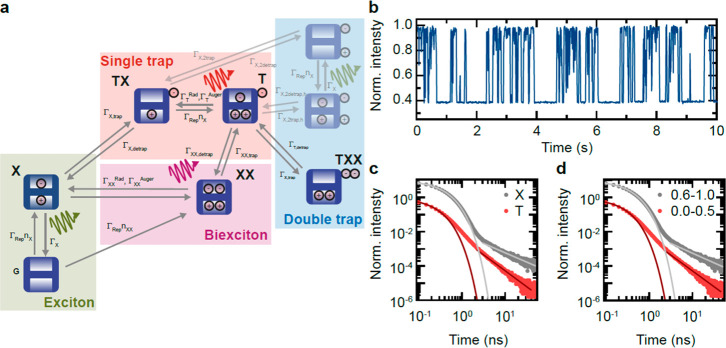
This is a clear indication for delayed fluorescence from a trion state. It is inconsistent with existing models of delayed fluorescence. To fully explain this observation, one needs to extend the fundamental charging model9 and include the existence of multiexcitons as proposed by Ye etal.34 (see Figure 5a). In the charging model, one charge carrier is trapped in an acceptor-like state. This process can happen via either an Auger ionization event of a doubly excited quantum dot, thermal excitation, or resonant tunneling of one of the charge carriers to the charge-separated state. The remaining charge carrier in the quantum dot together with subsequent electron–hole pairs undergoes fast Auger-like nonradiative relaxation to the ground state, thus transferring the quantum dot to an “off”-state in which fewer or no photons are emitted.5 As shown in Figure 5a, a detrapping process of the trapped charge carrier re-establishes a single-exciton state, whose recombination leads to the emission of a delayed photon. The power-law statistics of the delayed fluorescence is explained by the power-law statistics of the occurrence of detrapping rates.10 In our measurements we observe emission from a trion state with reduced intensity due to Auger recombination. However, it is possible that an additional charge carrier of this trion is trapped in a second charge-separated state, as we show in our extended charging model in Figure 5a. If two electrons or two holes are trapped, a subsequent detrapping process can lead to delayed fluorescence of the trion state. Clearly, this model can be further extended to include also multiexcitons. For simplicity, we only include biexcitons in this model and assume that both trapped charge carriers are the same. Using the standard kinetic Monte Carlo method, the blinking time trace and the fluorescence decay traces of the exciton and the trion (see Figure 5b,c) can be modeled. We simulate pulsed excitation and select the parameters according to our measurement results (see Supporting Information S6 and S7). In Figure 5b we plot the normalized simulated time trace over 10 s with a bin size of 10 ms. Our simulation also results in two intensity levels, and we can furthermore plot the simulated exciton and trion decay time where we observe quantitative agreement between our model and the experiments (see Supporting Information S7). Here, the exciton and trion decay also possess a fast exponential decay and a long decay component that follows a power law. This is the result of the power-law distributed detrapping rates, where fast detrapping rates have a much higher probability compared to the slow ones. If this is not the case, the quantum dot would be mainly in the “off”-state. However, the actual distribution is unknown and could deviate from a power-law distribution with one exponent. Depending on the trapping and detrapping rates of the quantum dot, this model moreover naturally explains the occurrence of two or three intensity levels, as it is sometimes observed in experiment (see Supporting Information S8).35
Figure 5.
Monte Carlo simulation: (a) Extended trapping model with corresponding rates. (b) Normalized simulated time trace over 10 s with 10 ms bins. (c) Simulated exciton and trion decays. Both decay traces show a single-exponential decay followed by power-law decay. (d) Extracted decays, binned according to the intensity ranges.
Conclusions
In conclusion, we have observed delayed fluorescence from single cesium lead halide perovskite nanocrystals and ensembles thereof. The delayed emission gives rise to a long decay component in single-photon time-resolved measurements, following a power-law distribution with typical exponents in the range from −0.5 to −1.0. Investigating the blinking dynamics of single CsPbBr3 nanocrystals, we could assign low-intensity emission states to dim emission of trions and high-intensity emission states to mainly excitonic emission. In time-tagged time-resolved measurements, we studied the blinking characteristics and observed a fast switching between high-intensity (“on”) states and low-intensity states. Plotting the photoluminescence decay time of the distinct intensity levels reveals that not only the high-intensity emission (mainly excitonic emission) comprises a long decay component but also the low-intensity emission, as mainly identified as trion emission. This implies that there is a similar trapping mechanism for the trion state, as has been identified for the exciton state. The delayed emission follows in both cases a power-law distribution. The absolute value of the exponent of the low-intensity emission is always higher compared to the exponent of the high-intensity emission. For a better understanding, we use a standard Monte Carlo approach and an extended charging model to emulate the dynamics of single perovskite quantum dots, showing good quantitative agreement. The reason why CsPbBr2Cl nanocrystals do not show fluorescence intermittency is probably due to slow Auger rates and the shorter time scales of charge release/detrapping events compared to CsPbBr3 and CsPbI3 nanocrystals. Our result confirms that the dark exciton state is not responsible for the long decay component, providing further important input for photophysical models of the extraordinary optoelectronic properties of cesium lead halide nanocrystals.
Methods
Synthesis
Preparation of CsDOPA 0.144 M in toluene: Cs2CO3 (200 mg, 0.61 mmol), toluene (7.5 mL), and diisoctylphosphinic acid (DOPA, 1.0 mL) were stirred at about 100 °C until the solution became clear. Synthesis of CsPbBr3 nanocrystals: PbBr2 (36 mg, 0.10 mmol), ZnBr2 (95 mg, 0.42 mmol), dihexadecyldimethylammonium bromide (DHDMAB, 44 mg, 0.08 mmol), trioctylphosphine (TOP, 3 mL), and toluene (3 mL) were stirred under inert conditions at about 100 °C in a 25 mL flask until a clear solution was formed. The temperature was adjusted to 60 °C. At this temperature, 0.4 mL of the CsDOPA precursor was swiftly injected. After 15 s, the reaction was quenched with an ice bath. Washing of the nanocrystals: Ethyl acetate (18 mL) was added to the crude solution. The mixture was centrifuged for 5 min at 12.1 krpm. The formed supernatant was discarded and the precipitate was dispersed in cyclohexane or hexane (6 mL). The solution was filtered with a syringe filter (0.45 μm pore size).
Sample Preparation
The quantum-dot solution was diluted 200 times, and 20 μL of the diluted solution was added to 1 mL of 3 wt% SEBS (styrene–ethylene–butylene–styrene, a thermoplastic elastomer) in anhydrous toluene. The solution was spin-coated on a silicon substrate with a 3 μm thick layer of thermally oxidized SiO2. Beforehand, the substrate was thoroughly cleaned using acetone and isopropanol. To get rid of any remaining organics, the substrate was additionally cleaned using an oxygen plasma at 600 W for 5 min. For ensemble measurements, the quantum-dot solution was added to a 3 wt% solution of SEBS in anhydrous toluene and spin-coated onto a glass substrate.
Optical Characterization
For the ensemble measurements, the sample was cooled to 5 K in an exchange-gas cryostat and excited with a fiber-coupled excitation laser at a photon energy of 3.06 eV with pulses of 50 ps duration at different repetition rates (see caption of Figure 1b). The emission was collected with an 80 mm focal length lens and long-pass filtered. The recorded photoluminescence was dispersed by a grating with 300 lines per mm in a 500 mm spectrograph and detected by a cooled, back-illuminated CCD camera. For single-nanocrystal measurements, the sample was mounted on an xyz nanopositioning stage inside an evacuated liquid-helium coldfinger cryostat and cooled to 5 K. Single nanocrystals were excited with the same fiber-coupled excitation laser system as for the ensemble measurements. A long-working-distance 100× microscope objective with a numerical aperture of 0.7 was used for both excitation and detection, leading to a Gaussian excitation spot with a 1/e2 diameter of 1.4 μm. After collection, the emission was sent through narrow band-pass filters and dispersed in a 750 mm monochromator by an 1800 lines per mm grating and detected with a back-illuminated, cooled EMCCD camera.
Fluorescence Decay Fit
The normalized decay functions obtained in time-resolved single-photon counting measurements are fitted as follows: First we fit the exponential decay using a least-squares Levenberg–Marquardt algorithm with the fit function y(x) = A exp(−x/τ). Here, A is the amplitude and τ the 1/e-decay time. Then to fit the power-law-dependent long-decay component, we fit the logarithm of the measured decay on a logarithmic x-scale with a linear function, y(x) = mx + b, using again a least-squares Levenberg–Marquardt algorithm. To display the deviation from the exponential fit and to highlight the different power-law exponents, the fit curves have been extended over the fitting range in Figures 1b, 3c, 4a, and 5c,d.
Acknowledgments
M.A.B. and T.S. acknowledge support by QuantERA project RouTe (SNSF Grant No. 20QT21_175389). D.J.N. acknowledges the support by the European Research Council under the European Union’s Seventh Framework Program (FP/2007-2013)/ERC Grant Agreement No. 339905 (QuaDoPS Advanced Grant). M.V.K., C.B., and M.B. acknowledge financial support from the project INFRASTRUCTURE/1216/0004 (“NANOSONICS”), which is cofinanced by the European Regional Development Fund and the Republic of Cyprus through the Research & Innovation Foundation. M.V.K. acknowledges the support by the European Research Council under the Horizon 2020 Framework Program (ERC Consolidator Grant SCALE-HALO Grant Agreement No. 819740).
Supporting Information Available
The Supporting Information is available free of charge at https://pubs.acs.org/doi/10.1021/acsnano.0c04401.
Further information and data plots about the blinking statistics of individual CsPbBr2Cl and CsPbBr3 quantum dots, the nanocrystal size distribution, an analysis of the background fluorescence signal, the microscopic trapping model, and the Monte Carlo simulations (PDF)
Author Present Address
# Max Planck Institute for the Science of Light, Staudstraße 2, 91058 Erlangen, Germany.
Author Contributions
M.A.B. performed the optical experiments, the data analysis, and the simulations, supervised by D.J.N. and R.F.M. G.R. and T.S. built the optical setup and helped with the analysis and interpretation of the data. C.B. and M.I.B. synthesized and characterized the material, supervised by M.V.K. All authors contributed to the manuscript and have given approval to the final version of the manuscript.
The authors declare no competing financial interest.
Supplementary Material
References
- Murray C. B.; Norris D. J.; Bawendi M. G. Synthesis and Characterization of Nearly Monodisperse CdE (E = Sulfur, Selenium, Tellurium) Semiconductor Nanocrystallites. J. Am. Chem. Soc. 1993, 115, 8706. 10.1021/ja00072a025. [DOI] [Google Scholar]
- Dabbousi B. O.; Rodriguez-Viejo J.; Mikulec F. V.; Heine J. R.; Mattoussi H.; Ober R.; Jensen K. F.; Bawendi M. G. (CdSe)ZnS Core–Shell Quantum Dots: Synthesis and Characterization of a Size Series of Highly Luminescent Nanocrystallites. J. Phys. Chem. B 1997, 101, 9463. 10.1021/jp971091y. [DOI] [Google Scholar]
- Nirmal M.; Dabbousi B. O.; Bawendi M. G.; Macklin J.; Trautman J.; Harris T.; Brus L. E. Fluorescence Intermittency in Single Cadmium Selenide Nanocrystals. Nature 1996, 383, 802. 10.1038/383802a0. [DOI] [Google Scholar]
- Cordones A. A.; Leone S. R. Mechanisms for Charge Trapping in Single Semiconductor Nanocrystals Probed by Fluorescence Blinking. Chem. Soc. Rev. 2013, 42, 3209. 10.1039/c2cs35452g. [DOI] [PubMed] [Google Scholar]
- Efros A. L.; Nesbitt D. J. Origin and Control of Blinking in Quantum Dots. Nat. Nanotechnol. 2016, 11, 661. 10.1038/nnano.2016.140. [DOI] [PubMed] [Google Scholar]
- Frantsuzov P.; Kuno M.; Janko B.; Marcus R. A. Universal Emission Intermittency in Quantum Dots, Nanorods and Nanowires. Nat. Phys. 2008, 4, 519. 10.1038/nphys1001. [DOI] [Google Scholar]
- Schlegel G.; Bohnenberger J.; Potapova I.; Mews A. Fluorescence Decay Time of Single Semiconductor Nanocrystals. Phys. Rev. Lett. 2002, 88, 137401. 10.1103/PhysRevLett.88.137401. [DOI] [PubMed] [Google Scholar]
- Galland C.; Ghosh Y.; Steinbrück A.; Sykora M.; Hollingsworth J. A.; Klimov V. I.; Htoon H. Two Types of Luminescence Blinking Revealed by Spectroelectrochemistry of Single Quantum Dots. Nature 2011, 479, 203. 10.1038/nature10569. [DOI] [PMC free article] [PubMed] [Google Scholar]
- Efros A. L.; Rosen M. Random Telegraph Signal in the Photoluminescence Intensity of a Single Quantum Dot. Phys. Rev. Lett. 1997, 78, 1110. 10.1103/PhysRevLett.78.1110. [DOI] [Google Scholar]
- Rabouw F. T.; Kamp M.; van Dijk-Moes R. J.; Gamelin D. R.; Koenderink A. F.; Meijerink A.; Vanmaekelbergh D. Delayed Exciton Emission and Its Relation to Blinking in CdSe Quantum Dots. Nano Lett. 2015, 15, 7718. 10.1021/acs.nanolett.5b03818. [DOI] [PubMed] [Google Scholar]
- Whitham P. J.; Marchioro A.; Knowles K. E.; Kilburn T. B.; Reid P. J.; Gamelin D. R. Single-Particle Photoluminescence Spectra, Blinking, and Delayed Luminescence of Colloidal CuInS2 Nanocrystals. J. Phys. Chem. C 2016, 120, 17136. 10.1021/acs.jpcc.6b06425. [DOI] [Google Scholar]
- Protesescu L.; Yakunin S.; Bodnarchuk M. I.; Krieg F.; Caputo R.; Hendon C. H.; Yang R. X.; Walsh A.; Kovalenko M. V. Nanocrystals of Cesium Lead Halide Perovskites (CsPbX3, X = Cl, Br, and I): Novel Optoelectronic Materials Showing Bright Emission with Wide Color Gamut. Nano Lett. 2015, 15, 3692. 10.1021/nl5048779. [DOI] [PMC free article] [PubMed] [Google Scholar]
- Becker M. A.; Vaxenburg R.; Nedelcu G.; Sercel P. C.; Shabaev A.; Mehl M. J.; Michopoulos J. G.; Lambrakos S. G.; Bernstein N.; Lyons J. L.; Stöferle T.; Mahrt R. F.; Kovalenko M. V.; Norris D. J.; Rainò G.; Efros A. L. Bright Triplet Excitons in Caesium Lead Halide Perovskites. Nature 2018, 553, 189. 10.1038/nature25147. [DOI] [PubMed] [Google Scholar]
- Rainò G.; Becker M. A.; Bodnarchuk M. I.; Mahrt R. F.; Kovalenko M. V.; Stöferle T. Superfluorescence from Lead Halide Perovskite Quantum Dot Superlattices. Nature 2018, 563, 671. 10.1038/s41586-018-0683-0. [DOI] [PubMed] [Google Scholar]
- Utzat H.; Sun W.; Kaplan A. E. K.; Krieg F.; Ginterseder M.; Spokynov B.; Klein N. D.; Shulenberger K. E.; Perkinson C. F.; Kovalenko M. V.; Bawendi M. G. Coherent Single-Photon Emission from Colloidal Lead Halide Perovskite Quantum Dots. Science 2019, 363, 1068. 10.1126/science.aau7392. [DOI] [PubMed] [Google Scholar]
- Tamarat P.; Bodnarchuk M. I.; Trebbia J.-B.; Erni R.; Kovalenko M. V.; Even J.; Lounis B. The Ground Exciton State of Formamidinium Lead Bromide Perovskite Nanocrystals Is a Singlet Dark State. Nat. Mater. 2019, 18, 717. 10.1038/s41563-019-0364-x. [DOI] [PubMed] [Google Scholar]
- Manzi A.; Tong Y.; Feucht J.; Yao E.-P.; Polavarapu L.; Urban A. S.; Feldmann J. Resonantly Enhanced Multiple Exciton Generation through Below-Band-Gap Multi-Photon Absorption in Perovskite Nanocrystals. Nat. Commun. 2018, 9, 1518. 10.1038/s41467-018-03965-8. [DOI] [PMC free article] [PubMed] [Google Scholar]
- Rainò G.; Nedelcu G.; Protesescu L.; Bodnarchuk M. I.; Kovalenko M. V.; Mahrt R. F.; Stöferle T. Single Cesium Lead Halide Perovskite Nanocrystals at Low Temperature: Fast Single Photon Emission, Reduced Blinking, and Exciton Fine Structure. ACS Nano 2016, 10, 2485. 10.1021/acsnano.5b07328. [DOI] [PMC free article] [PubMed] [Google Scholar]
- Fu M.; Tamarat P.; Huang H.; Even J.; Rogach A. L.; Lounis B. Neutral and Charged Exciton Fine Structure in Single Lead Halide Perovskite Nanocrystals Revealed by Magneto-Optical Spectroscopy. Nano Lett. 2017, 17, 2895. 10.1021/acs.nanolett.7b00064. [DOI] [PubMed] [Google Scholar]
- Tian Y.; Merdasa A.; Peter M.; Abdellah M.; Zheng K.; Ponesca C. S.; Pullerits T.; Yartsev A.; Sundström V.; Scheblykin I. G. Giant Photoluminescence Blinking of Perovskite Nanocrystals Reveals Single-Trap Control of Luminescence. Nano Lett. 2015, 15, 1603. 10.1021/nl5041397. [DOI] [PubMed] [Google Scholar]
- Park Y.-S.; Guo S.; Makarov N. S.; Klimov V. I. Room Temperature Single-Photon Emission from Individual Perovskite Quantum Dots. ACS Nano 2015, 9, 10836. 10.1021/acsnano.5b04584. [DOI] [PubMed] [Google Scholar]
- Seth S.; Mondal N.; Satyajit P.; Anunay S. Fluorescence Blinking and Photoactivation of All-Inorganic Perovskite Nanocrystals CsPbBr3 and CsPbBr2I. J. Phys. Chem. Lett. 2016, 7, 266. 10.1021/acs.jpclett.5b02639. [DOI] [PubMed] [Google Scholar]
- Chirvony V. S.; Gonzáles-Carrero S.; Suárez I.; Galian R. E.; Sessolo M.; Bolink H. J.; Martínez-Pastor J. P.; Pérez-Prieto J. Delayed Luminescence in Lead Halide Perovskite Nanocrystals. J. Phys. Chem. C 2017, 121, 13381. 10.1021/acs.jpcc.7b03771. [DOI] [Google Scholar]
- Wang Y.; Zhi M.; Chan Y. Delayed Exciton Formation Involving Energetically Shallow Trap States in Colloidal CsPbBr3 Quantum Dots. J. Phys. Chem. C 2017, 121, 28498. 10.1021/acs.jpcc.7b09040. [DOI] [Google Scholar]
- Vonk S. J. W.; Fridriksson M. B.; Hinterding S. O. M.; Mangnus M. J. J.; van Swieten T. P.; Grozema F. C.; Rabouw F. T.; van der Stam W. Trapping and De-Trapping in Colloidal Perovskite Nanoplatelets: Elucidation and Prevention of Nonradiative Processes through Chemical Treatment. J. Phys. Chem. C 2020, 124, 8047. 10.1021/acs.jpcc.0c02287. [DOI] [PMC free article] [PubMed] [Google Scholar]
- Canneson D.; Shornikova E. V.; Yakovlev D. R.; Rogge T.; Mitioglu A. A.; Ballottin M. V.; Christianen P. C.; Lhuillier E.; Bayer M.; Biadala L. Negatively Charged and Dark Excitons in CsPbBr3 Perovskite Nanocrystals Revealed by High Magnetic Fields. Nano Lett. 2017, 17, 6177. 10.1021/acs.nanolett.7b02827. [DOI] [PubMed] [Google Scholar]
- Chen L.; Li B.; Zhang C.; Huang X.; Wang X.; Xiao M. Composition-Dependent Energy Splitting between Bright and Dark Excitons in Lead Halide Perovskite Nanocrystals. Nano Lett. 2018, 18, 2074. 10.1021/acs.nanolett.8b00184. [DOI] [PubMed] [Google Scholar]
- Fu M.; Tamarat P.; Trebbia J.-B.; Bodnarchuk M. I.; Kovalenko M. V.; Even J.; Lounis B. Unraveling Exciton–Phonon Coupling in Individual FAPbI3 Nanocrystals Emitting Near-Infrared Single Photons. Nat. Commun. 2018, 9, 3318. 10.1038/s41467-018-05876-0. [DOI] [PMC free article] [PubMed] [Google Scholar]
- Xu K.; Vliem J. F.; Meijerink A. Long-Lived Dark Exciton Emission in Mn-Doped CsPbCl3 Perovskite Nanocrystals. J. Phys. Chem. C 2019, 123, 979. 10.1021/acs.jpcc.8b12035. [DOI] [PMC free article] [PubMed] [Google Scholar]
- Brodu A.; Ballottin M. V.; Buhot J.; Van Harten E. J.; Dupont D.; La Porta A.; Prins P. T.; Tessier M. D.; Versteegh M. A.; Zwiller V.; Bals S.; Hens Z.; Rabouw F. T.; Christianen P. C. M.; de Mello Donega C.; Vanmaekelbergh D. Exciton Fine Structure and Lattice Dynamics in InP/ZnSe Core/Shell Quantum Dots. ACS Photonics 2018, 5, 3353. 10.1021/acsphotonics.8b00615. [DOI] [PMC free article] [PubMed] [Google Scholar]
- Ramade J.; Andriambariarijaona L. M.; Steinmetz V.; Goubet N.; Legrand L.; Barisien T.; Bernardot F.; Testelin C.; Lhuillier E.; Bramati A.; Chamarro M. Fine Structure of Excitons and Electron–Hole Exchange Energy in Polymorphic CsPbBr3 Single Nanocrystals. Nanoscale 2018, 10, 6393. 10.1039/C7NR09334A. [DOI] [PubMed] [Google Scholar]
- Empedocles S. A.; Norris D. J.; Bawendi M. G. Photoluminescence Spectroscopy of Single CdSe Nanocrytallite Quantum Dots. Phys. Rev. Lett. 1996, 77, 3873. 10.1103/PhysRevLett.77.3873. [DOI] [PubMed] [Google Scholar]
- Neuhauser R.; Shimizu K.; Woo W.; Empedocles S.; Bawendi M. G. Correlation between Fluorescence Intermittency and Spectral Diffusion in Single Semiconductor Quantum Dots. Phys. Rev. Lett. 2000, 85, 3301. 10.1103/PhysRevLett.85.3301. [DOI] [PubMed] [Google Scholar]
- Ye M.; Searson P. C. Blinking in Quantum Dots: The Origin of the Grey State and Power Law Statistics. Phys. Rev. B: Condens. Matter Mater. Phys. 2011, 84, 125317. 10.1103/PhysRevB.84.125317. [DOI] [PMC free article] [PubMed] [Google Scholar]
- Yarita N.; Aharen T.; Tahara H.; Saruyama M.; Kawawaki T.; Sato R.; Teranishi T.; Kanemitsu Y. Observation of Positive and Negative Trions in Organic-Inorganic Hybrid Perovskite Nanocrystals. Phys. Rev. Mater. 2018, 2, 116003. 10.1103/PhysRevMaterials.2.116003. [DOI] [Google Scholar]
Associated Data
This section collects any data citations, data availability statements, or supplementary materials included in this article.


