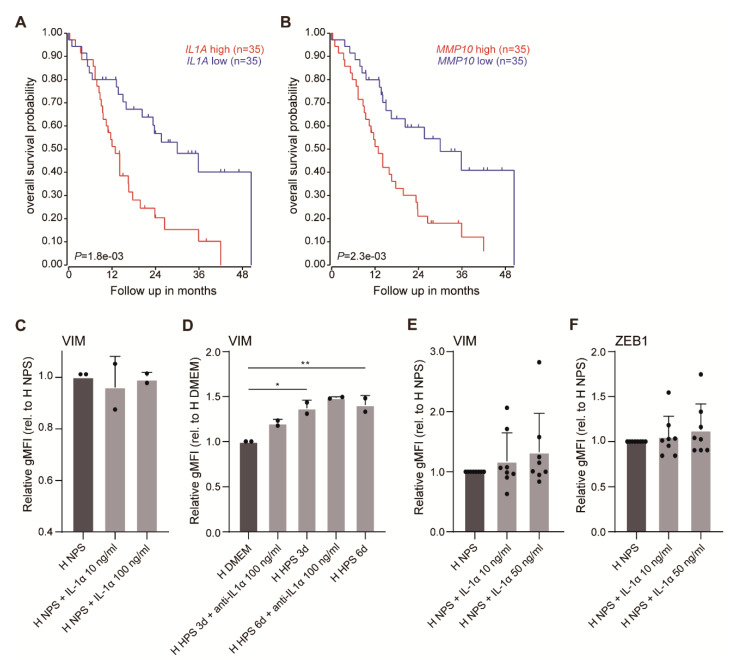
Figure A3.
Upregulation of IL1A or MMP10 correlates with poor prognosis. (A) Survival analysis on PDAC samples dichotomized by median IL1A and MMP10 (B) are shown. (C) PANC-1 and MIA PaCa-2 were cultured in NPS, NPS + IL1α 10 ng/mL and NPS + IL1α 100 ng/mL under hypoxia for 3 days before flow cytometry was performed for VIM expression. Levels of average gMFI ± S.E.M. were normalized to NPS group (* p < 0.05, ** p < 0.01). A dot refers to a cell line. (D) Both cell lines were also incubated in unconditioned medium, HPS, and HPS + anti-IL1α 100 ng/mL under hypoxia for 3 or 6 days. Values were normalized to unconditioned medium group. (E,F) Expression of VIM and ZEB1 in AMC-PDAC-053M, AMC-PDAC-067, AMC-PDAC-099, AsPC-1, Hs 766T, PSN-1, PANC-89, Capan-1 were assessed by flow cytometry following treatment of NPS, NPS + IL1α 10 ng/mL and NPS + IL1α 50 ng/mL under hypoxia for 3 days. Data were normalized to NPS group.

