Abstract
Background
Coronavirus disease 2019 (COVID-19) has been declared a global pandemic. COVID-19 is more severe in people with diabetes. The identification of risk factors for predicting disease severity in COVID-19 patients with type 2 diabetes mellitus (T2DM) is urgently needed.
Methods
Two hundred and thirty-six patients with COVID-19 were enrolled in our study. The patients were divided into 2 groups: COVID-19 patients with or without T2DM. The patients were further divided into four subgroups according to the severity of COVID-19 as follows: Subgroup A included moderate COVID-19 patients without diabetes, subgroup B included severe COVID-19 patients without diabetes, subgroup C included moderate COVID-19 patients with diabetes, and subgroup D included severe COVID-19 patients with diabetes. The clinical features and radiological assessments were collected and analyzed. We tracked the dynamic changes in laboratory parameters and clinical outcomes during the hospitalization period. Multivariate analysis was performed using logistic regression to analyze the risk factors that predict the severity of COVID-19 with T2DM.
Results
Firstly, compared with the nondiabetic group, the COVID-19 with T2DM group had a higher erythrocyte sedimentation rate (ESR) and levels of C-reactive protein (CRP), interleukin 6 (IL-6), tumor necrosis factor alpha (TNF-α), and procalcitonin (PCT) but lower lymphocyte counts and T lymphocyte subsets, including CD3+ T cells, CD8+ T cells, CD4+ T cells, CD16 + CD56 cells, and CD19+ cells. Secondly, compared with group A, group C had higher levels of Fasting blood glucose (FBG), IL-6, TNF-α, and neutrophils but lower lymphocyte, CD3+ T cell, CD8+ T cell, and CD4+ T cell counts. Similarly, group D had higher FBG, IL-6 and TNF-α levels and lower lymphocyte, CD3+ T cell, CD8+ T cell, and CD4+ T cell counts than group B. Thirdly, binary logistic regression analysis showed that HbA1c, IL-6, and lymphocyte count were risk factors for the severity of COVID-19 with T2DM. Importantly, COVID-19 patients with T2DM were more likely to worsen from moderate to severe COVID-19 than nondiabetic patients. Of note, lymphopenia and inflammatory responses remained more severe throughout hospitalization for COVID-19 patients with T2DM.
Conclusion
Our data suggested that COVID-19 patients with T2DM are more likely to develop severe COVID-19 than those without T2DM and that hyperglycemia associated with the lymphopenia and inflammatory responses in COVID-19 patients with T2DM.
Keywords: COVID-19, Type 2 diabetes mellitus, Cytokine response, Lymphocyte
Highlights
-
•
COVID-19 patients with T2DM suffer from more severe inflammatory responses and lymphopenia than those without T2DM.
-
•
COVID-19 patients with T2DM are more likely to worsen from moderate to severe disease.
-
•
Inflammation and lymphopenia resolve more slowly in T2DM patients with COVID-19.
-
•
Hyperglycemia, lymphopenia and inflammation play important roles in the severity of COVID-19 with T2DM.
1. Introduction
In December 2019, an outbreak of coronavirus disease 2019 (COVID-19) occurred in Wuhan, Hubei Province, China.1 , 2 By June 13, 2020, over 84,000 individuals in China had suffered from this disease, including 4645 deaths. Notably, over 7,553,182 cases, including 423,349 deaths, have been confirmed worldwide.3
The genome of the new coronavirus has been identified and confirmed as the cause of the novel coronavirus-infected pneumonia.4 Importantly, the clinical and epidemiological characteristics of the infection in both adults and children have been reported.5The mean incubation period for COVID-19 is approximately 5.2 days. COVID-19 commonly causes fever, cough, myalgia, and pneumonia,6 and 20% of COVID-19 patient suffered from diabetes.7
The occurrence of type 2 diabetes mellitus (T2DM) has rapidly increased, especially in aging people, and has now become a serious global health problem. A national study from UK showed that type 1 and type 2 diabetes were both independently associated with a significant increased odd of in-hospital death with COVID-19.8 Furthermore, increased COVID-19-related mortality was associated with complications of type 1 and type 2 diabetes.9 Additionally, recent evidence has shown that improved glycemic control is associated with better outcomes in patients with COVID-19 and pre-existing T2DM.10 To better manage COVID-19 with T2DM globally, it is essential to understand the risk factors that predict the severe type of COVID-19 in patients with T2DM. Therefore, in this retrospective, single-center study, we compared clinical and laboratory characteristics of the diabetic and non-diabetic in-hospital patients infected with COVID-19. We aimed to determine the predictors of disease severity in COVID-19 patients with T2DM.
2. Methods
2.1. Study design
In this retrospective study, a total of 236 COVID-19 patients, including 128 males and 108 females, were enrolled from December 2019 to February 2020. Of these participants, 103 patients suffered from T2DM. The General Hospital of Central Theater Command is mainly responsible for the treatment of COVID-19 patients assigned to the hospital by the government in Wuhan. Diagnostic criteria: The diagnosis of diabetes was based on the 1999 World Health Organization diagnostic criteria. The diagnosis of COVID-19 was based on the guidelines by the Health and Medical Commission of the People's Republic of China (seventh trial edition) for the diagnosis and treatment of pneumonia caused by the new coronavirus infection. Severe COVID-19 was defined as patients had one of the following criteria: (a) respiratory frequency ≥ 30/min; (b) oxygen saturation ≤ 93% at rest; and (c) oxygenation index (artery partial pressure of oxygen/inspired oxygen fraction, PaO2/FiO2) ≤ 300 mmHg. Critical COVID-19 was defined as follow: (1) Respiratory failure requiring mechanical ventilation;(2) Shock;(3) Patients combined with other organ failure needed ICU monitoring and treatment. Inclusion criteria: Chinese Han patients from the Wuhan area with COVID-19 whose body mass index (BMI) was 18.5 to 28.0 kg/m2. Exclusion criteria: (1) Type 1 diabetes and other types of diabetes and various acute complications of diabetes; (2) Impaired glucose regulation including impaired fasting glucose and impaired glucose tolerance; (3) History of severe brain, kidney and liver diseases; (4) History of congestive heart failure; (5) History of malignant tumor; (6) Chronic lung disease, including chronic obstructive pulmonary disease and asthma; (7) Glucocorticoid treatment before admission.
In this study, according to the guidelines for the diagnosis and treatment of COVID-19 (seventh trial edition) published by the National Health Commission of China,11we defined the patients with the common type of COVID-19 as the “moderate subgroup”, and we combined the severe and critical patients into the “severe subgroup” due to the small sample sizes. First, we divided all patients into two groups based on whether they suffered from T2DM. Second,the study participants were further categorized into four subgroups according to the severity of COVID-19 as follows: subgroup A had moderate COVID-19 without diabetes, subgroup B had severe COVID-19 without diabetes, subgroup C had moderate COVID-19 with diabetes, and subgroup D had severe COVID-19 with diabetes. The Ethics Commission of General Hospital of Central Theater Command approved this study (2020033-1). Written informed consent was waived by the Ethics Commission for emerging infectious diseases.
2.2. Clinical and biochemical analysis
Clinical features and biochemical assessments, based on the first measurement obtained from the patient on their day of admission, were obtained from each patient's electronic medical records for retrospective review. The height and weight were measured using standardized protocols. Body mass index (BMI) was calculated as weight (kg) divided by the square of height (m2). Peripheral blood was collected after 8–12 h of overnight fasting. Alanine aminotransferase (ALT), aspartate aminotransferase (AST), blood urea nitrogen (BUN), serum creatinine (Scr), uric acid (UA), total cholesterol (TC), triglyceride (TG), high-density lipoprotein cholesterol (HDL-C), and low-density lipoprotein cholesterol (LDL-C) were assessed using standard enzymatic methods. FBG and postprandial 2-hour blood glucose (2 h BG) were measured by a glucose oxidase procedure. Lactate dehydrogenase (LDH), erythrocyte sedimentation rate (ESR), C-reactive protein (CRP), and routine blood test parameters were assessed using standard laboratory techniques. T lymphocyte subsets were measured by a flow cytometry assay. Glycated hemoglobin A1c (HbA1c) was determined by high-performance liquid chromatography. Interleukin 6 (IL-6), tumor necrosis factor alpha (TNF-α), and procalcitonin (PCT) were measured by enzyme-linked immunosorbent assay (ELISA). The estimated glomerular filtration rate (eGFR) was calculated as 175 × (Scr)−1.234 × (Age)−0.179 × (if female × 0.79). The medications administered to the patients were analyzed.
2.3. Statistical analysis
Statistical analysis was performed using SPSS 25 statistical software. Data distributions were determined using the one-sample Kolmogorov-Smirnov test, and normally distributed data are represented by the mean ± standard deviation (SD). Nonnormally distributed data are represented as the median (25th–75th interquartile range), and categorical variables are represented as the number of cases (n) and the percentage (%). Normally distributed continuous variables were compared using t-tests; otherwise, the Mann-Whitney test was used. The proportions of categorical variables were compared using the χ2 test; Fisher's exact test was used when the proportions were small. The correlations between glucose levels and other variables were analyzed using Spearman correlations. Multivariate logistic regression models were established based on the severity of the disease. Age, gender, ALT, BUN, Scr, HbA1c, LDH, CRP, IL-6, PCT, neutrophil count, lymphocyte count, CD3+ T cells, and CD16 + CD56 cells served as independent variables in this logistic regression. The multicollinearity of the predictor variables was assessed, and the assumption of multicollinearity was not violated. p-Values of <0.05 were considered statistically significant. The p-values were adjusted with a Bonferroni correction for multiple comparisons.
3. Results
3.1. Baseline characteristics of subjects grouped by diabetes
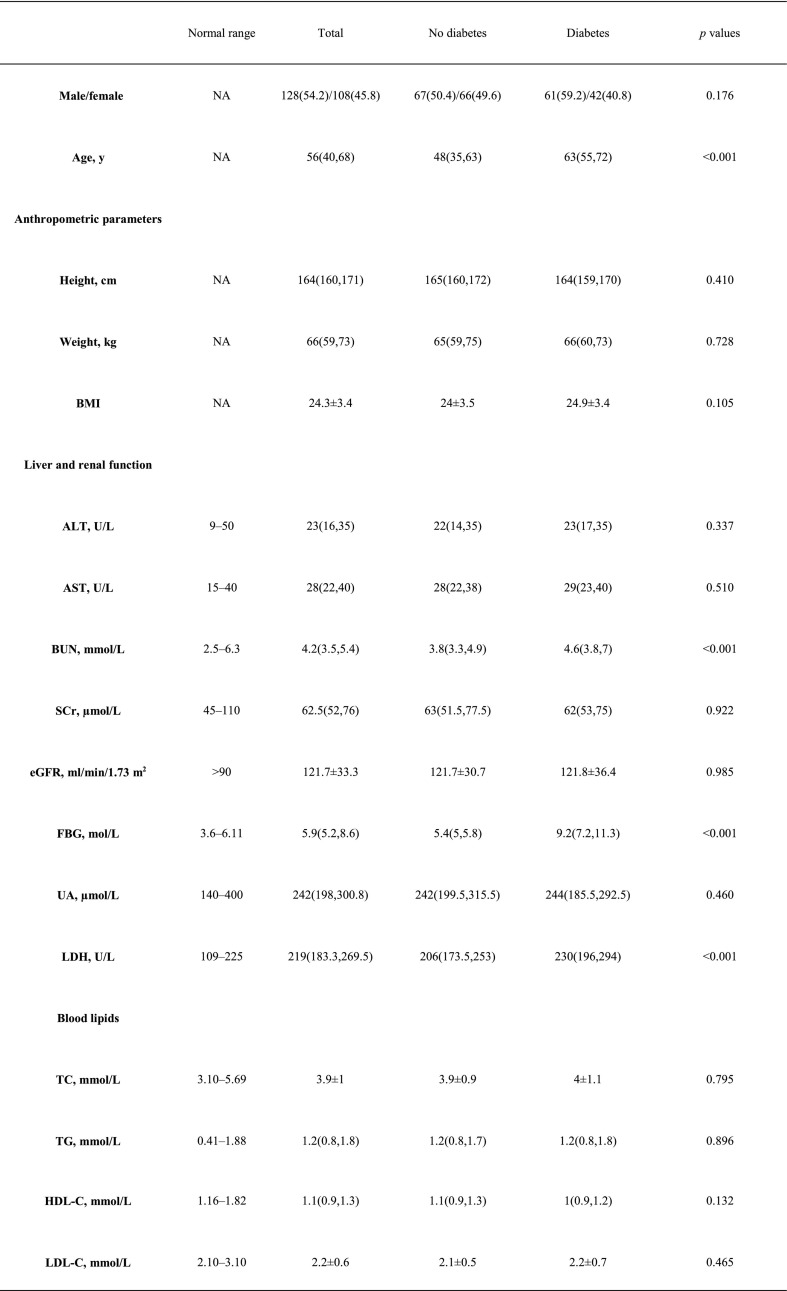
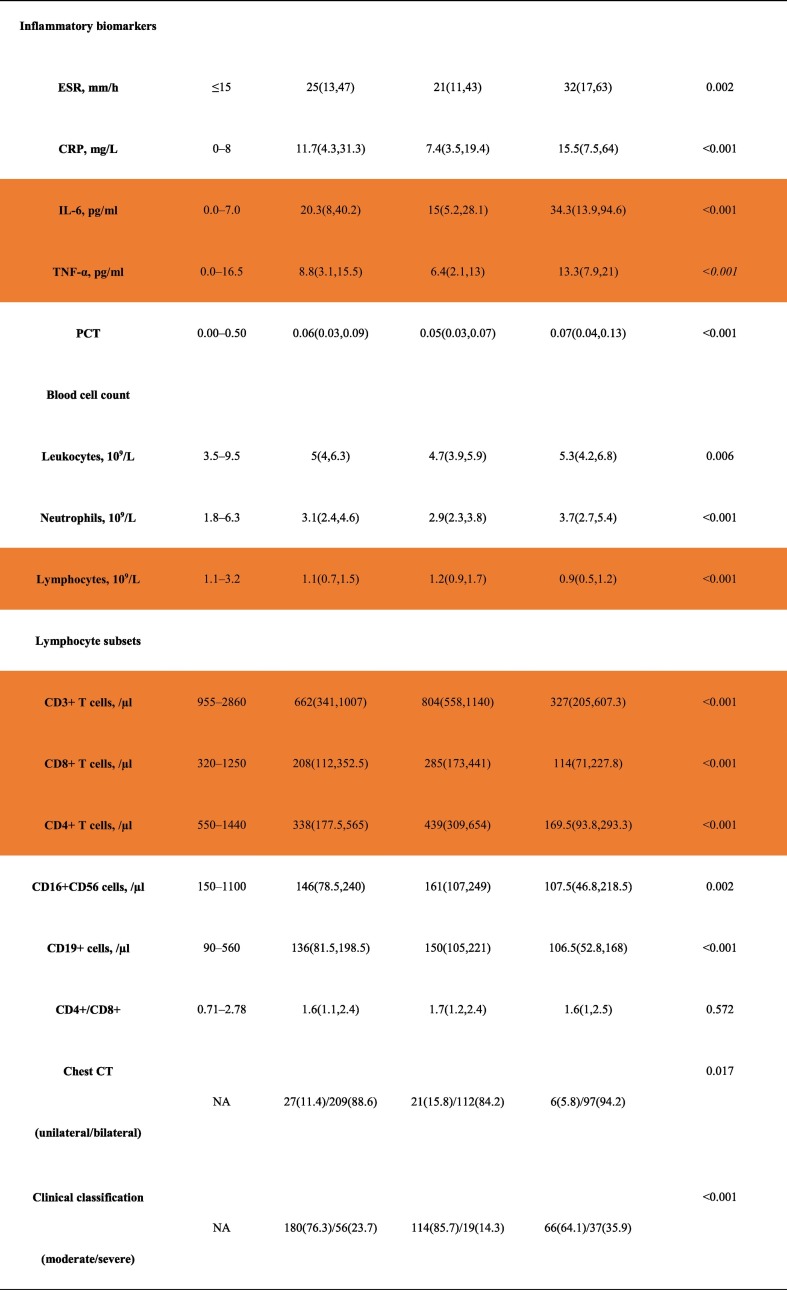
Table 1 shows the baseline characteristics of the two groups. Compared with the nondiabetic group, the diabetes group had more severe COVID-19 patients (35.9% versus 14.3%, p = 0.017). Accordingly, the chest CT was more likely to be affected bilaterally in the diabetes group (94.2% versus 84.2%, p < 0.001). Interestingly, compared to the nondiabetic group, the diabetes group had higher age, BUN, LDH, ESR, CRP, PCT, leukocyte counts and neutrophil counts as well as levels of IL-6 and TNF-α; Importantly, lower lymphocyte count and T lymphocyte subsets including CD3+ T cells, CD8+ T cells, CD4+ T cells, CD16 + CD56 cells and CD19+ cells were found in diabetic patients. There were no significant differences in gender, height, weight, BMI, ALT, AST, Scr, eGFR, UA, TC, TG, LDL-C, HDL-C, or CD4+/CD8+ between the two groups.
Table 1.
Clinical and biochemical characteristics of COVID-19 patients with or without diabetes.
Abbreviations: ALT, alanine aminotransferase; AST, aspartate aminotransferase; BUN, serum urea nitrogen; SCr, serum creatinine; eGFR, estimated glomerular filtration rate; UA, uric acid; TC, total cholesterol; TG, triglyceride; HDL, high-density lipoprotein cholesterol; LDL, low-density lipoprotein cholesterol; LDH, lactate dehydrogenase; ESR, erythrocyte sedimentation rate; CRP, C-reactive protein; IL-6, interleukin 6; tumor necrosis factor alpha (TNF-α); PCT, procalcitonin.
Data are n (%), n/N (%) and median (IQR).
3.2. Baseline characteristics of subgroups by severity of COVID-19
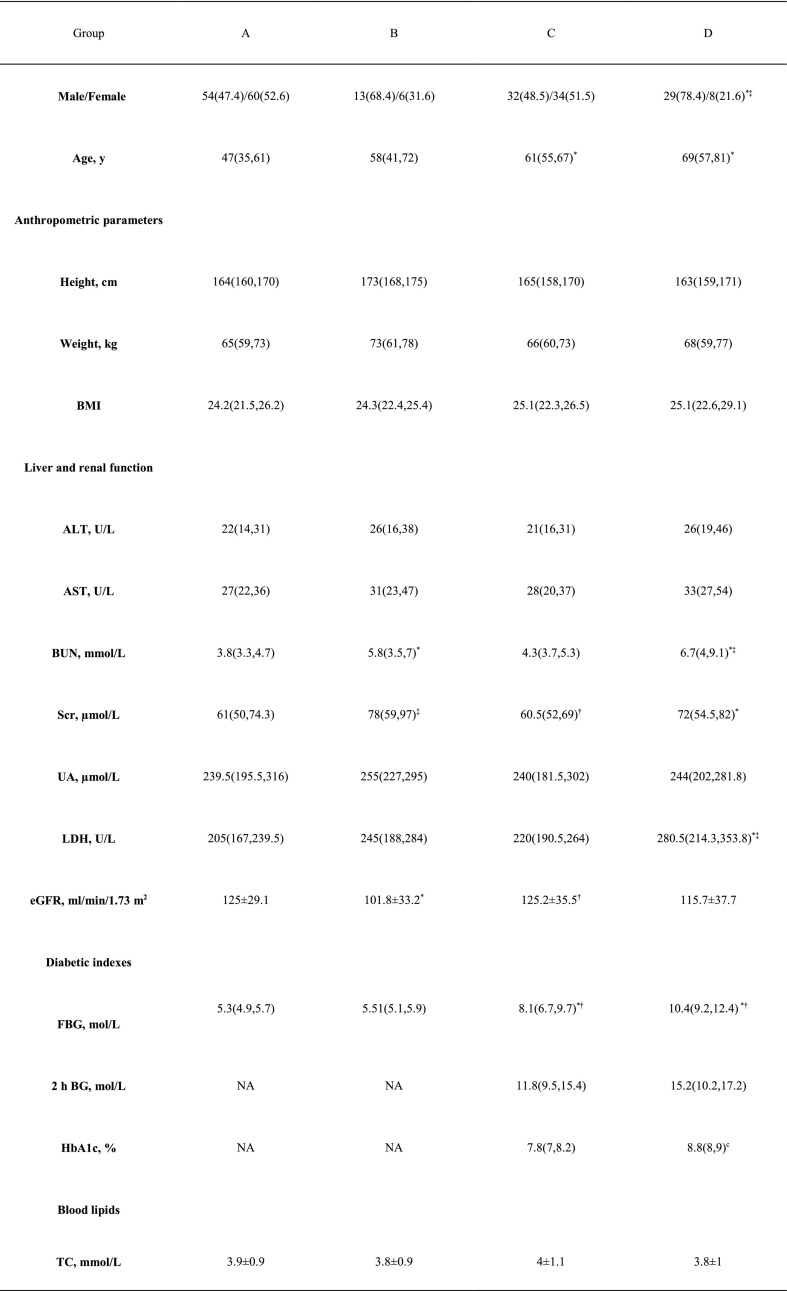
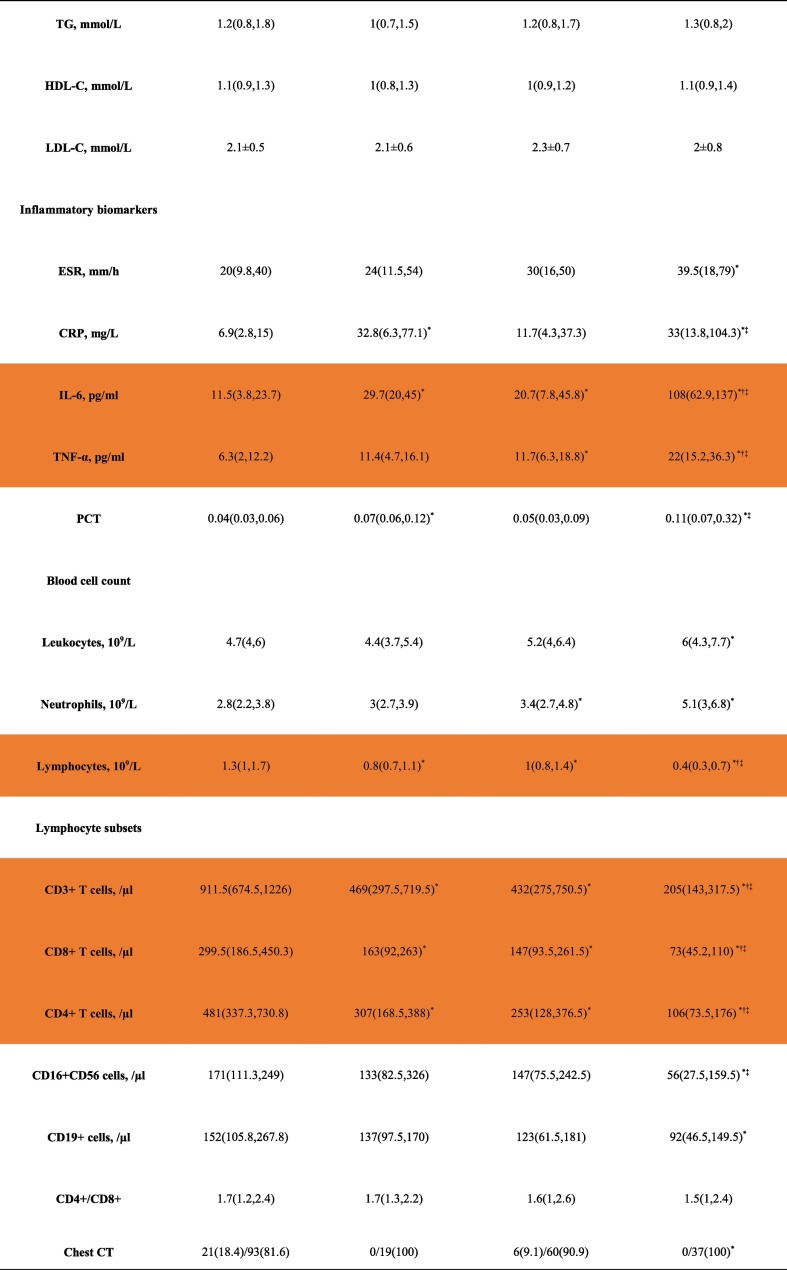
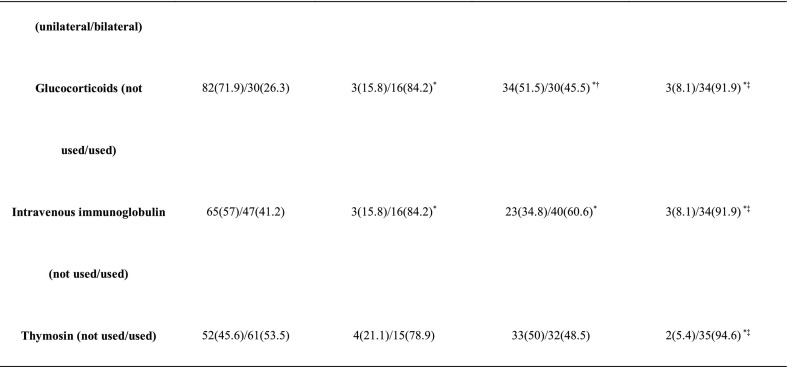
The baseline characteristics of the different subgroups are shown in Table 2 and Fig. 1 . Compared with groups A and C, group D had more males. Patients in groups D and C were older than those in group A. Compared with group A, group C had higher FBG, IL-6, TNF-α, and neutrophil counts but lower lymphocyte, CD3+ T cell, CD8+ T cell, and CD4+ T cell counts. Likewise, group D had higher FBG, IL-6 and TNF-α, but lower lymphocyte, CD3+ T cell, CD8+ T cell, and CD4+ T cell counts than group B. In terms of the use of medications, compared with group A, group B used a higher proportion of glucocorticoids and intravenous immunoglobulin. Accordingly, compared with group C, group D used a higher proportion of glucocorticoids and intravenous immunoglobulin (Table 2).
Table 2.
Clinical and biochemical characteristics of the subgroups.
Abbreviations: ALT, alanine aminotransferase; AST, aspartate aminotransferase; BUN, serum urea nitrogen; Src, serum creatinine; eGFR, estimated glomerular filtration rate; UA, uric acid; FBG, fasting blood glucose; postprandial 2-hour blood glucose (2 h BG); glycated hemoglobin A1c(HbA1c); TC, total cholesterol; TG, triglyceride; HDL, high-density lipoprotein cholesterol; LDL, low-density lipoprotein cholesterol; LDH lactate dehydrogenase; ESR, erythrocyte sedimentation rate; CRP, C-reactive protein; IL-6, interleukin 6; tumor necrosis factor alpha (TNF-α); PCT, procalcitonin.
Data are n (%), n/N (%) and median (IQR).
*: p < 0.05 compared with group A, †: p < 0.05 compared with group B, ‡: p < 0.05 compared with group C.
Fig. 1.
Baseline characteristics of the subgroups by severity of COVID-19.Series of comparisons of the baseline characteristics among group A (n = 114), group B (n = 19), group C (n = 69), and group D (n = 37). All data are presented as the median (25th–75th interquartile range). Differences were tested using an unpaired 2-sided Student's t-test. *: p < 0.05 compared with group A, †: p < 0.05 compared with group B, ‡: p < 0.05 compared with group C.
3.3. The correlations between glucose levels and other variables
To explore the relationship between the glucose levels and other variables, correlation analyses were performed. The correlation coefficients between FBG and the other variables were calculated using Spearman correlation analysis. Firstly, in all subjects, the results showed that FBG was positively correlated to age (r = 0.374, p < 0.001), BUN (r = 0.298, p < 0.001), LDH (r = 0.291, p < 0.001), CRP (r = 0.430, p < 0.001), ESR (r = 0.229, p = 0.001), PCT (r = 0.288, p < 0.001), IL-6 (r = 0.439, p < 0.001), TNF-α (r = 0.411, p < 0.001), leukocyte count (r = 0.146, p = 0.025), and neutrophil count (r = 0.320, p < 0.001). On the other hand, FBG was negatively correlated to lymphocyte count (r = −0.472, p < 0.001), CD3+ T cells (r = −0.584, p < 0.001), CD8+ T cells (r = −0.503, p = 0.013), CD4+ T cells (r = −0.583, p < 0.001), CD19+ cells (r = −0.308, p < 0.001), CD16 + CD56 (r = −0.177, p = 0.021), and CD4+/CD8+ (r = −0.152, p = 0.048). However, FBG was not found to be associated with gender, height, weight, BMI, ALT, AST, UA, Scr, eGFR, TC, TG, LDL-C or HDL-C. Secondly, in the diabetic group, postprandial 2 h BG was positively correlated to BUN (r = 0.368, p = 0.003), eGFR (r = 0.254, p = 0.044), LDH (r = 0.431, p = 0.001), IL-6 (r = 0.304, p = 0.026), TNF-α (r = 0.427, p = 0.006), and CRP (r = 0.333, p = 0.016), while postprandial 2 h BG was negatively correlated to UA (r = −0.318, p = 0.011), CD3+ T cells (r = −0.342, p = 0.025) and CD8+ T cells (r = −0.309, p = 0.044). However, postprandial 2 h BG was not found to be associated with gender, height, weight, age, BMI, ALT, AST, UA, Scr, TC, TG, LDL-C, HDL-C, ESR, PCT, leukocyte count, neutrophil count, lymphocyte count, CD4+ T cells, CD19+ cells, CD16 + CD56 cells or CD4+/CD8+. As expected,HbA1c was positively correlated to BUN (r = 0.294, p = 0.003), LDH (r = 0.275, p = 0.006), ESR (r = 0.221, p = 0.049), CRP (r = 0.399, p < 0.001), IL-6 (r = 0.363, p = 0.001), TNF-α (r = 0.423, p = 0.001), PCT (r = 0.221, p = 0.028), and neutrophil count (r = 0.241, p = 0.014); HbA1c was negatively correlated to UA (r = −0.280, p = 0.005), lymphocyte count (r = −0.409, p < 0.001), CD3+ T cells (r = −0.436, p < 0.001), CD4+ T cells (r = −0.3, p = 0.014), CD8+ T cells (r = −0.447, p < 0.001), and CD16 + CD56 cells (r = −0.257, p = 0.037). However, HbA1c was not found to be associated with age, gender, height, weight, BMI, ALT, AST, Scr, eGFR, TC, TG, LDL-C, HDL-C, leukocyte count, CD19+ cells, or CD4+/CD8 + .
3.4. Factors predicting the severity of COVID-19 in T2DM patients
Here, we are interested in the factors that predict the severity of COVID-19 in T2DM patients. First, the correlation coefficients between the severity of the disease and other variables in COVID-19 patients with T2DM were calculated using a Spearman correlation analysis. The results showed that the severity of the disease was positively correlated to age (r = 0.278, p = 0.005), ALT (r = 0.249, p = 0.011), AST (r = 0.232, p = 0.019), BUN (r = 0.401, p < 0.001), Scr (r = 0.225, p = 0.022), FBG (r = 0.393, p < 0.001), HbA1c (r = 0.466, p < 0.001), LDH (r = 0.319, p = 0.001), CRP (r = 0.385, p < 0.001), IL-6 (r = 0.626, p < 0.001), TNF-α (r = 0.35, p < 0.001), PCT (r = 0.409, p < 0.001), and neutrophil count (r = 0.251, p = 0.01). In parallel, the severity of the disease was negatively correlated with gender (r = −0.292, p = 0.003), lymphocyte count (r = −0.650, p < 0.001), CD3+ T cells (r = −0.535, p < 0.001), CD8+ T cells (r = −0.464, p < 0.001), CD4+ T cells (r = −0.448, p < 0.001), and CD16 + CD56 cells (r = −0.361, p = 0.003). However, the severity of the disease was not found to be associated with height, weight, BMI, UA, 2 h BG, eGFR, TC, TG, HDL-C, LDL-C, ESR, leukocyte count, CD19+ cells, or CD4+/CD8+. Second, binary logistic regression analysis was performed to evaluate the association between the severity of COVID-19 and other independent variables. In this model, gender, age, ALT, BUN, Scr, HbA1c, LDH, CRP, IL-6, PCT, neutrophil count, lymphocyte count, CD3+ T cells, and CD16 + CD56 cells were entered at the beginning of the procedure after excluding collinearity. We chose Forward: LR as the method. The results showed that HbA1c, IL-6 and lymphocyte count were risk factors for the severity of COVID-19 patients with T2DM (Table 3 ).
Table 3.
Binary logistic regression analysis with the clinical classification as the dependent variable in diabetic patients.
| B | S.E | Wals | Sig. | Exp(B) | 95% CI | |
|---|---|---|---|---|---|---|
| HbA1c | 1.212 | 0.492 | 6.076 | 0.014 | 3.36 | 1.282–8.809 |
| Cr | 0.098 | 0.052 | 3.545 | 0.06 | 1.103 | 0.996–1.221 |
| Lymphocytes | −6.697 | 2.916 | 5.273 | 0.022 | 0.001 | 0–0.375 |
| IL-6 | 0.032 | 0.014 | 5.489 | 0.019 | 1.033 | 1.005–1.061 |
A p value <0.05 was considered to indicate a significant difference.
3.5. Dynamic changes in laboratory tests and clinical outcomes
To study the changes during the hospitalization period in the clinical characteristics of COVID-19 patients with T2DM, we tracked the dynamic changes in some clinical outcomes and laboratory parameters. COVID-19 patients with T2DM had lower lymphocytes and higher urea nitrogen, IL-6, and CRP levels than nondiabetic patients at different time points during the hospitalization period (Fig. 2 ). Compared with the cases in subgroup A (14% developed from moderate to severe), twenty cases (30.3%) in group C developed from moderate to severe (p = 0.009). All nonsurvivors were patients with severe disease, with 2 (10.5%) nonsurvivors in subgroup B and 5 (13.5%) nonsurvivors in subgroup D (p = 0.749) (Fig. 3 ).
Fig. 2.
Dynamic changes in the laboratory test results of COVID-19 patients. (A) Dynamic profiles of BUN in COVID-19 patients with vs without diabetes; (B) Dynamic profiles of CRP in COVID-19 patients with vs without diabetes; (C) Dynamic profiles of IL-6 in COVID-19 patients with vs without diabetes; (D) Dynamic profiles of lymphocytes in COVID-19 patients with vs without diabetes. The solid black lines show the upper normal limit of each parameter, and the solid red line shows the lower normal limit of the lymphocyte count. ⁎p < 0.05 for COVID-19 patients with vs without diabetes.
Fig. 3.
Dynamic changes in the clinical outcomes of COVID-19 patients. (A) Proportion of patients with moderate to severe disease in the moderate group; (B) Proportion of nonsurvivors in the severe group. *: p < 0.05 compared with group A in 3A.
4. Discussion
COVID-19 pneumonia is caused by a new type of coronavirus, which has caused a global pandemic. Six coronaviruses are known to cause human disease.12The purpose of this retrospective study was to determine the predictors of disease severity in COVID-19 patients with T2DM. We mainly illustrated that (1) COVID-19 patients with T2DM suffer from more severe inflammatory responses and less lymphocyte than those without T2DM; (2) COVID-19 patients with T2DM are more likely to worsen from moderate to severe disease; (3) inflammation and lymphocyte resolve more slowly in T2DM patients with COVID-19; and (4) hyperglycemia, lymphopenia and inflammation play important roles in the severity of COVID-19 with T2DM. To the best of our knowledge, this is the first study to show that hyperglycemia related to the lymphopenia and the disease severity of COVID-19 with diabetes.
It is well known that lymphocytes are important components of the immune system. Chen et al.6 found that lymphopenia was present in patients with moderate COVID-19. Guo et al.13 proposed a lymphocyte count of <0.8 * 109/L as one of the indicators to predict the mortality risk model (MuLBSTA score). Importantly, one recent study showed that the number of total T cells, CD4+ T cells and CD8+ T cells were dramatically reduced in COVID-19 patients, especially in elderly patients (≥60 years of age) and patients requiring intensive care unit (ICU) care.14 Our study revealed that hyperglycemia related to the reduction in lymphocyte counts and T lymphocyte subsets, including CD3+ T cells, CD8+ T cells, CD4+ T cells, and CD19+ cells.
The exact mechanisms of the effects of hyperglycemia on lymphocytes and T lymphocytes are unclear. For patients with T2DM, there is already an imbalance of T lymphocyte subsets.15 Moreover, patients with T2DM have decreased CD3+ T cells, which may be related to adaptive immune activation and chronic inflammation during the pathogenesis of T2DM.16 Even in nondiabetic patients, short-term hyperglycemia can induce lymphopenia and lymphocyte subset redistribution.17The presence of hyperglycemia weakens the body's innate and immune systems, thereby limiting the body's ability to resist any infection.18 Our data showed that the levels of lymphocyte counts and T-lymphocyte subtypes including CD3, CD4 and CD8 in the diabetic group was lower in the diabetic population compared to non-diabetic. Moreover, correlation analysis showed that hyperglycemia including FBG, 2 H BG and Hba1c was associated with lymphopenia and deceased lymphocyte subset. These data indicated that hyperglycemia may affect the lymphocyte and its subsets numbers in COVID-19 conditions. In addition, COVID-19 patients with T2DM have higher urea nitrogen, which is similar to previous research.19 Angiotensin-converting enzyme 2 (ACE2), a severe acute respiratory syndrome coronavirus 2 (SARS-CoV-2) receptor expressed in the human respiratory system, cardiovascular system, digestive system and urinary system, may contribute to the increased urea nitrogen.20
Immune system imbalances may induce the secretion of inflammatory cytokines.21Chronic inflammation is also closely related to T2DM.22From SARS and MERS studies, an increase in pro-inflammatory cytokines was linked to lung inflammation and extensive lung injury,23 , 24 and cytokine storms are often associated with disease severity.25 Here, the levels of inflammatory factors are elevated in the diabetic population compared to non-diabetic, Moreover, correlation analysis showed that hyperglycemia including FBG, 2 H BG and Hba1c was associated with inflammatory factors. These data indicated that hyperglycemia may affect the inflammatory responses in COVID-19 conditions.
We should note the limitations of the study. First, because a cross-sectional design was used, causal relationships could not be established. Second, the sample size was relatively small. Third, there was a discrepancy in the ages of diabetic patients with severe disease compared to non-diabetic patients in the study. Thus, it is difficult to rule out the effect of age on the poor prognosis, and some further studies of large samples are needed to explore the issue. Finally, our study was restricted to Han Chinese patients, and it is unclear whether our results can be generalized to other ethnic groups.
In summary, our findings demonstrated that COVID-19 patients with T2DM are more likely than those without T2DM to develop severe COVID-19, and lymphopenia and increased inflammation induced by hyperglycemia may be responsible for the severity of COVID-19. The data suggested that better glycemic control is essential to improve clinical outcomes in COVID-19 patients with diabetes.
Funding
This work was supported by grants from the National Natural Science Foundation of China (NSFC 81870573, 81370896, 81570730), National Key Research and Development Program of China (2016YFC1305601) and Research Project of Health Commission of Hubei Province (WJ2017H0031).
Author contributions
YYC and LY contributed equally and share first authorship. YYC and ZYW were responsible for data acquisition and interpretation. GDX and JXZ designed the study and drafted the article. YYC and LY contributed to the conception and design of the study and analysis of data. All authors contributed to its revision and approved the manuscript for submission. GDX is the guarantor and, as such, is responsible for final approval of the version to be published.
Footnotes
Declaration of competing interest: No potential conflicts of interest relevant to this article were reported.
References
- 1.Wang C., Horby P.W., Hayden F.G., Gao G.F. A novel coronavirus outbreak of global health concern. Lancet Lond Engl. 2020;395:470–473. doi: 10.1016/s0140-6736(20)30185-9. [DOI] [PMC free article] [PubMed] [Google Scholar]
- 2.Munster V.J., Koopmans M., van Doremalen N., van Riel D., de Wit E. A novel coronavirus emerging in China — key questions for impact assessment. New Engl J Med. 2020;382:692–694. doi: 10.1056/nejmp2000929. [DOI] [PubMed] [Google Scholar]
- 3.Organization WH Coronavirus Disease (COVID-2019) Situation Reports. 2020. https://www.who.int/emergencies/diseases/novel-coronavirus-2019/situation-reports Published online.
- 4.Zhu N., Zhang D., Wang W. A novel coronavirus from patients with pneumonia in China. New Engl J Med. 2019 doi: 10.1056/nejmoa2001017. Published online 2020. [DOI] [PMC free article] [PubMed] [Google Scholar]
- 5.Wang D., Hu B., Hu C. Clinical characteristics of 138 hospitalized patients with 2019 novel coronavirus-infected pneumonia in Wuhan, China. Jama. 2020:323(11). doi: 10.1001/jama.2020.1585. [DOI] [PMC free article] [PubMed] [Google Scholar]
- 6.Chen N., Zhou M., Dong X. Epidemiological and clinical characteristics of 99 cases of 2019 novel coronavirus pneumonia in Wuhan, China: a descriptive study. Lancet Lond Engl. 2020 doi: 10.1016/s0140-6736(20)30211-7. Published online. [DOI] [PMC free article] [PubMed] [Google Scholar]
- 7.Huang C., Wang Y., Li X. Clinical features of patients infected with 2019 novel coronavirus in Wuhan, China. Lancet Lond Engl. 2020 doi: 10.1016/s0140-6736(20)30183-5. Published online. [DOI] [PMC free article] [PubMed] [Google Scholar]
- 8.Barron E., Bakhai C., Kar P. Associations of type 1 and type 2 diabetes with COVID-19-related mortality in England: a whole-population study. Lancet Diabetes Endocrinol. 2020;8:813–822. doi: 10.1016/s2213-8587(20)30272-2. [DOI] [PMC free article] [PubMed] [Google Scholar]
- 9.Holman N., Knighton P., Kar P. Risk factors for COVID-19-related mortality in people with type 1 and type 2 diabetes in England: a population-based cohort study. Lancet Diabetes Endocrinol. 2020;8:823–833. doi: 10.1016/s2213-8587(20)30271-0. [DOI] [PMC free article] [PubMed] [Google Scholar]
- 10.Zhu L., She Z.-G., Song X. Association of blood glucose control and outcomes in patients with COVID-19 and pre-existing type 2 diabetes. Cell Metab. 2020 doi: 10.1016/j.cmet.2020.04.021. Published online. [DOI] [PMC free article] [PubMed] [Google Scholar]
- 11.China NHC of the PR of. COVID-19 Diagnosis and Treatment Guideline in China (7th Ed.). Published online n.d. http://en.nhc.gov.cn/2020-03/29/c_78469.htm
- 12.Su S., Wong G., Shi W. Epidemiology, genetic recombination, and pathogenesis of coronaviruses. Trends Microbiol. 2016;24:490–502. doi: 10.1016/j.tim.2016.03.003. [DOI] [PMC free article] [PubMed] [Google Scholar]
- 13.Guo L., Wei D., Zhang X. Clinical features predicting mortality risk in patients with viral pneumonia: the MuLBSTA score. Front Microbiol. 2019;10:2752. doi: 10.3389/fmicb.2019.02752. [DOI] [PMC free article] [PubMed] [Google Scholar]
- 14.Diao B., Wang C., Tan Y. Reduction and functional exhaustion of T cells in patients with coronavirus disease 2019 (COVID-19) Front Immunol. 2020;11:827. doi: 10.3389/fimmu.2020.00827. [DOI] [PMC free article] [PubMed] [Google Scholar]
- 15.Zeng C., Shi X., Zhang B. The imbalance of Th17/Th1/Tregs in patients with type 2 diabetes: relationship with metabolic factors and complications. J Mol Med. 2011;90:175–186. doi: 10.1007/s00109-011-0816-5. [DOI] [PubMed] [Google Scholar]
- 16.Nekoua M.P., Fachinan R., Atchamou A.K. Modulation of immune cells and Th1/Th2 cytokines in insulin-treated type 2 diabetes mellitus. Afr Health Sci. 2016;16:712–724. doi: 10.4314/ahs.v16i3.11. [DOI] [PMC free article] [PubMed] [Google Scholar]
- 17.von Känel R., Mills P.J., Dimsdale J.E. Short-term hyperglycemia induces lymphopenia and lymphocyte subset redistribution. Life Sci. 2001;69:255–262. doi: 10.1016/s0024-3205(01)01127-4. [DOI] [PubMed] [Google Scholar]
- 18.Zumla A., Hui D.S., Perlman S. Middle East respiratory syndrome. Lancet Lond Engl. 2015;386:995–1007. doi: 10.1016/s0140-6736(15)60454-8. [DOI] [PMC free article] [PubMed] [Google Scholar]
- 19.Cheng Y., Luo R., Wang K. Kidney disease is associated with in-hospital death of patients with COVID-19. Kidney Int. 2020;97:829–838. doi: 10.1016/j.kint.2020.03.005. [DOI] [PMC free article] [PubMed] [Google Scholar]
- 20.Zou X., Chen K., Zou J., Han P., Hao J., Han Z. Single-cell RNA-seq data analysis on the receptor ACE2 expression reveals the potential risk of different human organs vulnerable to 2019-nCoV infection. Front Med. 2020:1–8. doi: 10.1007/s11684-020-0754-0. Published online. [DOI] [PMC free article] [PubMed] [Google Scholar]
- 21.Saraiva J.P., Oswald M., Biering A. Fungal biomarker discovery by integration of classifiers. BMC Genomics. 2017;18:601. doi: 10.1186/s12864-017-4006-x. [DOI] [PMC free article] [PubMed] [Google Scholar]
- 22.Tsalamandris S., Greece FCC Hippokration General Hospital, National and Kapodistrian University of Athens, School of Medicine, Athens, Antonopoulos A.S. The role of inflammation in diabetes: current concepts and future perspectives. Eur Cardiol. 2019;14:50–59. doi: 10.15420/ecr.2018.33.1. [DOI] [PMC free article] [PubMed] [Google Scholar]
- 23.Wong C.K., Lam C.W.K., AKL W. Plasma inflammatory cytokines and chemokines in severe acute respiratory syndrome. Clin Exp Immunol. 2004;136:95–103. doi: 10.1111/j.1365-2249.2004.02415.x. [DOI] [PMC free article] [PubMed] [Google Scholar]
- 24.Mahallawi W.H., Khabour OF, Zhang Q., Makhdoum H.M., Suliman B.A. MERS-CoV infection in humans is associated with a pro-inflammatory Th1 and Th17 cytokine profile. Cytokine. 2018;104 doi: 10.1016/j.cyto.2018.01.025. (Virol. J. 12 2015):8–13. [DOI] [PMC free article] [PubMed] [Google Scholar]
- 25.Gupta K.K., Khan M.A., Singh S.K. Constitutive inflammatory cytokine storm: amajor threat to human health. J Interf Cytokine Res. 2019;40:19–23. doi: 10.1089/jir.2019.0085. [DOI] [PubMed] [Google Scholar]


