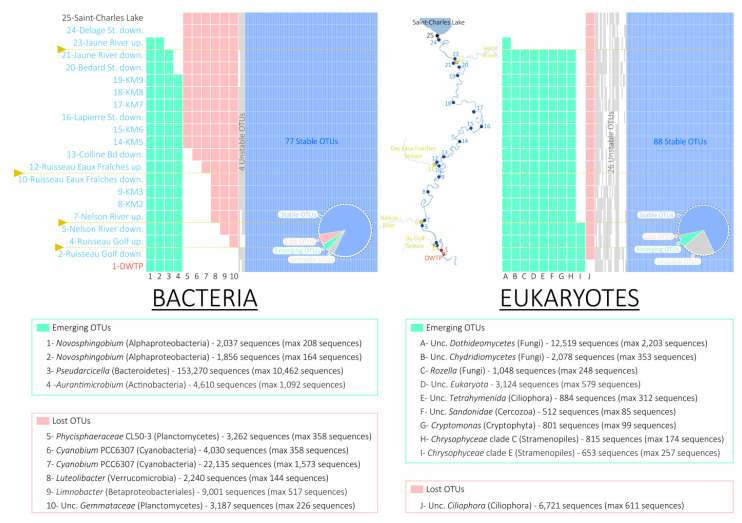
Figure 5.
Detection pattern of the dominant bacterial and eukaryotic Operational Taxonomic Units (OTUs) along the water course of the Saint-Charles River (presence/absence, subset 0.1% of the total number of bacterial and eukaryotic sequences). Colored cells (green, red, gray, or blue) illustrate the presence of the OTU, while the white cells illustrate the absence of the OTU in the river. The tributary locations are represented by the yellow lines. Numbers indicated after the OTU names are the total number of sequences corresponding to this OTU in the entire dataset and the maximum number of sequencing of this OTU detected in a sample (in brackets). Proportions of stable (blue), unstable (gray), emerging (green), and lost (red) OTUs are represented by the pie charts.

