Figure 4.
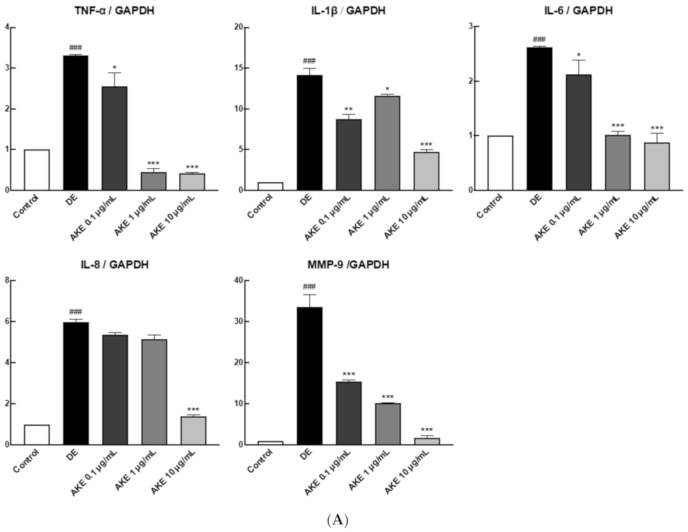
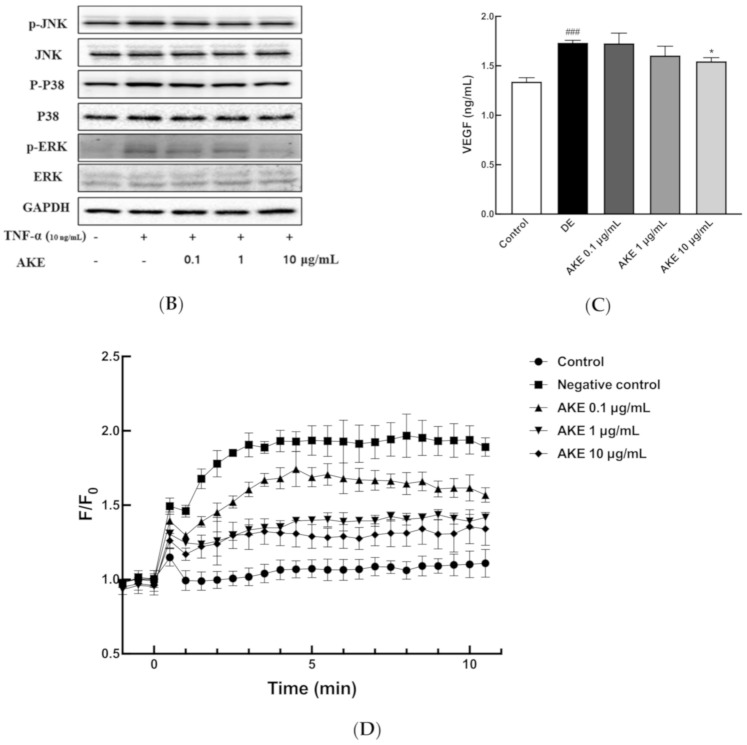
Effects of A. koraiensis ethanol extracts (AKE) on ER stress and the inflammatory response in animal model and human retinal pigmented epithelial (ARPE-19) cells. TNF-α-inducible pro-inflammatory gene expression in AKE-treated ARPE-19 cells. To induce an inflammatory reaction, phosphate buffered saline (PBS) or 10 μg/mL of TNF- α was treated, and AKE was treated in a dose-dependent manner (0, 0.1, 1, and 10 mg/mL). (A) Inflammatory cytokines were measured by qRT-PCR in order to validate the expression of each target gene (TNF-a, IL-1b, IL-6, IL-8, and MMP-9). glyceraldehyde 3-phosphate dehydrogenase (GAPDH) was used as an internal control. (B) The intracellular inflammatory signaling (MAPK) was analyzed using western blot (WB) with specific antibodies such as phospho-c-Jun N-terminal kinase (p-JNK), JNK, p-P38, P38, phospho-extracellular signal regulated kinase (p-ERK), and ERK. GAPDH was used for loading control. (C and D) endoplasmic reticulum (ER) stress was induced in ARPE-19 cells by thapsigargin (Tg), and AKE was treated with 0 (control; CON), 0.1 μg/mL (AKE 0.1), 1 μg/mL treatment (AKE 1), and 10 μg/mL treatment (AKE 10). (C) Tg-induced VEGF-α expression was measured using ELISA. (D) Tg-induced calcium ion efflux measurement using fluorescence. Data from three independent experiments have been presented as bar graphs showing mean ± SD. ### p < 0.001 versus CON; * p < 0.05, ** p < 0.01, *** p < 0.001 versus DE. Data were analyzed statistically using one-way ANOVA, followed by Tukey’s test. For [Ca2+]i determination, two-way ANOVA with repeated measures was used, followed by Tukey’s hoc test. A, C, D) Negative control to DE.


