

Summary
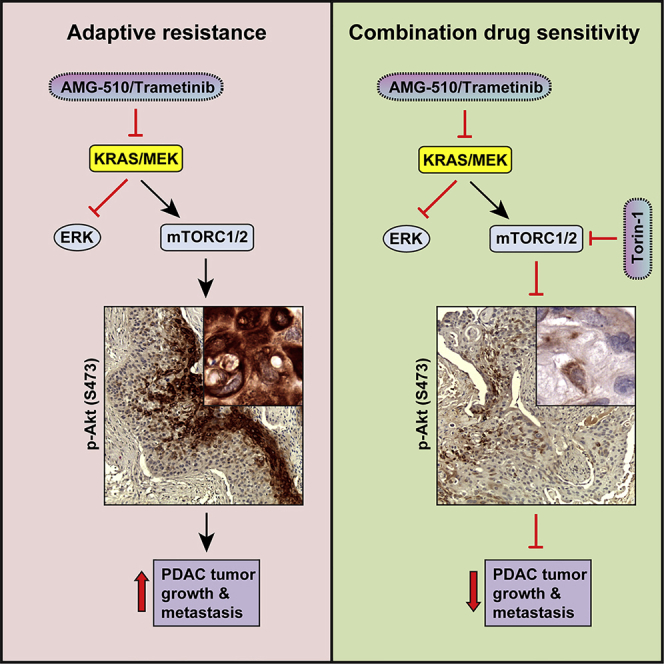
Activating KRAS mutations are found in over 90% of pancreatic ductal adenocarcinomas (PDACs), yet KRAS has remained a difficult target to inhibit pharmacologically. Here, we demonstrate, using several human and mouse models of PDACs, rapid acquisition of tumor resistance in response to targeting KRAS or MEK, associated with integrin-linked kinase (ILK)-mediated increased phosphorylation of the mTORC2 component Rictor, and AKT. Although inhibition of mTORC1/2 results in a compensatory increase in ERK phosphorylation, combinatorial treatment of PDAC cells with either KRAS (G12C) or MEK inhibitors, together with mTORC1/2 inhibitors, results in synergistic cytotoxicity and cell death reflected by inhibition of pERK and pRictor/pAKT and of downstream regulators of protein synthesis and cell survival. Relative to single agents alone, this combination leads to durable inhibition of tumor growth and metastatic progression in vivo and increased survival. We have identified an effective combinatorial treatment strategy using clinically viable inhibitors, which can be applied to PDAC tumors with different KRAS mutations.
Keywords: signal transduction, KRAS, AMG 510, PDAC, acquired resistance, protein translation, cellular toxicity, tumor regression
Graphical Abstract
Highlights
Inhibition of mutant KRAS or MEK leads to adaptive resistance in PDAC
Mutant KRAS or MEK inhibition results in ILK-Rictor-mediated activation of AKT
Targeting mutant KRAS or MEK and mTORC1/2 reduces growth and increases cytotoxicity
Combination treatment sustains suppression of PDAC tumor progression in mice
The majority of pancreatic ductal adenocarcinomas are driven by mutant KRAS, yet targeting the canonical KRAS-MEK pathway has limited clinical impact. Brown et al. identify adaptive resistance mechanisms to mutant KRAS and MEK inhibitors and show that co-targeting mTORC1/2 leads to sustained suppression of tumor progression, revealing effective treatment strategies.
Introduction
The prognosis for patients with non-resectable pancreatic ductal adenocarcinoma (PDAC) remains very poor, largely due to the lack of effective therapeutic options.1,2 The standard of care for PDAC patients is gemcitabine/Abraxane or 5-fluorouracil, leucovorin, irinotecan, and oxaliplatin (FOLFIRINOX), both of which have a high rate of treatment failure with high rates of resistant and recurrent disease.3
The majority (>90%) of PDAC tumors harbor mutations in the Kirstan rat sarcoma (KRAS) oncogene, frequently at the G12 position.4,5 Mutations in p53 and amplification of Myc oncogene are also prevalent, as is activation of the Wingless (Wnt) pathway.4
The major signaling pathway downstream of rat sarcoma (RAS), the rapidly accelerated fibrosarcoma (RAF)-mitogen-activated protein/extracellular signal-regulated kinase kinase (MEK)-extracellular-signal-regulated kinase (ERK) pathway, has been shown to be activated in the majority of PDAC tumors and is a driver of tumor growth and dissemination.6 Pharmacological targeting of mutant KRAS directly has been challenging, although recent ground-breaking medicinal chemistry has resulted in the development of mutation-specific KRAS inhibitors.7,8 The AMG510 inhibitor, specifically targeting G12C KRAS, has shown efficacy in pre-clinical models of non-small cell lung cancers (NSCLCs) and has also been shown to enhance response to immune checkpoint blockade.7 The inhibitor is, however, specific for the G12C mutation and does not inhibit the G12D mutant KRAS present in the majority of PDAC tumors. In addition, acquired resistance has been detected in NSCLC models due to upregulation of activated mutant KRAS through upstream pathways regulated by epidermal growth factor receptor (EGFR) and aurora kinase signaling.9
Targeting PDAC tumors with inhibitors of MEK, such as trametinib, has shown efficacy in pre-clinical models of PDAC,10,11 although resistance is a frequent occurrence and toxicity issues have also resulted in limited success in clinical trials.12 Inhibitors of Src homology region 2 (SH2)-containing protein tyrosine phosphatase 2 (SHP2) have been shown to prevent adaptive resistance to MEK inhibitors in multiple cancer models,13,14 and combinations of ERK and autophagy inhibitors have also demonstrated enhanced efficacy compared to single-agent treatments.15
Here, we demonstrate that, in PDAC tumors, pharmacological inhibition of either mutant-activated KRAS or MEK results in rapid adaptive activation of the mammalian target of rapamycin complex 1 (mTORC1) and mTORC2 pathways that lead to tumor re-growth after initial regression. We have identified a common pathway that promotes this adaptive response, regardless of the KRAS mutation, and have identified a combinatorial approach involving co-targeting of KRAS or MEK together with mTORC1/2 complexes to overcome the adaptive response and achieve sustained PDAC tumor growth suppression with minimal toxicity.
Results
Inhibition of Activated KRAS in PDAC Cells Results in Stimulation of mTORC2/AKT
In this study, we wanted to interrogate the effect of inhibiting KRAS and its downstream effector pathways to determine effects on PDAC tumor growth, with an emphasis on identifying potential resistance mechanisms.
We engineered a human PDAC cell line, PK-8, which expresses mutant (G12R) KRAS,16 to express a doxycycline-inducible KRAS short hairpin RNA (shRNA). We silenced KRAS expression by exposing PK-8 cells to doxycycline and then analyzed tumor growth in vivo. Subcutaneous growth of the xenograft was initially significantly inhibited by doxycycline-induced KRAS silencing, relative to control tumors (Figures 1A and S1A). However, this inhibition was not sustained and the tumors grew back. Importantly, the levels of expression of KRAS in the shKRAS tumors remained markedly suppressed, even after 60 days of doxycycline exposure (Figure 1B), indicating that the re-growth was due to the expression of compensatory growth pathways. Next, we examined the activation status of the two major downstream effectors of RAS, namely MEK-ERK and protein kinase B (PKB, also known as AKT) in PK-8 cells cultured in the presence of doxycycline. As can be seen in Figure 1C, doxycycline-mediated KRAS suppression induced a robust inhibition of expression of KRAS, with concomitant inhibition of the phosphorylation of ERK. However, we found that, within the same time frame, the phosphorylation of AKT on Ser-473 was significantly enhanced in response to silencing KRAS expression. These data suggested that, although suppression of KRAS results in the inhibition of the MEK-ERK pathway, it simultaneously leads to the activation of AKT, a major component of the cell survival pathway.
Figure 1.

Inhibition of Activated KRAS in PDAC Cells Results in Stimulation of mTORC2/AKT
(A) Tumor growth curve of PK-8 xenografts (n = 4–6; mean ± SEM) administered dox to induce KRAS shRNA. ∗∗∗p < 0.001; two-way ANOVA.
(B) Representative images of tumor tissue sections from PK-8 xenografts stained for expression of KRAS. Scale bar represents 100 μm; inset, 10 μm.
(C) Immunoblotting of ERK and AKT phosphorylation in PK-8 cells expressing shKRAS and cultured with (+) or without (−) dox for 72 h to induce KRAS shRNA.
(D) Immunoblotting of ERK, AKT, and Rictor phosphorylation in MIA PaCa-2 cells cultured with AMG 510 for 72 h.
(E) Immunoblotting of ERK and AKT phosphorylation in human and mouse pancreatic cancer cell lines cultured with escalating concentrations of trametinib for 72 h.
(F) Immunoblotting of Rictor phosphorylation in human and mouse pancreatic cell lines cultured as described in (E).
See also Figure S1.
We wanted to determine whether pharmacological inhibition of KRAS using the G12C mutant KRAS inhibitor, AMG 510,7,17 mimicked these changes in signaling. The G12C KRAS mutation occurs relatively infrequently in PDAC, compared to other mutations at the G12 position. However, a PDAC cell line, MIA PaCa-2, harbors a G12C mutation in KRAS and has been used in studies evaluating KRAS inhibitors.7,14 We cultured MIA PaCa-2 cells with increasing concentrations of AMG 510 for 72 h and assessed the MEK-ERK and AKT signaling pathways. Treatment with AMG 510 resulted in suppression of ERK phosphorylation but, as with KRAS silencing, resulted in a significant increase in phosphorylation of AKT on Ser-473 (Figure 1D). Because the major kinase responsible for phosphorylating AKT on Ser-473 is mTORC2,18 we wanted to determine the potential mechanism for activation of mTORC2 under these conditions. An obligate and specific component of mTORC2 is rapamycin-insensitive companion of mammalian target of rapamycin (Rictor).18 We therefore examined Rictor Thr-1135 phosphorylation in the cells cultured with AMG 510 and observed that Rictor phosphorylation is stimulated in an identical manner to AKT upon KRAS inhibition (Figure 1D). These data point to potential mechanisms of adaptive resistance to KRAS inhibition in PDAC cells.
Next, we wished to determine whether inhibition of MEK downstream of KRAS also resulted in adaptive resistance in vivo and whether the resistance also involved the compensatory activation of AKT via Rictor/mTORC2. We expanded the studies to four models of PDAC harboring distinct KRAS mutations at G12: PK-8 (G12R) and MIA PaCa-2 (G12C) human PDAC cell lines, a PDAC clone derived from the KRASG12D/Pdx1-Cre/Tp53/RosaYFP (KPCY) (G12D) transgenic mouse model of PDAC (PENN6620c1),19 and a cell line derived from a patient-derived xenograft (PDX), PaCa41 (G12V).20 To analyze signaling pathways downstream of RAS, we exposed the cells in vitro to increasing concentrations of trametinib, a clinically approved pharmacological inhibitor of MEK,21 for 72 h and examined protein phosphorylations by western blotting. Trametinib induced strong inhibition of phosphorylation of ERK in all four models (Figure 1E), suggesting a common response, regardless of the type of activation mutation in KRAS.
Analysis of the phosphorylation status of AKT, however, demonstrated that the inhibition of MEK results in a strong “activation” of AKT, as judged by the significant increase in phosphorylation of AKT on Ser-473 (Figure 1E), in all four models.
As with the inhibition of KRAS, we wanted to determine whether the stimulation of AKT phosphorylation was accompanied by increased phosphorylation of Rictor. Indeed, we found that phosphorylation of Rictor was also stimulated upon MEK inhibition with trametinib in all 4 PDAC cell lines (Figures 1F and S1B), suggesting the activation of a compensatory pathway to AKT activation through Rictor. We did observe an increase in total Rictor in the PaCa41 PDX-derived cell line in response to trametinib treatment, which may be due to expected heterogeneous responses across cell lines.
KRAS and MEK Inhibition Results in Integrin-Linked Kinase (ILK)/Rictor-Mediated Activation of mTORC2/AKT
To determine whether Rictor, and its phosphorylation, was involved in the stimulation of phosphorylation of AKT on Ser 473 upon inhibition of KRAS or MEK, we cultured MIA PaCa-2 cells with AMG 510 or trametinib in the absence or presence of Rictor small interfering RNA (siRNA). Depletion of Rictor expression resulted in significant suppression of AKT phosphorylation that was induced by either AMG 510 or trametinib (Figure 2A).
Figure 2.

KRAS and MEK Inhibition Results in ILK/RICTOR-Mediated Activation of mTORC/AKT
(A) Immunoblotting of ERK, AKT, and Rictor phosphorylation in MIA PaCa-2 cells depleted of Rictor using siRNA and cultured with trametinib or AMG 510 for 72 h.
(B) Immunoblotting of ERK, AKT, and Rictor phosphorylation in MIA PaCa-2 cells cultured with QLT-0267 and AMG 510 for 72 h.
(C) Immunoblotting of ERK, AKT, and Rictor phosphorylation in human pancreatic cell cultured with QLT-0267 and trametinib.
(D) Immunoblotting of ERK, AKT, and Rictor phosphorylation in MIA PaCa-2 cells transfected with siRNAs targeting ILK and cultured with trametinib or AMG-510 for 72 h.
(E) Co-immunoprecipitation of Rictor and ILK from MIA PaCa-2 cells cultured with (+) or without (−) trametinib for 72 h. Molecular weight ladder is indicated.
(F) Co-immunoprecipitation of Rictor and ILK from MIA PaCa-2 cells cultured as described in (E) with (+) or without (−) QLT-0267 for 72 h.
(G) Model depicting phosphorylation of Rictor and phosphorylation and activation of AKT in response to exposure to KRAS and MEK inhibitors.
(H) Immunoblotting of ERK and AKT phosphorylation in human and mouse pancreatic cancer cell lines cultured with Torin 1 for 72 h.
(I) Model depicting the impact of inhibiting mTORC1/2 on cell growth and proliferation.
See also Figure S1.
The phosphorylation of Rictor on Thr-1135 has previously been suggested to be mediated by S6 kinase (S6K)22 downstream of mTORC1. To determine whether the AMG 510 or trametinib-induced increase in Rictor phosphorylation was mediated by S6K, we assessed the phosphorylation status of S6K (activation) after AMG 510 or trametinib treatment. Phosphorylation of S6K was in fact suppressed by inhibiting KRAS or MEK (see Figures 4A and 4B), suggesting that the stimulation of Rictor phosphorylation at Thr-1135 under these conditions is mediated through other pathways.
Figure 4.

Co-targeting KRAS-MEK and mTORC1/2 Inhibits Protein Translation and Cell Survival Pathways in PDAC Cells
(A) Immunoblotting of pS6K and 4E-BP1 phosphorylation and levels of cleaved Casp3 and histone H3 phosphorylation in MIA PaCa-2 cells cultured with AMG 510 and Torin 1 for the indicated times.
(B) Immunoblotting of pS6K and 4E-BP1 phosphorylation and levels of cleaved Casp3 and histone H3 phosphorylation in MIA PaCa-2 cells incubated with trametinib and Torin 1 for the indicated times.
(C) Immunoblotting of pS6K and 4E-BP1 phosphorylation and levels of cleaved Casp3 in human and mouse pancreatic cancer cell lines cultured with trametinib and escalating concentrations of Torin 1 for 72 h.
(D) Immunoblotting of pS6K and 4E-BP1 phosphorylation and levels of cleaved Casp3 and histone H3 phosphorylation in PK-8 cells incubated with trametinib and Torin 1 for the indicated times.
(E) Model depicting the impact of inhibiting MEK and mTORC1/2 downstream signaling pathways on cell proliferation, protein translation, and cell growth.
See also Figure S1.
We have previously demonstrated that Rictor phosphorylation on Thr-1135 can be regulated by ILK,23 which can also regulate AKT Ser-473 phosphorylation in some contexts.24,25 We therefore treated AMG-510-exposed MIA PaCa-2 PDAC cells with a highly selective inhibitor of ILK activity, QLT-0267,25 and evaluated Rictor and AKT phosphorylation. The range of concentrations of QLT-0267 used is similar to those reported previously to result in on-target inhibition of ILK activity, including inhibition of phosphorylation of AKT on Ser473, in cancer cells.23,25, 26, 27 Inhibition of ILK activity resulted in effective dose-dependent suppression of both Rictor Thr-1135 and AKT Ser-473 phosphorylation (Figure 2B). Similarly, exposure of trametinib-treated MIA PaCa-2 and PK-8 PDAC cell lines to the ILK inhibitor resulted in effective suppression of both Rictor Thr-1135 and AKT Ser-473 phosphorylation (Figure 2C). Importantly, this inhibition of Rictor and AKT phosphorylation is mimicked by siRNA-mediated knockdown of ILK in trametinib-treated MIA PaCa-2 cells (Figures 2D and S1C), and Rictor and ILK interact in trametinib-treated PDAC cells as shown by endogenous co-immunoprecipitation (Figure 2E). Furthermore, trametinib-exposed cells cultured in the presence of QLT-0267 showed reduced levels of pRictor and pAKT in the Rictor immunoprecipitates (Figure 2F), suggesting a role of ILK activity in regulating Rictor phosphorylation in the context of MEK inhibition. Although S6K-mediated phosphorylation of Rictor on Thr-1135 has been suggested to impede mTORC2 activity,22 it appears that, in the context of KRAS or MEK inhibition, the ILK-mediated phosphorylation of Rictor promotes mTORC2-mediated phosphorylation of AKT, because the inhibition of Rictor phosphorylation simultaneously results in inhibition of AKT phosphorylation. These data suggest that the compensatory activation of AKT, in response to KRAS and MEK inhibition in mutant KRAS-driven PDAC cells, can be initiated via an ILK/Rictor-mediated activation of mTORC2 (Figure 2G). The data do show that ILK modulates the phosphorylation of Rictor at T1135 independently of phosphorylation at this site by S6K; however, whether ILK directly phosphorylates Rictor at this site or whether ILK functions to facilitate the phosphorylation of Rictor by another kinase will require further investigation using approaches such as in vitro kinase assays and functional rescue of Rictor phosphorylation in the background of ILK depletion.
Inhibition of mTORC1 and 2 in PDAC Cells Results in Compensatory Activation of MEK/ERK
Although the major signaling pathway downstream of RAS is the RAF-MEK-ERK pathway, activated RAS has also been shown to activate the phosphatidylinositol 3-kinase (PI3K)-AKT pathway.5 We therefore wanted to evaluate the effect of inhibiting AKT downstream of RAS. To do this, we treated PDAC cells with Torin 1, a potent inhibitor of mTORC1 and 2 complexes.28 We hypothesized that inhibition of these two complexes simultaneously would be an effective way to not only inhibit activation of AKT but also to inhibit protein translation and synthesis downstream of AKT/mTORC1. We observed that, for Torin 1 concentrations above 100 nM, all 4 cell lines demonstrated clear, consistent, dose-dependent suppression of phosphorylation of AKT at Ser-473, as expected (Figure 2H). However, this resulted in a significant increase in the phosphorylation of ERK (Figure 2H), suggesting the compensatory activation of the MEK-ERK pathway upon inhibition of mTORC1/2 (Figure 2I), as had been reported previously for PI3K-mTORC2 inhibitors.29
Combinatorial Inhibition of KRAS or MEK with mTORC1/2 Prevents Activation of Compensatory Pathways in PDAC Cells
Based on the results described in Figures 1 and 2, we next treated the PDAC cell lines described above with a combination of either KRAS or MEK and mTORC1/2 inhibitors and evaluated downstream signaling pathways. As dramatically illustrated in Figure 3A, which depicts a time course of the activation of compensatory pathways in MIA PaCa-2 PDAC cells by the KRAS(G12C) inhibitor AMG 510 and Torin 1 as single agents, the combination of AMG 510 and Torin 1 resulted in sustained suppression of ERK phosphorylation and also of Rictor-1135 phosphorylation and AKT Ser-473 phosphorylation (Figure 3A). This combinatorial effect was dose responsive, with substantial suppression of activation of compensatory pathways through treatment with the AMG 510/Torin 1 combination in a dose-dependent fashion (Figure 3B). Furthermore, the combination of trametinib and Torin 1 in the MIA PaCa-2 PDAC cells also abrogated the activation of both ERK and AKT, and the inhibition of phosphorylation of ERK was even more robust than that observed with AMG 510 treatment (Figure 3C).
Figure 3.

Combinatorial Inhibition of KRAS or MEK with mTORC1/2 Prevents Upregulation of ERK and AKT Phosphorylation
(A) Immunoblotting of ERK, AKT, and Rictor phosphorylation in MIA PaCa-2 cells cultured with AMG 510 and Torin 1 for the indicated times.
(B) Immunoblotting of ERK, AKT, and Rictor phosphorylation in MIA PaCa-2 cells cultured with AMG 510 and escalating concentrations of Torin 1 for 72 h.
(C) Immunoblotting of ERK and AKT phosphorylation in MIA PaCa-2 cells incubated with trametinib and 500 nM Torin 1 for the indicated times.
(D) Immunoblotting of ERK and AKT phosphorylation in human and mouse pancreatic cancer cell lines cultured with trametinib and escalating concentrations of Torin 1 for 72 h.
(E) Immunoblotting of Rictor phosphorylation in human and mouse pancreatic cell lines cultured as described in (D).
(F) Immunoblotting of ERK and AKT phosphorylation in PK-8 cells incubated with MEK inhibitors and TORC1/2 inhibitors for 72 h.
(G) Model depicting the impact of inhibiting MEK and mTORC1/2 in combination on cell growth and proliferation.
These results are mimicked in other PDAC cell lines when treated with combinations of various MEK and mTORC1/2 inhibitors (Figures 3D–3F and S1D).
These data demonstrate that effective simultaneous suppression of either KRAS or MEK in combination with mTORC1/2 can prevent the activation of compensatory adaptive resistance pathways using various clinically approved inhibitors against these targets (Figure 3G).
Co-targeting KRAS-MEK and mTORC1/2 Inhibits Protein Translation and Cell Survival Pathways in PDAC Cells and Enhances Toxicity
Next, we wanted to determine whether the combination of simultaneous inhibition of KRAS or MEK-ERK and mTORC1/2-AKT pathways resulted in the suppression of downstream components of the mTORC1/2 pathway that control protein translation and cell survival. Combinatorial treatment of the KRAS G12C cell line, MIA PaCa-2, with AMG 510 and Torin 1 resulted in the inhibition of phosphorylation of the mTORC2 and mTORC1 targets, forkhead box O-3a (FOXO3a), S6K and eukaryotic translation initiation factor 4E (eIF4E)-binding protein 1 (4E-BP1), respectively, with concomitant increase in the cell death marker, cleaved caspase 3 (Clv-Csp3), and inhibition of the phosphorylation of the proliferation marker, histone-H3 (Figures 4A, 4B, and S1D). These data are again mimicked in four PDAC cell lines when treated with a combination of the MEK inhibitor, trametinib, and mTORC1/2 inhibitor, Torin 1 (Figures 4C, 4D, S1E, and S1F). Similar findings were also observed after treatment with the combination of different MEK inhibitor, selumetinib, and mTORC1/2 inhibitor, AZD2014 (Figure S1E).
Mitogen-activated protein kinase-interacting kinase 1 (MNK) is known to regulate eIF4E, which is involved in protein translation. Of note, we found that, in PK-8 cells, only the combination of trametinib and Torin 1 resulted in substantial suppression of MNK phosphorylation and downstream phosphorylation of eIF4E (Figures S1E and S1F), although single agents failed to suppress the phosphorylation of these effectors, suggesting that concerted suppression of MEK, ERK, and TORC1/2 is required for effective inhibition of eIF4E, protein translation, and cell growth (Figure 4E). Inhibition of MNK activity with a specific inhibitor of MNK, eFT-508, results in robust suppression of phosphorylation of eIF4E in the PK-8 cells, showing that eIF4E is a target of MNK activity in this cell line (Figure S1G).
Next, we evaluated single agents and combinations for their effects on cell growth/proliferation and cell death. We observed that, although the inhibition of KRAS or mTORC1/2 alone resulted in modest levels of cytotoxicity in the MIA PaCa-2 cells, the combination of AMG 510 and Torin 1 resulted in dose-dependent, synergistic cytotoxicity and cell death (Figures 5A and 5B). Similarly, inhibition of MEK alone in these cells had a modest impact on cytotoxicity, although the combination of trametinib and Torin 1 elicited a robust, synergistic cytotoxic effect (Figures 5C and 5D).
Figure 5.

Co-targeting KRAS-MEK and mTORC1/2 Inhibits Cell Growth and Synergistically Enhances Cell Cytotoxicity in PDAC Cells
(A) Evaluation of cytotoxic cell death of MIA PaCa-2 cells cultured for 7 days with escalating concentrations of AMG 510 and Torin 1 (n = 3).
(B) Combination Index (CI) values calculated from representative data displayed in (A).
(C) Evaluation of cytotoxic cell death of MIA PaCa-2 cells cultured for 7 days with escalating concentrations of trametinib and Torin 1 (n = 3).
(D) CI values calculated from representative data displayed in (C).
(E) Kinetic evaluation of cell proliferation of PK-8 cells cultured with escalating concentrations of trametinib and Torin 1 (n = 3).
(F) Kinetic evaluation of cytotoxic cell death of PK-8 cells cultured with 0.1, 1, and 10 nM trametinib in combination with escalating concentrations of Torin 1 (n = 3).
(G) CI values calculated from representative data at the 120-h time point shown in (F).
(H) Evaluation of cytotoxic cell death of KPCY cells cultured for 7 days with escalating concentrations of trametinib and Torin 1.
(I) CI values calculated from representative data displayed in (H).
∗p < 0.05; ∗∗p < 0.01; ∗∗∗p < 0.001; one-way ANOVA. See also Figure S1.
We further investigated the cytostatic and cytotoxic effects of trametinib and Torin 1 in the PK-8 and KPCY cell lines. We found that, although inhibition of either MEK or mTORC1/2 alone resulted in dose-dependent inhibition of cell growth (Figures 5E and S1H), only the combination of trametinib and Torin 1 led to cell death and cytotoxicity in a synergistic fashion (Figures 5E–5I). These data demonstrate that inhibition of KRAS/MEK or mTORC1/2 alone, although resulting in inhibition of cell growth, does not result in cell killing, likely due to the activation of the compensatory pathways. However, combinatorial inhibition of both nodes induces synergistic cytotoxicity and cell death that could result in sustained tumor growth and regression in vivo.
Combinatorial Inhibition of KRAS or MEK with mTORC1/2 Induces Sustained and Durable Inhibition of Growth of PDAC Tumors In Vivo
The effective treatment of PDACs has been challenging, and targeting the RAS-MEK-ERK pathways has so far not been effective clinically. In the previous experiments above, we have demonstrated that single-agent suppression of KRAS, MEK-ERK, or mTORC1/2 results in the activation of counter compensatory pathways that prevents effective tumor growth suppression and cytotoxicity. Furthermore, suppression of KRAS expression alone also resulted only in transient growth inhibition, with eventual tumor re-growth. However, simultaneous combinatorial inhibition of both pathways prevents the activation of compensatory resistance mechanisms, inhibits cell proliferation, and induces cell death.
We therefore wanted to determine whether the simultaneous inhibition of both downstream pathways would prevent resistance and result in sustained inhibition of tumor growth in vivo. Treatment of animals harboring MIA PaCa-2 KRAS G12C tumors with AMG 510 alone results in initial growth suppression and regression but with eventual resistance and tumor growth (Figures 6A, 6B, and S2A). However, combinatorial treatment with AMG 510 and Torin 1 results in sustained growth inhibition and tumor regression in several mice (Figures 6A and 6B). This combination leads to 100% survival of mice in stark contrast to single-agent treatments (Figure 6C).
Figure 6.

Combinatorial Inhibition of KRAS or MEK with mTORC1/2 Induces Sustained and Durable Inhibition of Growth of PDAC Tumors In Vivo
(A, D, G, and J) Tumor growth curves of (A and D) MIA PaCa-2 xenografts (n = 6–9; mean ± SEM), (G) PK-8 xenografts (n = 6–8; mean ± SEM), and (J) KPCY syngeneic tumors (n = 7–10; mean ± SEM) administered drugs as single agents or in combination. ∗∗p < 0.01; ∗∗∗p < 0.001; two-way ANOVA.
(B, E, H, and K) Waterfall plots of the response of individual tumors in mice administered (B) AMG 510 and Torin 1 after 45 days (MIA PaCa-2) of drug administration or (E, H, and K) trametinib and Torin 1 after 73 days (MIA PaCa-2), 44 days (PK-8), or 35 days (KPCY) of drug administration.
(C, F, I, and L) Survival analysis of NOD/SCID IL2Rγ-/- (NSG) mice bearing (C and F) MIA PaCa-2 or (I) PK-8 tumors or (L) C57BL/6 mice bearing KPCY tumors and administered therapeutic agents as described in (A). For the MIA PaCa-2 model, the treatment arms administered AMG ± Torin 1 and trametinib ± Torin 1 are illustrated in separate panels but were evaluated in parallel in the same study with a single set of controls (vehicle and Torin 1), which are shown in both sets of panels for the purposes of clarity.
See also Figures S2 and S3.
Next, we wanted to investigate whether the combination of trametinib and Torin 1 would result in similar effects. First, we conducted a dose-escalation study for trametinib in PK-8 xenografts and determined that a trametinib dose of 0.5 mg/kg would simultaneously reduce tumor growth while limiting systemic drug toxicity (Figure S2B). We then investigated the effect of using trametinib and Torin 1 in 3 different PDAC models. Similar to our findings with AMG 510 and Torin 1, the combination of trametinib and Torin 1 resulted in durable inhibition of tumor growth, regression, and increased survival in the MIA PaCa-2 (Figures 6D–6F and S2A), PK-8 (Figures 6G–6I and S2C), and KPCY (Figures 6J–6L and S2D) tumor models. Although Torin 1 has not been approved clinically, it has been tested in vivo and has been shown to be efficacious in combination with insulin-like growth factor 1 (IGF-1) inhibitors,25 demonstrating efficacy of Torin 1 in vivo.
Importantly, we did not observe significant changes in body weight of any of the mice during treatment with any of the inhibitors individually or in combination (Figures S2E–S2G), indicating that the concentrations of the compounds used in these treatments were well tolerated. Furthermore, liver tissue sections from control and treated animals were reviewed by a board-certified pathologist (D.F.S.), and no evidence of toxicity, including steatohepatitis, was observed in any of the animals (Figure S2H), suggesting that the treatments did not result in liver toxicity.
Co-targeting KRAS-MEK and mTORC1/2 Effectively Prevents the Formation of Metastases by PDAC Tumors In Vivo
In addition to the re-growth of the PK-8 tumors in response to treatment with trametinib, we also observed a dramatic increase in metastasis that paralleled increasing doses of the inhibitor (Figure S3A), indicating that the adaptive resistance to trametinib may be accompanied by enhanced metastatic propensity. Further investigation of the presence of metastases in the MIA PaCa-2 tumor model revealed that, in animals treated with either AMG 510 or, in particular, trametinib, there is a dramatic increase in the percentage of animals exhibiting grossly visible metastases in the lungs, liver, and lymph nodes (Figure S3B). In striking contrast, the combination of trametinib and Torin 1 effectively prevents the formation of metastasis. In particular, the number of grossly visible liver metastases is significantly increased in trametinib-treated animals, although the combination effectively suppresses the level of liver metastasis (Figure S3C). Furthermore, ex vivo analysis by bioluminescence imaging demonstrated the presence of luciferase-positive PK-8 cells in the lungs and lymph nodes of animals treated with trametinib (Figure S3D). We established tumor cell lines from these metastatic foci and evaluated levels of pERK and pAKT by western blot. Relative to wild-type parental cells, the cells derived from lung and lymph node metastases demonstrated elevated levels of pERK and pAKT and further increased levels of pAKT in response to trametinib treatment (Figure S3E). Collectively, these data suggest that, although inhibiting KRAS or MEK in isolation may induce metastasis, co-targeting with mTORC1/2 inhibitors effectively prevents metastatic progression by PDAC tumors in vivo.
Combinatorial Inhibition of KRAS or MEK with mTORC1/2 Increases Cell Death and Mitigates pAKT-Driven Adaptive Resistance of PDAC Tumors to MEK Inhibitors In Vivo
Analysis of the PK-8 tumors at endpoint indicated that trametinib-alone-treated recurrent tumors have a high proliferative index (bromodeoxyuridine [BrdU] staining) and low levels of apoptosis (cleaved caspase-3 staining; Figures 7A–7C) with extensive hypoxia as determined by immunostaining for pimonidazole and carbonic anhydrase IX (CAIX) (Figures S4A–S4C). On the other hand, the combination-treated tumors showed significantly decreased levels of proliferation (BrdU staining) but, importantly, very high levels of caspase 3 activation (Figures 7A–7C) and sustained high levels of hypoxia, as indicated by strong immunostaining for pimonidazole (Figures S4A–S4C). Similar results for proliferation and caspase 3 activation were observed in the MIA PaCa-2 xenografts treated with AMG 510 or trametinib in combination with Torin 1, with significantly increased levels of cleaved caspase 3 and decreased BrdU, compared to monotherapy (Figures 7D and 7E).
Figure 7.

Combinatorial Inhibition of KRAS or MEK with mTORC1/2 Increases Cell Death and Mitigates pAKT-Driven Adaptive Resistance of PDAC Tumors to MEK Inhibitors In Vivo
(A) Representative images of tumor tissue sections from PK-8 xenografts administered trametinib and Torin 1 and stained for H&E, BrdU, and cleaved caspase 3. Scale bar represents 100 μm; inset, 10 μm.
(B and C) Quantification of BrdU (B; n = 5, each 5 fields) and cleaved caspase-3 (C; n = 5, each 5 fields).
(D and E) Quantification of BrdU (D; n = 5, each 5 fields) and cleaved caspase-3 (E; n = 5, each 5 fields) in tumor tissue sections from MIA PaCa-2 xenografts administered AMG 510 and Torin 1.
(F) Representative images of tumor tissue sections from PK-8 xenografts stained for pERK and pAKT. Scale bar represents 100 μm; inset, 10 μm.
(G and H) Quantification of pERK (G; n = 5, each 5 fields) and pAKT (H; n = 5, each 5 fields).
(I) Representative images of tumor tissue sections from MIA PaCa-2 xenografts stained for pERK and pAKT. Scale bar represents 100 μm; inset, 10 μm.
(J) Immunoblotting of PK-8 tumors (n = 3–7) for the indicated proteins. Lysates are from tumors harvested at the tumor volume endpoint for each group. T0 refers to tumors harvested at the time of initiation of treatment to serve as baseline data.
∗p < 0.05; ∗∗p < 0.01; ∗∗∗p < 0.001; two-way ANOVA. See also Figures S4 and S5.
To determine whether the recurrence of tumor growth in response to monotherapy in vivo was due to compensatory activation of resistance pathways observed in vitro, we examined the levels of pERK and pAKT, by immunostaining, in PK-8 tumors from animals treated with trametinib and MIA PaCa-2 tumors from animals treated with AMG 510, alone and in combination with Torin 1 at the study endpoint. Although some heterogeneity in the levels of pERK and pAKT was evident across the treatment groups, PK-8 tumors from animals treated with trametinib showed significantly more tumor cells expressing high levels of phosphorylation of AKT concomitant with significantly lower levels of phosphorylation of ERK compared to controls (Figures 7F–7H). Conversely, PK-8 tumors from Torin-1-treated animals showed low levels of pAKT coupled with significantly higher levels of pERK. Furthermore, tumors exposed to combination therapy showed significantly reduced levels of pAKT and pERK, relative to monotherapy (Figures 7F–7H). Similar results were observed in MIA PaCa-2 tumors administered AMG 510 (Figure 7I), although these tumors exhibited somewhat more heterogeneous pERK expression with sustained treatment. To confirm our observations regarding the chronic nature of suppression of pERK and activation of pAKT ascertained in the tumor tissues, we evaluated expression of these proteins in MIA PaCa-2 cells cultured in the presence of AMG 510 for 7 days. Congruent with our observations at 72 h, inhibition of KRAS for 7 days resulted in sustained high levels of pAKT as well as low levels of pERK, although levels of pERK began to rebound slightly at this late time point (Figure S5A), indicating that some feedback-mediated re-activation of pERK may occur in this model.17 Western blot analysis of PK-8 tumors from animals treated with trametinib for 7 days or for several weeks (endpoint) showed high, sustained levels of pAKT coupled with suppression of pERK (Figure S5B). Similar to the trametinib monotherapy treatment arm, sustained suppression of levels of pERK was observed in tumors treated with trametinib and Torin 1 in combination, concomitant with durable reductions in downstream effectors of mTORC1/2, including pS6K, p4EBP-1, and pFOXO3a (Figure 7J). Western blotting of these tumor tissues also demonstrated high levels of Clv-Csp3 and CAIX but abrogation of histone-H3 phosphorylation in mice treated with the combination compared to vehicle treatment (Figure 7J). These data strongly suggest that recurrence of PDAC tumors subsequent to treatment with inhibitors of KRAS or MEK is driven largely by the compensatory activation of mTORC1/2 complexes, with some feedback-mediated upregulation of pERK expression, the extent of which is heterogeneous, and that this resistance can be overcome by using these inhibitors in combination with mTORC1/2 inhibition.
Discussion
Patients with PDAC tumors have few viable therapeutic options. It is clear that mutations in KRAS occur frequently and are early drivers of PDAC progression. Although inhibitors of the major KRAS-mediated signaling pathways, such as MEK-ERK and PI3K-AKT, have been developed and tested in pre-clinical models and in clinical trials, adaptive resistance has been a major hurdle in achieving sustained and durable remissions. As we enter into an era of direct inhibition of mutant KRAS with mutation-specific small-molecule inhibitors, it is critical to identify adaptive resistance mechanisms to these inhibitors and develop combinatorial therapeutic strategies to mitigate resistance.
There have been many attempts at identifying co-vulnerabilities in mutant KRAS-driven tumors using synthetic-lethal approaches,30 which have yielded several targets but have failed to reveal universal KRAS synthetic lethal target(s), possibly due to the heterogeneity of the tissues of origin, mutation-specific heterogeneity in downstream signaling, and inherent differences and limitations in the synthetic lethal screens.30,31 In addition, recent studies evaluating adaptive responses to MEK/ERK and KRAS inhibitors have identified autophagy,15 as well as positive feedback loops resulting in the activation of upstream pathways,8,9,13,14 as potential combinatorial approaches for the treatment of mutant KRAS-driven cancers. Interestingly, the synergy that we observed with MEK inhibitors and Torin 1, which is an inducer of autophagy,28 is different from previous reports showing that chloroquine, an inhibitor of autophagy, was synergistic when used in combination with MEK inhibitors.15 These results suggest that distinct mechanisms may underpin these combination strategies and elucidation of such potential mechanistic differences constitutes an area of active future investigation. Inhibitors of the SHP2 phosphatase14 have also been recently demonstrated to inhibit non-small cell lung as well as MIA PaCa-2 PDAC tumor growth in combination with an inhibitor of KRAS, although a detailed analysis of whether this combination is effective in multiple PDAC models with activated KRAS/MEK has not been determined.
Here, we have focused our studies on mutant-KRAS PDAC tumor models and utilized largely pharmacological interventions of KRAS/MEK and mTORC1/2, including the KRAS G12C inhibitor, AMG 510, together with biochemical analyses of signaling pathways, to uncover co-vulnerabilities and adaptive mechanisms leading to treatment resistance.
We find that genetic silencing of KRAS in human PDAC tumor cells resulted in a rapid concomitant activation of AKT, resulting in tumor recurrence. Pharmacological inhibition of KRAS (G12C) as well as MEK also resulted in tumor recurrence after initial growth suppression and regression. The recurrence inevitably involved the activation of AKT as determined by AKT Ser-473 phosphorylation. We have identified a pathway involving ILK and Rictor in the activation of AKT via mTORC2 in response to the inhibition of either KRAS or MEK. These data demonstrate that acute suppression of the RAS-MEK-ERK pathway results in rapid activation of the mTORC2 signaling pathways, leading to enhancement of tumor cell growth and survival. Rictor and mTORC2 have been implicated in the progression of PDACs,32 and Rictor expression is correlated with poor PDAC patient outcome.33 Because mTORC2-mediated activation of AKT results in the activation of mTORC1 complex and protein translation and synthesis, we utilized inhibitors of mTOR kinase that inactivate both mTORC2- and mTORC1-regulated pathways.
We also observed that, in contrast to canonical signaling through mTORC1/2, treatment with AMG 510 or trametinib in the context of PDAC results in compensatory phosphorylation and activation of AKT but in suppression of phosphorylation of S6K and 4E-BP1 downstream of mTORC1, suggesting that inhibition of KRAS or MEK results in the suppression of S6K phosphorylation independent of its effects on ILK/Rictor-mediated phosphorylation of AKT and downstream signaling to mTORC1. Furthermore, our results show that, although pSK6 and p4E-BP1 are suppressed in response to MEK inhibition, other AKT substrates, notably FOXO3a (Figure S1D), are activated, suggesting a specific effect of KRAS and MEK inhibition on the mTORC1 signaling axis, similar to previous studies in KRAS mutant lung cancer showing that inhibition of KRAS G12C with ARS1620 results in inhibition of pS6K.34
Interestingly, inhibition of mTORC1 and 2 complexes with potent inhibitors, such as Torin 1 or AZD2014, resulted in acute stimulation of ERK phosphorylation, as has been observed previously by others,29 and treatment of multiple PDAC tumors with Torin 1 alone had very limited effect on tumor growth in vivo.
These data demonstrate that tumor cell plasticity and rapid adaptation to stress result in the activation of compensatory signaling pathways that allow the tumor cells to continue to grow and survive if either KRAS/MEK or mTORC1/2 are inhibited individually.
These data therefore suggested that simultaneous inhibition of both KRAS/MEK and mTORC1/2 may prevent the ability of the PDAC cells to activate compensatory growth- and survival-promoting pathways.
Indeed, the treatment of all four PDAC models with combinations of KRAS (G12C) and mTORC1/2 inhibitors, or MEK and mTORC1/2 inhibitors, resulted in sustained suppression of both signaling pathways in vitro. In addition, the combinations, in contrast to the single agents alone, induced robust cell death in addition to growth suppression.
In addition, in vivo tumor growth experiments dramatically illustrated that combinatorial inhibition of KRAS (G12C) and mTORC1/2 or MEK and mTORC1/2 is a powerful means of inhibiting PDAC tumor growth, because the combinations induced sustained (up to 35–45 days post-treatment) suppression of tumor growth, including regressions, compared to single-agent treatments. The combinations also prolonged the survival of mice such that 100% of the mice were alive in the combination-treated groups compared to 0% in single-agent-treated mice at the study endpoints. Significantly, the mice tolerated the combination treatments well with very little effect on body weight, and necropsies at endpoints did not show any gross tissue toxicities.
Collectively, these data demonstrate that treatment of PDAC tumors with a combination of inhibitors of RAS/MEK and mTORC1/2 results in sustained and durable inhibition of PDAC tumor growth and overcomes acquired resistance to the single agents. Furthermore, the data provide a rational approach for the treatment of PDAC with a combination of inhibitors of MEK and mTORC1/2, even if mutation-specific KRAS inhibitors are not available.35
PI3K has been shown to be a convergent target in various contexts, and mitogen-activated protein kinase (MAPK) pathway dependence on PI3K has been demonstrated previously.34,36,37 Furthermore, PI3K and MEK inhibitor combination studies have shown success in vitro and in murine models but have largely failed in human trials due to overwhelming patient toxicity.38, 39, 40 Here, we have focused on inhibiting mTORC1/2 in conjunction with MEK inhibition, and this combination, in the context of PDAC, appears to be both durable and less toxic compared to combinations of PI3K and MEK inhibitors. To our knowledge, the specific combination approach described here has not been evaluated in depth in PDAC models and provides a targeted therapeutic approach for the prevention of resistance and treatment of PDAC. Because PDAC cells of different molecular subtypes often exhibit variable sensitivity to MEK inhibition or KRAS depletion,37,41 future evaluation of the efficacy of combination therapy using inhibitors of MEK and mTORC1/2 on subtype-specific PDAC tumors, for example, progenitor versus squamous type PDAC, will be of particular interest. Importantly, the data presented here show that the combination works across tumors with different KRAS mutations and utilizes agents that are available in the clinical setting, allowing for rapid translation of these findings toward potential therapeutic options for patients with PDAC and warranting further clinical investigation.
Limitations of Study
The presence of off-target, dose-limiting cytotoxicity remains a challenge with inhibitors of mTOR, including the dual mTORC1/2 inhibitors,42,43 and this issue is potentially compounded in the presence of combination therapy. Although we addressed the potential toxicity of the combination of KRAS or MEK inhibitors with inhibitors of mTORC1/2 in our study by monitoring several parameters, including body weights, necropsies, and analysis of liver sections from control and treated animals by a board-certified pathologist, it is nonetheless possible that, in humans, combination therapy may result in additional treatment-related toxicity relative to monotherapy. Although the dose of Torin 1 used in our studies was maintained close to the maximum tolerated dose in mice, the concentration of trametinib and AMG 510 used in the combination study arms was low relative to previous studies,7,14 demonstrating the importance of selecting appropriate doses of individual therapies when using combinations to ensure efficacy while limiting off-target cytotoxicity. Additionally, the potential for tumor recurrence if treatment is discontinued or if resistance to the combination develops remains unresolved in this study. We did observe that the tumors recurring after treatment with trametinib alone or in combination with Torin 1 exhibited extensive regions of hypoxia marked by upregulation of expression of CAIX, suggesting that sustained levels of hypoxia may play a role in the development of resistance and tumor recurrence, even with the dual inhibitor combination. In this context, it will be interesting to determine whether the addition of a clinically validated, non-toxic selective inhibitor of CAIX, such as SLC-0111,44 to the combination of inhibition of MEK and mTORC1/2 will further reduce tumor growth and function to mitigate effects of hypoxia on potential tumor recurrence to extend survival for patients with PDAC.
STAR★Methods
Key Resources Table
| REAGENT or RESOURCE | SOURCE | IDENTIFIER |
|---|---|---|
| Antibodies | ||
| RAS (D2C1) Rabbit mAb | Cell Signaling Technology | Cat#8955; RRID: AB_2797685 |
| phospho-p44/42 ERK1/2 (Thr202/Tyr204) | Cell Signaling Technology | Cat#9101; RRID: AB_331646 |
| p44/42 MAPK (ERK1/2) (137F5) rabbit mAb | Cell Signaling Technology | Cat#4695; RRID: AB_390779 |
| phospho-Akt (Ser473) (D9E) XP rabbit mAb | Cell Signaling Technology | Cat#4060; RRID: AB_2224726 |
| Akt (pan) (C67E7) rabbit mAb | Cell Signaling Technology | Cat#4691; RRID: AB_915783 |
| phospho-Rictor (Thr1135) (D30A3) rabbit mAb | Cell Signaling Technology | Cat#3806; RRID: AB_10557237 |
| Rictor (D16H9) rabbit mAb | Cell Signaling Technology | Cat#9476; RRID: AB_10612959 |
| Rictor (53A2) rabbit mAb | Cell Signaling Technology | Cat#2114; RRID: AB_2179963 |
| phospho-P70 S6 Kinase | Cell Signaling Technology | Cat#9205; RRID: AB_330944 |
| P70 S6 Kinase Ab | Cell Signaling Technology | Cat#9202; RRID: AB_331676 |
| phospho-4E-BP1 (Thr37/46) Ab | Cell Signaling Technology | Cat#9459S; RRID: AB_330985 |
| 4E-BP1 Ab | Cell Signaling Technology | Cat#9452; RRID: AB_331692 |
| phospho-FoxO1(Thr24)/FoxO3a (Thr32) Ab | Cell Signaling Technology | Cat#9464; RRID: AB_329842 |
| cleaved caspase-3 (Asp175) (5A1E) rabbit mAb | Cell Signaling Technology | Cat#9664; RRID: AB_2070042 |
| phospho-MNK1 (Thr197/202) Ab | Cell Signaling Technology | Cat#2111; RRID: AB_2266303 |
| Mnk1(C4C1) | Cell Signaling Technology | Cat#2195; RRID: AB_2235175 |
| phospho-eIF4E (Ser209) | Cell Signaling Technology | Cat#9741; RRID: AB_331677 |
| eIF4E | Cell Signaling Technology | Cat#9742; RRID: AB_823488 |
| phospho-histone H3 (Ser10) | Cell Signaling Technology | Cat#3377; RRID: AB_1549592 |
| ILK1 (4G9) rabbit mAb | Cell Signaling Technology | Cat#3856; RRID: AB_2233861 |
| Kras mAb F234 | Santa Cruz Biotechnology | Cat# sc-30; RRID: AB_627865 |
| mouse anti ILK, Clone 3/ILK (RUO) | BD BioSciences | Cat#611802; RRID: AB_399282 |
| Vinculin | Millipore | Cat# MAB3574; RRID: AB_2304338 |
| anti-BrdU | Roche | Cat# BMC9318; RRID: AB_2313622 |
| Horseradish peroxidise (HRP)-conjugated anti-mouse secondary Ab | Cell Signaling Technology | Cat#7076; RRID: AB_330924 |
| HRP-conjugated anti-rabbit secondary Ab | Jackson ImmunoResearch | Cat#111-035-003; RRID: AB_2315367 |
| monoclonal anti-Rictor (H-11) antibody agarose conjugate AC | Santa Cruz Biotechnology | Cat#271081AC; RRID: AB_10611167 |
| mouse IgG2b negative control | Millipore | Cat# MABC006; RRID: AB_97848 |
| anti-human CAIX M75 mAb | Bioscience | Cat# AB1001 |
| normal mouse IgG-agarose conjugate (AC) | Santa Cruz Biotechnology | Cat# sc-2343; RRID: AB_737178 |
| Protein A/G plus agarose | Santa Cruz Biotechnology | Cat# sc-2003; RRID: AB_10201400 |
| anti-pimonidazole Hypoxyprobe Kit | Hypoxyprobe | Cat#HP1-100; RRID: AB_2811309 |
| ImmPRESS species specific HRP secondary | Vector Laboratories | Cat# MP-7405; RRID: AB_2336526 |
| ImmPRESS species specific HRP secondary | Vector Laboratories | Cat# MP-7500; RRID: AB_2336534 |
| Chemicals, Peptides, and Recombinant Proteins | ||
| Pimonidazole | Hypoxyprobe | HP-200; CAS: 70132-50-2 |
| 5′-Bromo-2′-deoxyuridine | Sigma Aldrich | B5002; CAS: 59-14-3 |
| Trametinib (GSK1120212) MEK inhibitor | Selleck Chemicals | S2673; CAS: 871700-17-3 |
| Torin-1 mTORC1/2 inhibitor | Selleck Chemicals | S2827; CAS: 1222998-36-8 |
| Vistuseritib (AZD2014) mTOR inhibitor | Selleck Chemicals | S2783; CAS: 1009298-59-2 |
| Selumetinib (AZD6244) MEK inhibitor | Selleck Chemicals | S1008; CAS: 606143-52-6 |
| AMG-510 KRAS G12C inhibitor | Medchem Express | Hy-114277; CAS: 2296729-00-3 |
| QLT-0267 ILK inhibitor | Quadralogic Technologies, Inc; gift | N/A |
| Doxycycline hyclate | Sigma Aldrich | D9891 ; CAS: 24390-14-5 |
| XenoLight D-Luciferin, Potassium Salt | Perkin Elmer Inc. | 122799; CAS: 115144-35-9 |
| (Hydroxypropyl) methyl cellulose (Hypromellose) | Sigma Aldrich | H3785; CAS:9004-65-3 |
| N-methyl-2-pyrrolidone | Sigma Aldrich | 328634; CAS: 872-50-4 |
| Tomivosertib (eFT-508) MNK1/2 inhibitor | Selleck Chemicals | S8275; CAS: 1849590-01-7 |
| Critical Commercial Assays | ||
| DAB peroxidase HRP Substrate | Vector Laboratories | Cat# SK-4100 |
| Supersignal West Femto chemiluminescence reagent | Life Technologies | Cat# 34095 |
| Nuclight rapid red | Essen Bioscience | Cat# 4717 |
| HCS Nuclear Mask Red Stain | ThermoFisher | Cat# H10326 |
| Sytox Green nucleic acid stain | Thermofisher | Cat# S7020 |
| Doxycycline Diet (625 Dox, R) | Envigo | Cat# TD.130141 |
| LookOut Mycoplasma PCR detection kit | Sigma Aldrich | Cat# MP0035 |
| Experimental Models: Cell Lines | ||
| Human: PK-8 pancreatic cancer cells | Laboratory of Sylvia Ng | N/A |
| Human: MIA PaCa-2 pancreatic cancer cells | ATCC | Cat # CRL-1420; RRID: CVCL_0428 |
| Mouse: KPCY PENN 6620c1 pancreatic cancer cells | Laboratory of Ben Stanger | RRID: CVCL_YM30 |
| Human: PaCa-41 patient derived xenograft | Laboratory of Daniel Renouf | N/A |
| Experimental Models: Organisms/Strains | ||
| mouse: NOD/SCID IL2Rγ−/− (NSG) | “in-house” breeding from Jackson Laboratories | Cat# JAX:005557; RRID: IMSR_JAX:005557 |
| mouse: C57BL/6J | Jackson Laboratories | Cat# JAX000664; RRID: IMSR_JAX:000664 |
| Oligonucleotides | ||
| siRNA targeting sequence: Hs_ILK_4: AAGGAAGAGC AGGGACTTCAA |
QIAGEN | Cat# GS3611; SI00288176 |
| siRNA targeting sequence: Hs_ILK_5: TAGCCGTAGT GTAATGATTGA |
QIAGEN | Cat# GS3611; SI00288183 |
| shRNA targeting sequence: KRAS; V3THS_314004: Mature Antisense: TTATTTCCTACTAGGACCA | Dharmacon | Cat#275818; RHS4696-200764328 |
| Non-silencing control shRNA sequence: 22-mer antisense: CTTACTCTCGCCCAAGCGAGAG | Dharmacon | Cat# RHS4743 |
| ON-TARGETplus SMARTpool siRNA J-016984-05, RICTOR: GACACAAGCACUUCGAUUA | Dharmacon | Cat# L-016984-00-0020 |
| ON-TARGETplus SMARTpool siRNA J-016984-06, RICTOR: GAAGAUUUAUUGAGUCCUA | Dharmacon | Cat# L-016984-00-0020 |
| ON-TARGETplus SMARTpool siRNA J-016984-07, RICTOR: GCGAGCUGAUGUAGAAUUA | Dharmacon | Cat# L-016984-00-0020 |
| ON-TARGETplus SMARTpool siRNA J-016984-08, RICTOR: GGGAAUACAACUCCAAAUA | Dharmacon | Cat# L-016984-00-0020 |
| Recombinant DNA | ||
| pTRIPZ Tet-On lentiviral vector plasmids - Puromycin | Dharmacon | Cat# RHS4741-EG3845 |
| pLenti-CMV Firefly Luciferase - Blasticidin | Brown et al.49 | N/A |
| Software and Algorithms | ||
| Compusyn software version 1 | Combosyn Incorporated | http://www.combosyn.com |
| ImageJ version 1.48 | National Institutes of Health | https://imagej.nih.gov/ij/ |
| GraphPad Prism | GraphPad Software | https://www.graphpad.com:443/ |
| TumGrowth software | Kromerlab | https://kroemerlab.shinyapps.io/TumGrowth/ |
| Microsoft Excel | Microsoft Corp | https://www.microsoft.com/en-us/ |
| Image Lab 5.2.1 | Bio-Rad laboratories Inc. | https://www.bio-rad.com/en-ca/product/image-lab-software?ID=KRE6P5E8Z |
| Incucyte ZOOM 2018A | Essen BioScience | https://www.essenbioscience.com/en/products/software/ |
| Living Image Software (IVIS imaging) | Perkin Elmer Inc. | https://www.perkinelmer.com/product/li-software-for-spectrum-1-seat-add-on-128113 |
Resource Availability
Lead Contact
Further information and requests for resources and reagents should be directed to and will be fulfilled by the Lead Contact, Shoukat Dedhar (sdedhar@bccrc.ca).
Materials Availability
All requests for resources and reagents should be directed to and will be fulfilled by the Lead Contact author. This includes antibodies and shRNA engineered cell lines. Genetically engineered cells lines, the PaCa41 PDX cell line and QLT-0267 will be made available on request after completion of a Materials Transfer Agreement.
Data and Code Availability
The authors declare that all data supporting the findings of this study are available within the paper.
Experimental Model and Subject Details
Cells
Human pancreatic cancer cell lines (PK-8, MIA PaCa-2) were obtained from Don Yapp and Sylvia Ng (BC Cancer Research Centre, Vancouver, Canada) and cultured as previously described.20,45 Cell lines were maintained in Dulbecco’s modified Eagle’s medium (DMEM; Life Technologies) (MIA PaCa-2) or Roswell Park Memorial Institute 1640 (RPMI 1640; Life Technologies) (PK-8) supplemented with 10% fetal bovine serum (FBS; Life Technologies). The congenic PDAC tumor cell clone PENN6620c1 was established in culture from the C57BL/6 KPCY genetically modified mouse model, was provided by Ben Stanger (University of Pennsylvania, Philadelphia, USA) and was cultured as previously described.19 The PENN6620c1 clone was maintained in DMEM supplemented with 10% FBS. The PaCa41 human patient derived xenograft (PDX) cell line PaCa41 was established from a patient tissue fragment and was provided by Daniel Renouf (BC Cancer). PaCa41 cells were maintained in DME/F-12 medium supplemented with 0.25 mg/mL bovine serum albumin (BSA) and 5 mg/ml glucose (Fisher Scientific), 1x insulin-transferrin-selenium (ITS) and 25 μg/mL bovine pituitary extract (BPE; Life Technologies), 40 ng/mL epidermal growth factor (EGF; Sigma Aldrich), 5 nM 3,3,5-tri-iodo-L-thyronine and 1 μg/mL dexamethasone (Sigma Aldrich), 100 ng/mL cholera toxin, (Molecular Probes, ThermoFisher), 1.22 mg/mL nicotinamide (Sigma Aldrich), 5% Nu-serum IV culture supplement (Corning), 100 U/mL penicillin, 100 μg/ml streptomycin and 500 μg/mL amphotericin B (Life Technologies). All cells were grown at 37°C in a humidified atmosphere containing 5% carbon dioxide (CO2) and were tested for mycoplasma contamination using the LookOut Mycoplasma PCR detection kit (Sigma; cat no. MP0035). The human cell lines were authenticated using short tandem repeat STR DNA profiling by a commercial testing facility (Genetica, Burlington, NC, USA). The KPCY clones have been authenticated as described.19 The PaCa41 cell line was authenticated by the source laboratory. Inhibitors (Selleck Chemicals) used in cell culture include trametinib (10 nM or 0.01 to 100 nM as indicated), Torin 1 1(500 nM or 10 to 1000 nM as indicated), vistuseritib/ AZD2014 (500 nM), and selumetinib/AZD6244 (1 μM). AMG 510, a selective KRAS G12C inhibitor (Medchem Express, cat no. Hy-114277) was used as indicated. QLT-0267, an inhibitor of ILK activity, was obtained from Quadralogic Technologies Inc (QLT) and used at the concentrations indicated in the figure. siRNA for ILK (QIAGEN, cat no GS3611 Flexitube Gene Solution) and siRNA for Rictor (Dharmacon ON-TARGETplus 20nM pool, cat no. L-016984-00-0020) were used according to manufacturers recommendations.
Animal studies
All experimental animal procedures were carried out at the BC Cancer Animal Resource Centre (ARC) in accordance with protocol A17-0291 approved by the institutional Animal Care Committee (ACC) at the University of British Columbia, Vancouver. The studies are compliant with all relevant ethical regulations regarding animal research. All mice were housed in ventilated cages in a pathogen-free, environment-controlled room at 19-21°C. The relative humidity ranged between 40% and 70% and a photoperiod of 12 hours light and 12 hours darkness was provided. Food and water were provided ad libitum. For human cell-line derived xenografts, PK-8 or MiaPaCa2 cells (5.0x10⁶cells/animal, suspended in 50 μL sterile PBS) were injected subcutaneously on the back of 8-12 week old female NOD/SCID IL2Rγ−/− (NSG) mice obtained through an “in-house” breeding program using breeders from Jackson Laboratories. For studies using the KPCY PENN 6620c1 clone,19 7 week old female C57BL/6 mice were purchased from Jackson Laboratories and were allowed to acclimatize for 1 week. KPCY PENN 6620c1 cells (1.0x10⁵ cells/animal, suspended in 50 μL sterile PBS) were injected subcutaneously on the back of the mice and tumors were allowed to establish. All tumors were measured using digital calipers and tumor volumes were calculated as previously described46,47 using the modified ellipsoidal formula of volume = 0.5(lengthxwidth2). When tumors reached approximately 80 mm3 (KPCY PENN 6620c1 model) to 150 mm3 (PK-8 and MIA PaCa-2 models) mice were sorted into groups of similar average tumor volume and drug administration was initiated. For tumor models expressing doxycycline-inducible shRNA, mice were provided with food pellets supplemented with 625 mg/kg doxycycline (Envigo cat no. TD130141) ad libitum beginning when tumors reached approximately 100 mm3 and for the duration of the study. All pharmacologic agents were administered daily by oral gavage. The doses used and the duration of dosing are indicated in the figures. Trametinib was formulated in 0.5% hydroxypropyl methyl cellulose (Sigma-Aldrich) and 0.1% Tween-80 (Sigma-Aldrich). Torin 1 was formulated in 40% N-methyl-2-pyrrolidone (Sigma-Aldrich), 40% PEG-400, 20% sterile PBS for administration. AMG 510 (30 mg/kg) was formulated in 40% PEG-300, 10% DMSO, 1% Tween-80, 49% sterile saline for administration. Vehicle controls were administered equivalent volumes of relevant vehicles. Animals administered single agents were administered the vehicle for the second agent. For survival analyses, a surrogate threshold was used and survival events occurred once tumors reached approximately 500 mm3.
Pimonidazole (60mg/mL, cat no HP-200, Hypoxyprobe) and 5′-Bromo-2′-deoxyuridine (BrdU, 3 mg/mL, cat no. B5002, Sigma) were injected at 200uL per 20 g of mouse body weight for 2 hours and 1 hour prior to euthanasia, respectively. Tumors were harvested and fixed in formalin and embedded in paraffin for immunohistochemistry (IHC) or were snap-frozen for subsequent extraction of protein for utilization in downstream analyses. For assessment of drug toxicity, body weights were measured daily during the treatment phase of the study. A daily clinical observation and health monitoring record was maintained for each individual animal throughout the study. The investigators were not blinded to the identity of the study groups and the number of animals per group was chosen based on data from previous studies.46,47
Method Details
Generation of cell lines expressing shRNA
PK-8 cells expressing shRNA against KRAS have been described previously.20 Briefly, PK-8 cells were transduced with lentivirus expressing doxycycline (DOX)-inducible shRNA against the KRAS gene as previously described. pTRIPZ plasmids for human KRAS (RHS4743; shNS, 275818; shKRAS1) were from Dharmacon (Boston, MA, USA). Doxycycline (Sigma Aldrich) was used at 1 ug/mL to induce shRNA in cultured cells.
Immunoblotting
Samples were lysed in RIPA buffer (50 mM Tris-HCl, pH 7.6, 150 mM NaCl, 0.1% (w/v) SDS, 0.5% NaDOC) containing 1 mM Na3VO4, 2 mM NaF and cOmplete protease inhibitor (Sigma) and analyzed by 4%–12% gradient SDS-PAGE as previously described.46,48 Briefly, methanol fixed PVDF Membranes were incubated with primary antibodies in 2% BSA in TBST overnight at 4°C washed with TBST for 3x10min and then incubated with HRP-conjugated secondary in 5% skim milk in TBST for 1 hour at room temperature. After extensive washing with TBST, detection was performed by incubation with Supersignal West Femto chemiluminescence reagents (Life Technologies) and visualization using a Chemidoc XRS+ imaging system (Bio-Rad Laboratories). In instances where blots were probed for multiple proteins using the same membrane, but where individual proteins were displayed in more than one figure, the same vinculin blot used as the loading control has been displayed in both figures.
Antibodies
The following antibodies (Cell Signaling Technology, Danvers, MA, USA) were used at a dilution of 1:1,000 for western blotting unless otherwise indicated. Total RAS (D2C1, cat no.8955), phospho-p44/42 ERK1/2 (Thr202/Tyr204) cat no.4695, p44/42 ERK1/2 cat no.4695, phospho-AKT (Ser473) cat no.4060, AKT cat no.4691, phospho-Rictor (Thr1135) cat no.3806, Rictor cat no.9476 or 2114, phospho-P70 S6 Kinase (Thr389) cat no.9205, P70 S6 Kinase cat no.9202, phospho-4E-BP1 (Thr37/46) cat no.9459, 4E-BP1 cat no.9452, phospho-FOXO1(Thr24)/FOXO3a (Thr32) cat no.9464, cleaved caspase-3 (Asp175) cat no.9664, phospho-MNK1 (Thr197/202) cat no.2111, Mnk1(C4C1) cat no.2195, phospho-eIF4E (Ser209) cat no.9741, eIF4E cat no.9742, and phospho-histone H3 (Ser10) cat no.3377. An antibody specific to Kras (F234, Santa Cruz Biotechnology) was used at 1:1,000. Purified mouse anti ILK, Clone 3/ILK (RUO) (cat no. 611802, BD BioSciences) was used at 1:500. ILK1 (4G9) rabbit antibody (cat no.3586, Cell Signaling) was used at 1:1,000 for blotting co-immuoprecipitated samples. Loading control was Vinculin (1:2,000, cat no MAB3574, Millipore). Horseradish peroxidise (HRP)-conjugated anti-mouse (1:5,000, cat no.7076, Cell Signaling) and HRP-conjugated anti-rabbit (1:5,000, cat no.111-035-003, Jackson ImmunoResearch) were used as secondary antibodies for ECL detection.
Co-immunoprecipitation
MiaPaCa2 were cultured for 72 hours in the presence or absence of 10nM trametinib and then lysed on ice using a buffer containing 0.3% CHAPS, 120mM NaCl, 40mM HEPES pH 7.5, 1mM EDTA containing cOmplete protease inhibitor cocktail (Sigma), 0.5 mM Na3VO4, 2 mM NaF, 10mM pyrophosphate and 10mM β-glycerophosphate. Protein concentrations were determined using the BCA assay (ThermoFisher). 2 mg of total protein in 3 mL volume was precleared with 20uL of normal mouse IgG-agarose conjugate (AC) (cat no. sc-2343, Santa Cruz Biotechnology) for one hour at 4°C. Cleared lysates were immunoprecipitated at 4°C overnight using either 10 μg of monoclonal anti-Rictor (H-11) antibody agarose conjugate AC (Santa Cruz Biotechnology, cat no. 271081AC) or an isotype specific control mouse IgG2b negative control (cat no. MABC006, Millipore). 20uL of Protein A/G plus agarose (cat no. sc-2003, Santa Cruz) was added to control IP reactions for one hour at 4°C. The pellet was washed with 4 times with 1 mL CHAPS buffer with 1% Tween-20, resuspended in 20uL 2x non reducing sample buffer and boiled at 100°C for 5 minutes. β-mercaptoethanol was added to the supernatant and samples were boiled again and then loaded on 4%–12% gradient SDS-PAGE gels. Western blots were performed on methanol fixed PVDF membranes as described above.
Cell proliferation
For cell proliferation assays, PK-8 cells were resuspended in media containing a red nuclear stain, IncuCyte Nuclight rapid red (Essen Bioscience by Sartorius, 1:1,000), plated in 96-well plates at a concentration of 6x10³ cells/well in a 100 μL volume and incubated overnight at 37°C to allow attachment. Plates were placed in the IncuCyte ZOOM live cell analysis system (Essen BioScience by Sartorius) and images were captured every 4 hours using a 10X objective. Alternatively, for cell lines in which labeling with live nuclear dyes were not feasible due to lack of uptake of the dye by the cells, percentage confluence was monitored. An endpoint dye, HCS Nuclear Mask Red Stain (1:1,000, ThermoFisher) was also used to enumerate total cell number.
Cytotoxicity assay
PK-8 cells were resuspended in media containing IncuCyte Nuclight rapid red, plated in 96-well plates at a concentration of 6x10³ cells/well in a 100 μL volume and incubated overnight at 37°C to allow attachment. A volume of 50 μL/well of media containing 3X (750 nM) Sytox Green nucleic acid stain (Thermofisher) was then added and plates were placed in the IncuCyte® ZOOM live cell analysis system. The number of Sytox Green-positive cells/mm2 (dead cells) and the number of Nuclight rapid red cells/mm2 (total cells) were determined and were used to calculate the percentage of cytotoxic cell death. Combination indices were calculated using Compusyn software version 1 (Combosyn, Inc).
Bioluminescence Imaging and Ex-vivo Subculture
PK-8 cells were transduced via lentivirus to stably express Firefly Luciferase and selected with blasticidin (kind gift of Dr Michael Wendt, Purdue University, IN, USA), as previously described.49 To measure tumor burden by bioluminescent imaging (BLI), mice were administered D-Luciferin (Perkin-Elmer) at 150 mg/kg by intraperitoneal injection and imaged using a Xenogen IVIS Lumina system as previously described.20 Upon necropsy at study end point, primary tumors were surgically excised for formalin-fixation and metastasis was subsequently quantified by BLI. Primary metastatic tissue was then excised, disassociated, plated under tissue culture conditions, and maintained in RPMI 1640 supplemented with 10% FBS and 1 % (v/v) penicillin/streptomycin.
Immunohistochemistry
IHC on formalin-fixed, paraffin-embedded tissue was performed as previously described.20,50 Five-micron tissue sections were cut and transferred onto Superfrost-Plus slides (Fisher Scientific). Tissue sections were deparaffinized, rehydrated and antigen retrieval was performed by microwaving in 10 mM citrate buffer, pH 6.0 for 10 minutes. Sections were incubated with 3% H2O2 for 15 minutes to quench endogenous peroxidase activity. Tissue sections were incubated with primary antibody (diluted in 3% skim milk, 1% BSA in PBS) against human CAIX (1:200, M75, Bioscience), BrdU (1:10, Roche), cleaved caspase 3 (Asp175) 5A1E (1:100, Cell Signaling), or pimonidazole (1:500) for overnight at 4°C. ImmPRESS species specific HRP secondary (MP-7405, MP-7500) and DAB peroxidase HRP Substrate (SK-4100) were used according to the manufacturer’s instructions (Vector Laboratories). Tissues were counterstained with hematoxylin (Leica Biosystems). For quantification, at least 5 randomly selected fields of view (FOV) at 20x magnification were imaged from 1 section/tumor and 5-6 tumors were analyzed/group. The number of positive cells in each image was counted or the percent area of positive staining was quantified using ImageJ (v1.48, National Institutes of Health, USA).
Quantification and Statistical Analysis
Statistical significance between two groups was assessed by unpaired Student’s t test. One way analysis of variance (ANOVA) was used to analyze more than two groups. Two-way ANOVA was used to analyze quantification of IHC. Survival was analyzed using a (two-sided) log rank test. Analysis of tumor growth curves was done using TumGrowth software (https://kroemerlab.shinyapps.io/TumGrowth/).51 GraphPad Prism 7 and 8 software were used for all other statistical analyses. All cell culture experiments were performed at least two times. Data are presented as mean ± s.e.m. and P values less than 0.05 were considered statistically significant. Further statistical details, including values of n and definitions of what n represents, can be found in the figure legends.
Acknowledgments
This work was supported by grants to S.D. from the Canadian Cancer Society Research Institute (CCSRI) (grant no. 703191) and the Canadian Institutes of Health Research (CIHR) (grant no. FDN-143318) and funding from Pancreas Centre BC, BC Cancer Foundation, and VGH Foundation.
Author Contributions
Conception and Design, W.S.B., P.C.M., and S.D.; Development of Methodology, W.S.B., P.C.M., S.C.C., and S.D.; Acquisition of Data (Provided Technical Assistance, Provided Animals, Acquired and Managed Patient Data, Provided Facilities, etc.), W.S.B., O.N., S.A., S.C.C., D.F.S., J.L., D.J.R., B.Z.S., and S.D.; Administrative, Technical, or Material Support (i.e., Reporting or Organizing Data and Constructing Databases), W.S.B., P.C.M., O.N., and S.A.; Analysis and Interpretation of Data (e.g., Statistical Analysis, Biostatistics, and Computational Analysis), W.S.B., P.C.M., and S.D.; Writing, Review, and/or Revision of the Manuscript, W.S.B., P.C.M., B.Z.S., and S.D.; Study Supervision, W.S.B., P.C.M., and S.D.
Declaration of Interests
The authors declare no competing interests.
Published: November 17, 2020
Footnotes
Supplemental Information can be found online at https://doi.org/10.1016/j.xcrm.2020.100131.
Supplemental Information
References
- 1.Siegel R.L., Miller K.D., Jemal A. Cancer statistics, 2019. CA Cancer J. Clin. 2019;69:7–34. doi: 10.3322/caac.21551. [DOI] [PubMed] [Google Scholar]
- 2.Kleeff J., Korc M., Apte M., La Vecchia C., Johnson C.D., Biankin A.V., Neale R.E., Tempero M., Tuveson D.A., Hruban R.H., Neoptolemos J.P. Pancreatic cancer. Nat. Rev. Dis. Primers. 2016;2:16022. doi: 10.1038/nrdp.2016.22. [DOI] [PubMed] [Google Scholar]
- 3.Ducreux M., Seufferlein T., Van Laethem J.-L., Laurent-Puig P., Smolenschi C., Malka D., Boige V., Hollebecque A., Conroy T. Systemic treatment of pancreatic cancer revisited. Semin. Oncol. 2019;46:28–38. doi: 10.1053/j.seminoncol.2018.12.003. [DOI] [PubMed] [Google Scholar]
- 4.Cancer Genome Atlas Research Network Integrated genomic characterization of pancreatic ductal adenocarcinoma. Cancer Cell. 2017;32:185–203.e13. doi: 10.1016/j.ccell.2017.07.007. [DOI] [PMC free article] [PubMed] [Google Scholar]
- 5.Waters A.M., Der C.J. KRAS: the critical driver and therapeutic target for pancreatic cancer. Cold Spring Harb. Perspect. Med. 2018;8:a031435. doi: 10.1101/cshperspect.a031435. [DOI] [PMC free article] [PubMed] [Google Scholar]
- 6.Ying H., Dey P., Yao W., Kimmelman A.C., Draetta G.F., Maitra A., DePinho R.A. Genetics and biology of pancreatic ductal adenocarcinoma. Genes Dev. 2016;30:355–385. doi: 10.1101/gad.275776.115. [DOI] [PMC free article] [PubMed] [Google Scholar]
- 7.Canon J., Rex K., Saiki A.Y., Mohr C., Cooke K., Bagal D., Gaida K., Holt T., Knutson C.G., Koppada N. The clinical KRAS(G12C) inhibitor AMG 510 drives anti-tumour immunity. Nature. 2019;575:217–223. doi: 10.1038/s41586-019-1694-1. [DOI] [PubMed] [Google Scholar]
- 8.Hallin J., Engstrom L.D., Hargis L., Calinisan A., Aranda R., Briere D.M., Sudhakar N., Bowcut V., Baer B.R., Ballard J.A. The KRASG12C inhibitor MRTX849 provides insight toward therapeutic susceptibility of KRAS-mutant cancers in mouse models and patients. Cancer Discov. 2020;10:54–71. doi: 10.1158/2159-8290.CD-19-1167. [DOI] [PMC free article] [PubMed] [Google Scholar]
- 9.Xue J.Y., Zhao Y., Aronowitz J., Mai T.T., Vides A., Qeriqi B., Kim D., Li C., de Stanchina E., Mazutis L. Rapid non-uniform adaptation to conformation-specific KRAS(G12C) inhibition. Nature. 2020;577:421–425. doi: 10.1038/s41586-019-1884-x. [DOI] [PMC free article] [PubMed] [Google Scholar]
- 10.Brauswetter D., Gurbi B., Varga A., Várkondi E., Schwab R., Bánhegyi G., Fábián O., Kéri G., Vályi-Nagy I., Peták I. Molecular subtype specific efficacy of MEK inhibitors in pancreatic cancers. PLoS ONE. 2017;12:e0185687. doi: 10.1371/journal.pone.0185687. [DOI] [PMC free article] [PubMed] [Google Scholar]
- 11.Pettazzoni P., Viale A., Shah P., Carugo A., Ying H., Wang H., Genovese G., Seth S., Minelli R., Green T. Genetic events that limit the efficacy of MEK and RTK inhibitor therapies in a mouse model of KRAS-driven pancreatic cancer. Cancer Res. 2015;75:1091–1101. doi: 10.1158/0008-5472.CAN-14-1854. [DOI] [PMC free article] [PubMed] [Google Scholar]
- 12.Infante J.R., Somer B.G., Park J.O., Li C.-P., Scheulen M.E., Kasubhai S.M., Oh D.-Y., Liu Y., Redhu S., Steplewski K., Le N. A randomised, double-blind, placebo-controlled trial of trametinib, an oral MEK inhibitor, in combination with gemcitabine for patients with untreated metastatic adenocarcinoma of the pancreas. Eur. J. Cancer. 2014;50:2072–2081. doi: 10.1016/j.ejca.2014.04.024. [DOI] [PubMed] [Google Scholar]
- 13.Ruess D.A., Heynen G.J., Ciecielski K.J., Ai J., Berninger A., Kabacaoglu D., Görgülü K., Dantes Z., Wörmann S.M., Diakopoulos K.N. Mutant KRAS-driven cancers depend on PTPN11/SHP2 phosphatase. Nat. Med. 2018;24:954–960. doi: 10.1038/s41591-018-0024-8. [DOI] [PubMed] [Google Scholar]
- 14.Fedele C., Ran H., Diskin B., Wei W., Jen J., Geer M.J., Araki K., Ozerdem U., Simeone D.M., Miller G. SHP2 inhibition prevents adaptive resistance to MEK inhibitors in multiple cancer models. Cancer Discov. 2018;8:1237–1249. doi: 10.1158/2159-8290.CD-18-0444. [DOI] [PMC free article] [PubMed] [Google Scholar]
- 15.Bryant K.L., Stalnecker C.A., Zeitouni D., Klomp J.E., Peng S., Tikunov A.P., Gunda V., Pierobon M., Waters A.M., George S.D. Combination of ERK and autophagy inhibition as a treatment approach for pancreatic cancer. Nat. Med. 2019;25:628–640. doi: 10.1038/s41591-019-0368-8. [DOI] [PMC free article] [PubMed] [Google Scholar]
- 16.Sun C., Yamato T., Furukawa T., Ohnishi Y., Kijima H., Horii A. Characterization of the mutations of the K-ras, p53, p16, and SMAD4 genes in 15 human pancreatic cancer cell lines. Oncol. Rep. 2001;8:89–92. doi: 10.3892/or.8.1.89. [DOI] [PubMed] [Google Scholar]
- 17.Ryan M.B., Fece de la Cruz F., Phat S., Myers D.T., Wong E., Shahzade H.A., Hong C.B., Corcoran R.B. Vertical pathway inhibition overcomes adaptive feedback resistance to KRASG12C inhibition. Clin. Cancer Res. 2020;26:1633–1643. doi: 10.1158/1078-0432.CCR-19-3523. [DOI] [PMC free article] [PubMed] [Google Scholar]
- 18.Sarbassov D.D., Guertin D.A., Ali S.M., Sabatini D.M. Phosphorylation and regulation of Akt/PKB by the rictor-mTOR complex. Science. 2005;307:1098–1101. doi: 10.1126/science.1106148. [DOI] [PubMed] [Google Scholar]
- 19.Li J., Byrne K.T., Yan F., Yamazoe T., Chen Z., Baslan T., Richman L.P., Lin J.H., Sun Y.H., Rech A.J. Tumor cell-intrinsic factors underlie heterogeneity of immune cell infiltration and response to immunotherapy. Immunity. 2018;49:178–193.e7. doi: 10.1016/j.immuni.2018.06.006. [DOI] [PMC free article] [PubMed] [Google Scholar]
- 20.McDonald P.C., Chafe S.C., Brown W.S., Saberi S., Swayampakula M., Venkateswaran G., Nemirovsky O., Gillespie J.A., Karasinska J.M., Kalloger S.E. Regulation of pH by carbonic anhydrase 9 mediates survival of pancreatic cancer cells with activated KRAS in response to hypoxia. Gastroenterology. 2019;157:823–837. doi: 10.1053/j.gastro.2019.05.004. [DOI] [PubMed] [Google Scholar]
- 21.Wright C.J.M., McCormack P.L. Trametinib: first global approval. Drugs. 2013;73:1245–1254. doi: 10.1007/s40265-013-0096-1. [DOI] [PubMed] [Google Scholar]
- 22.Julien L.A., Carriere A., Moreau J., Roux P.P. mTORC1-activated S6K1 phosphorylates Rictor on threonine 1135 and regulates mTORC2 signaling. Mol. Cell. Biol. 2010;30:908–921. doi: 10.1128/MCB.00601-09. [DOI] [PMC free article] [PubMed] [Google Scholar]
- 23.Serrano I., McDonald P.C., Lock F.E., Dedhar S. Role of the integrin-linked kinase (ILK)/Rictor complex in TGFβ-1-induced epithelial-mesenchymal transition (EMT) Oncogene. 2013;32:50–60. doi: 10.1038/onc.2012.30. [DOI] [PubMed] [Google Scholar]
- 24.Troussard A.A., McDonald P.C., Wederell E.D., Mawji N.M., Filipenko N.R., Gelmon K.A., Kucab J.E., Dunn S.E., Emerman J.T., Bally M.B., Dedhar S. Preferential dependence of breast cancer cells versus normal cells on integrin-linked kinase for protein kinase B/Akt activation and cell survival. Cancer Res. 2006;66:393–403. doi: 10.1158/0008-5472.CAN-05-2304. [DOI] [PubMed] [Google Scholar]
- 25.Yoon S.-O., Shin S., Karreth F.A., Buel G.R., Jedrychowski M.P., Plas D.R., Dedhar S., Gygi S.P., Roux P.P., Dephoure N., Blenis J. Focal adhesion- and IGF1R-dependent survival and migratory pathways mediate tumor resistance to mTORC1/2 inhibition. Mol. Cell. 2017;67:512–527.e4. doi: 10.1016/j.molcel.2017.06.033. [DOI] [PMC free article] [PubMed] [Google Scholar]
- 26.Morris E.J., Assi K., Salh B., Dedhar S. Integrin-linked kinase links dynactin-1/dynactin-2 with cortical integrin receptors to orient the mitotic spindle relative to the substratum. Sci. Rep. 2015;5:8389. doi: 10.1038/srep08389. [DOI] [PMC free article] [PubMed] [Google Scholar]
- 27.McDonald P.C., Oloumi A., Mills J., Dobreva I., Maidan M., Gray V., Wederell E.D., Bally M.B., Foster L.J., Dedhar S. Rictor and integrin-linked kinase interact and regulate Akt phosphorylation and cancer cell survival. Cancer Res. 2008;68:1618–1624. doi: 10.1158/0008-5472.CAN-07-5869. [DOI] [PubMed] [Google Scholar]
- 28.Thoreen C.C., Kang S.A., Chang J.W., Liu Q., Zhang J., Gao Y., Reichling L.J., Sim T., Sabatini D.M., Gray N.S. An ATP-competitive mammalian target of rapamycin inhibitor reveals rapamycin-resistant functions of mTORC1. J. Biol. Chem. 2009;284:8023–8032. doi: 10.1074/jbc.M900301200. [DOI] [PMC free article] [PubMed] [Google Scholar]
- 29.Soares H.P., Ming M., Mellon M., Young S.H., Han L., Sinnet-Smith J., Rozengurt E. Dual PI3K/mTOR inhibitors induce rapid overactivation of the MEK/ERK pathway in human pancreatic cancer cells through suppression of mTORC2. Mol. Cancer Ther. 2015;14:1014–1023. doi: 10.1158/1535-7163.MCT-14-0669. [DOI] [PMC free article] [PubMed] [Google Scholar]
- 30.Aguirre A.J., Hahn W.C. Synthetic lethal vulnerabilities in KRAS-mutant cancers. Cold Spring Harb. Perspect. Med. 2018;8:a031518. doi: 10.1101/cshperspect.a031518. [DOI] [PMC free article] [PubMed] [Google Scholar]
- 31.Manchado E., Weissmueller S., Morris J.P., 4th, Chen C.C., Wullenkord R., Lujambio A., de Stanchina E., Poirier J.T., Gainor J.F., Corcoran R.B. A combinatorial strategy for treating KRAS-mutant lung cancer. Nature. 2016;534:647–651. doi: 10.1038/nature18600. [DOI] [PMC free article] [PubMed] [Google Scholar]
- 32.Driscoll D.R., Karim S.A., Sano M., Gay D.M., Jacob W., Yu J., Mizukami Y., Gopinathan A., Jodrell D.I., Evans T.R. mTORC2 signaling drives the development and progression of pancreatic cancer. Cancer Res. 2016;76:6911–6923. doi: 10.1158/0008-5472.CAN-16-0810. [DOI] [PMC free article] [PubMed] [Google Scholar]
- 33.Schmidt K.M., Hellerbrand C., Ruemmele P., Michalski C.W., Kong B., Kroemer A., Hackl C., Schlitt H.J., Geissler E.K., Lang S.A. Inhibition of mTORC2 component RICTOR impairs tumor growth in pancreatic cancer models. Oncotarget. 2017;8:24491–24505. doi: 10.18632/oncotarget.15524. [DOI] [PMC free article] [PubMed] [Google Scholar]
- 34.Misale S., Fatherree J.P., Cortez E., Li C., Bilton S., Timonina D., Myers D.T., Lee D., Gomez-Caraballo M., Greenberg M. KRAS G12C NSCLC models are sensitive to direct targeting of KRAS in combination with PI3K inhibition. Clin. Cancer Res. 2019;25:796–807. doi: 10.1158/1078-0432.CCR-18-0368. [DOI] [PubMed] [Google Scholar]
- 35.Drosten M., Barbacid M. Targeting the MAPK pathway in KRAS-driven tumors. Cancer Cell. 2020;37:543–550. doi: 10.1016/j.ccell.2020.03.013. [DOI] [PubMed] [Google Scholar]
- 36.Engelman J.A., Chen L., Tan X., Crosby K., Guimaraes A.R., Upadhyay R., Maira M., McNamara K., Perera S.A., Song Y. Effective use of PI3K and MEK inhibitors to treat mutant Kras G12D and PIK3CA H1047R murine lung cancers. Nat. Med. 2008;14:1351–1356. doi: 10.1038/nm.1890. [DOI] [PMC free article] [PubMed] [Google Scholar]
- 37.Muzumdar M.D., Chen P.Y., Dorans K.J., Chung K.M., Bhutkar A., Hong E., Noll E.M., Sprick M.R., Trumpp A., Jacks T. Survival of pancreatic cancer cells lacking KRAS function. Nat. Commun. 2017;8:1090. doi: 10.1038/s41467-017-00942-5. [DOI] [PMC free article] [PubMed] [Google Scholar]
- 38.Grilley-Olson J.E., Bedard P.L., Fasolo A., Cornfeld M., Cartee L., Razak A.R., Stayner L.A., Wu Y., Greenwood R., Singh R. A phase Ib dose-escalation study of the MEK inhibitor trametinib in combination with the PI3K/mTOR inhibitor GSK2126458 in patients with advanced solid tumors. Invest. New Drugs. 2016;34:740–749. doi: 10.1007/s10637-016-0377-0. [DOI] [PMC free article] [PubMed] [Google Scholar]
- 39.Weisner J., Landel I., Reintjes C., Uhlenbrock N., Trajkovic-Arsic M., Dienstbier N., Hardick J., Ladigan S., Lindemann M., Smith S. Preclinical efficacy of covalent-allosteric AKT inhibitor borussertib in combination with trametinib in KRAS-mutant pancreatic and colorectal cancer. Cancer Res. 2019;79:2367–2378. doi: 10.1158/0008-5472.CAN-18-2861. [DOI] [PubMed] [Google Scholar]
- 40.Bedard P.L., Tabernero J., Janku F., Wainberg Z.A., Paz-Ares L., Vansteenkiste J., Van Cutsem E., Pérez-García J., Stathis A., Britten C.D. A phase Ib dose-escalation study of the oral pan-PI3K inhibitor buparlisib (BKM120) in combination with the oral MEK1/2 inhibitor trametinib (GSK1120212) in patients with selected advanced solid tumors. Clin. Cancer Res. 2015;21:730–738. doi: 10.1158/1078-0432.CCR-14-1814. [DOI] [PubMed] [Google Scholar]
- 41.Ko A.H., Bekaii-Saab T., Van Ziffle J., Mirzoeva O.M., Joseph N.M., Talasaz A., Kuhn P., Tempero M.A., Collisson E.A., Kelley R.K. A multicenter, open-label phase II clinical trial of combined MEK plus EGFR inhibition for chemotherapy-refractory advanced pancreatic adenocarcinoma. Clin. Cancer Res. 2016;22:61–68. doi: 10.1158/1078-0432.CCR-15-0979. [DOI] [PMC free article] [PubMed] [Google Scholar]
- 42.Hua H., Kong Q., Zhang H., Wang J., Luo T., Jiang Y. Targeting mTOR for cancer therapy. J. Hematol. Oncol. 2019;12:71. doi: 10.1186/s13045-019-0754-1. [DOI] [PMC free article] [PubMed] [Google Scholar]
- 43.Basu B., Dean E., Puglisi M., Greystoke A., Ong M., Burke W., Cavallin M., Bigley G., Womack C., Harrington E.A. First-in-human pharmacokinetic and pharmacodynamic study of the dual m-TORC 1/2 inhibitor AZD2014. Clin. Cancer Res. 2015;21:3412–3419. doi: 10.1158/1078-0432.CCR-14-2422. [DOI] [PMC free article] [PubMed] [Google Scholar]
- 44.McDonald P.C., Chia S., Bedard P.L., Chu Q., Lyle M., Tang L., Singh M., Zhang Z., Supuran C.T., Renouf D.J. Phase 1 study of SLC-0111, a novel inhibitor of carbonic anhydrase IX, in patients with advanced solid tumors. Am. J. Clin. Oncol. 2020;43:484–490. doi: 10.1097/COC.0000000000000691. [DOI] [PMC free article] [PubMed] [Google Scholar]
- 45.Ng S.S.W., Tsao M.S., Chow S., Hedley D.W. Inhibition of phosphatidylinositide 3-kinase enhances gemcitabine-induced apoptosis in human pancreatic cancer cells. Cancer Res. 2000;60:5451–5455. [PubMed] [Google Scholar]
- 46.Lou Y., McDonald P.C., Oloumi A., Chia S., Ostlund C., Ahmadi A., Kyle A., Auf dem Keller U., Leung S., Huntsman D. Targeting tumor hypoxia: suppression of breast tumor growth and metastasis by novel carbonic anhydrase IX inhibitors. Cancer Res. 2011;71:3364–3376. doi: 10.1158/0008-5472.CAN-10-4261. [DOI] [PubMed] [Google Scholar]
- 47.Lock F.E., McDonald P.C., Lou Y., Serrano I., Chafe S.C., Ostlund C., Aparicio S., Winum J.Y., Supuran C.T., Dedhar S. Targeting carbonic anhydrase IX depletes breast cancer stem cells within the hypoxic niche. Oncogene. 2013;32:5210–5219. doi: 10.1038/onc.2012.550. [DOI] [PubMed] [Google Scholar]
- 48.Swayampakula M., McDonald P.C., Vallejo M., Coyaud E., Chafe S.C., Westerback A., Venkateswaran G., Shankar J., Gao G., Laurent E.M.N. The interactome of metabolic enzyme carbonic anhydrase IX reveals novel roles in tumor cell migration and invadopodia/MMP14-mediated invasion. Oncogene. 2017;36:6244–6261. doi: 10.1038/onc.2017.219. [DOI] [PMC free article] [PubMed] [Google Scholar]
- 49.Brown W.S., Akhand S.S., Wendt M.K. FGFR signaling maintains a drug persistent cell population following epithelial-mesenchymal transition. Oncotarget. 2016;7:83424–83436. doi: 10.18632/oncotarget.13117. [DOI] [PMC free article] [PubMed] [Google Scholar]
- 50.Chafe S.C., McDonald P.C., Saberi S., Nemirovsky O., Venkateswaran G., Burugu S., Gao D., Delaidelli A., Kyle A.H., Baker J.H.E. Targeting hypoxia-induced carbonic anhydrase IX enhances immune-checkpoint blockade locally and systemically. Cancer Immunol. Res. 2019;7:1064–1078. doi: 10.1158/2326-6066.CIR-18-0657. [DOI] [PubMed] [Google Scholar]
- 51.Enot D.P., Vacchelli E., Jacquelot N., Zitvogel L., Kroemer G. TumGrowth: an open-access web tool for the statistical analysis of tumor growth curves. OncoImmunology. 2018;7:e1462431. doi: 10.1080/2162402X.2018.1462431. [DOI] [PMC free article] [PubMed] [Google Scholar]
Associated Data
This section collects any data citations, data availability statements, or supplementary materials included in this article.
Supplementary Materials
Data Availability Statement
The authors declare that all data supporting the findings of this study are available within the paper.