

Abstract
Objectives: This study is aimed to explore the blending process of Dahuang soda tablets. These are composed of two active pharmaceutical ingredients (APIs, emodin and emodin methyl ether) and four kinds of excipients (sodium bicarbonate, starch, sucrose, and magnesium stearate). Also, the objective is to develop a more robust model to determine the blending end-point. Methods: Qualitative and quantitative methods based on near-infrared (NIR) spectroscopy were established to monitor the homogeneity of the powder during the blending process. A calibration set consisting of samples from 15 batches was used to develop two types of calibration models with the partial least squares regression (PLSR) method to explore the influence of density on the model robustness. The principal component analysis-moving block standard deviation (PCA-MBSD) method was used for the end-point determination of the blending with the process spectra. Results: The model with different densities showed better prediction performance and robustness than the model with fixed powder density. In addition, the blending end-points of APIs and excipients were inconsistent because of the differences in the physical properties and chemical contents among the materials of the design batches. For the complex systems of multi-components, using the PCA-MBSD method to determine the blending end-point of each component is difficult. In these conditions, a quantitative method is a more suitable alternative. Conclusions: Our results demonstrated that the effect of density plays an important role in improving the performance of the model, and a robust modeling method has been developed.
Keywords: Process analytical technology, Blending process, Near-infrared spectroscopy, End-point determination
1. Introduction
Traditional Chinese medicine (TCM) is a complex system. As a part of multiple-unit operations involved in the pharmaceutical process of TCM, blending plays an important role in improving consistency of the final products by affecting uniformity of each component directly (de Leersnyder et al., 2019; Pauli et al., 2019; Sánchez-Paternina et al., 2019; Sierra-Vega et al., 2019). Traditionally, the blending process is always carried out with fixed process parameters, such as blending time and materials volume. However, the fluctuation of quality of raw herbal materials will influence product consistency. Therefore, the blending end-point should be monitored according to the real-time concentration of the target component.
High-performance liquid chromatography (HPLC) is commonly used for end-point determination analysis. However, HPLC is not suitable for providing real-time information during the blending process because of the long analytical time and high cost (Bodson et al., 2006). Near-infrared (NIR) spectroscopy is a mature technology for use in the process analytical technology (PAT) system, is characterized by rapid and non-destructive analysis, is environment-friendly, and can also realize remote analysis using optical fiber or wireless transmission devices according to demand (Järvinen et al., 2013; Xue et al., 2018; Lee et al., 2019; Xu et al., 2019). With the help of this method, the end-point of the blending process can be monitored and adjusted in real time, which remarkably improves the quality of final products.
NIR spectroscopy provides two analytical methods employed in end-point determination: qualitative and quantitative. Principal component analysis-moving block standard deviation (PCA-MBSD) and MBSD are the most commonly used qualitative methods, which depend on the differences among the spectra (Momose et al., 2011; Scheibelhofer et al., 2013a, 2013b; Sibik et al., 2017; Barone et al., 2019). Different from the former, partial least squares regression (PLSR) is one of the quantitative methods, which establish the calibration model based on the concentration information of the active components and spectral data (Martínez et al., 2013; Vanarase et al., 2013; Scheibelhofer et al., 2015; de Leersnyder et al., 2018; Vargas et al., 2018; Chen et al., 2019; Deconinck et al., 2019). However, the robustness of the model is closely related to the influence of many factors, such as the representativeness of samples, the instrument state, and the particle size of the powder (Goh et al., 2018; Hossain et al., 2019; Sun et al., 2020). Among them, the density effect is a critical factor affecting the model, and this has received few relevant studies. Rotation angle and volume fraction of the filler will affect the density of powder in different layers because the powder is in a flow process when the blender rotates. A larger size blender increases the density of the powder above the spectral sampling site, and this is accompanied by higher density of NIR spectra. It has been proved that the absorbance of NIR spectra increases as the density increases (Otsuka et al., 2007). However, the density effect is hardly considered in the modeling during the blending process. The correction model established in the laboratory always shows poor prediction performance when it is put into actual production because of the great disparity in size between an industrial blender and one in the laboratory. At present, the methods to reduce the influence of the density effect include spectral preprocessing and density variation incorporation in the model. However, the spectral pretreatment techniques can only eliminate the influence of multiplicative and additive factors (Short et al., 2009). The density effect still exists in spectra even after performing these techniques. In order to improve prediction performance, establishing a correction model including the density effect is necessary.
In recent years, some scholars have explored the influence of the density effect on the model robustness. Mohan et al. (2018) established a small-scale model including density variation by the Instron universal testing system on the study of blending end-point determination of acetaminophen (APAP) and the three kinds of excipients. In addition, a blender-scale model with fixed powder density and a small-scale model without density effect had been developed. The accuracy of the predictions was assessed by the content information from ultraviolet-visible (UV-Vis). Compared with the small-scale method without density effect, the other two models showed better prediction performance. The study has proved that the density effect is a key factor affecting the robustness of the model. However, the study had not considered the end-points of the excipients. Actually, ensuring homogeneous blending of active pharmaceutical ingredients (APIs) and excipients is a crucial prerequisite for acquiring the appropriate solid dosages, and their homogeneity should be fully studied during the blending process (Abe and Otsuka, 2012; Lee et al., 2019).
Dahuang soda tablets have been widely used as a Chinese patent medicine. These have the effects of invigorating the stomach, helping digestion, adjusting gastrointestinal function, heat-clearing, and detoxifying. This study focused on the blending process of Dahuang soda tablets by establishing the calibration model with density effect and the model with fixed powder density. The density variation was included in the calibration set according to the pressure of the custom discus. The blending end-points of the APIs (emodin and emodin methyl ether) and four kinds of excipients (sodium bicarbonate, starch, sucrose, and magnesium stearate) were monitored by PLSR and PCA-MBSD. The study aimed to explore the influence of density on the model robustness. In addition, the results of qualitative and quantitative analyses were compared to explore the difference between the two methods of application of a complex blended system.
2. Materials and methods
2.1. Material preparation
Five kinds of materials were used in the different batches of blends: Rhubarb extract (RuEx, Deze Biotechnology Co., Ltd., Jiangsu, China), magnesium stearate (MgSt, Fengchuan Chemical Reagent Technology Co., Ltd., Tianjin, China), sodium bicarbonate (SB; analytical pure (AR) of ≥99.8%, Aladdin Industrial Corporation, USA), sucrose (Fengchuan Chemical Reagent Technology Co., Ltd.), and starch (Aladdin Industrial Corporation). Rhubarb extract and sodium bicarbonate accounted for 90% (mass fraction) of the blends, and the remaining 10% was composed of starch and sucrose. In this study, the mass fraction of magnesium stearate was the same in all runs since it acted just as lubricant. In addition, it had also been reported that excess magnesium stearate would affect the release of active ingredients and the potential bioavailability (Pawar et al., 2019).
2.2. Sample collection and content determination
As shown in Table 1, an experimental design with five levels of Rhubarb extract (67.5%, 54.0%, 45.0%, 36.0%, and 22.5%, mass fraction) and three starch/sucrose ratio levels (4.0, 1.5, and 1.0) was used to generate a total of 15 batches of samples. Each batch weighed 1 kg and was blended in a V-blender (G-Lang Machinery Co., Ltd., Jiangsu, China) for 30 min at 10 r/min to get a homogeneous mixture. After the blending process finished, 1 g of the sample was taken from the blender and ultrasonically extracted in 100 mL methanol for 1 h. The contents of emodin and emodin methyl ether in the solution were determined by the Agilent 1260 HPLC system (Agilent Technologies, USA) to provide the content information of APIs for the establishment of the quantitative models. The content of excipients was calculated according to the formula composition.
Table 1.
Content information of five kinds of materials in the 18 batches of blends
| Batch* | Dahuang extract (g) | Sodium bicarbonate (g) | Starch (g) | Sucrose (g) | Magnesium stearate (g) |
| 1 | 675 | 225 | 80 | 20 | 3 |
| 2 | 675 | 225 | 60 | 40 | 3 |
| 3 | 675 | 225 | 50 | 50 | 3 |
| 4 | 540 | 360 | 80 | 20 | 3 |
| 5 | 540 | 360 | 60 | 40 | 3 |
| 6 | 540 | 360 | 50 | 50 | 3 |
| 7 | 450 | 450 | 80 | 20 | 3 |
| 8 | 450 | 450 | 60 | 40 | 3 |
| 9 | 450 | 450 | 50 | 50 | 3 |
| 10 | 360 | 540 | 80 | 20 | 3 |
| 11 | 360 | 540 | 60 | 40 | 3 |
| 12 | 360 | 540 | 50 | 50 | 3 |
| 13 | 225 | 675 | 80 | 20 | 3 |
| 14 | 225 | 675 | 60 | 40 | 3 |
| 15 | 225 | 675 | 50 | 50 | 3 |
| 16 | 420 | 480 | 80 | 20 | 3 |
| 17 | 550 | 350 | 75 | 25 | 3 |
| 18 | 330 | 570 | 85 | 15 | 3 |
Each batch weighed 1 kg
2.3. Model development and spectral collection
Two models were established in this study: the model with density effect and the model with fixed powder density. In the correction set of the latter, the density effect was not considered. After each batch of mixture was blended for 30 min, 100 and 200 g samples were taken from the blender and placed in a vessel with flat bottom and uniform thickness. Using a Fourier transform NIR spectrometer (Thermo Fisher Scientific, Wilmington, MA, USA), we collected the spectra of five different points evenly distributed at the bottom of the vessel. Instrument resolution was specified at 8 cm−1. Each spectrum was collected by averaging 64 scans across the wavenumber range of 4000–10 000 cm−1. Three spectra were acquired at each point to generate their average spectra. Finally, 150 spectra were obtained for modeling. Based on the NIR spectral information and content information of the materials, the PLSR quantitative model was established by SIMCA 14.1 software (Umetrics, Sweden). The model with density effect was built in the environment of gravity superposition. Specifically, two samples (100 and 200 g) were taken from the 15 batches of blends and placed in the vessel. The surface of the samples was flat without obvious protrusions. As shown in Fig. 1, each piece of five discuses weighing 200 g was stacked on the top of the sample in turn. After each stacking, the NIR spectra of the bottom five points were collected, and 750 spectra were obtained for the establishment of the model. The spectra were divided into 600 calibration spectra and 150 validation spectra by a random sampling method using MATLAB R2018a (The Mathworks, Natick, MA, USA). This data division method is not affected by any subjective factors nor other system factors. This is conducive to the establishment of NIR calibration model. Through the above method, the density variation was well comprehended in the acquired spectra.
Fig. 1.

Samples with density effect used to establish a robust model
NIR: near-infrared
2.4. Data analysis method
2.4.1 PLSR
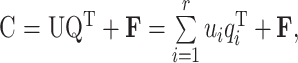
PLSR is one of the most commonly used multivariate calibration methods, and is widely used in chemical measurement and related research. It uses the information in a response matrix and a concentration matrix simultaneously. The data matrix A and concentration matrix C are decomposed into principal components, and r principal factors are extracted to separate the contribution and error of components according to Eqs. (1) and (2).
 , ,
|
(1) |
 , ,
|
(2) |
where T, P, and E are the score, load, and residual matrices of A, resepectively; U, Q, and F are the score, load, and residual matrices of C, resepectively; t i and p i are the ith column of T and P, resepectively; u i and q i are the ith column of U and Q, resepectively. T and U can be correlated according to Eq. (3):
u i=b i t i, (3)
where b i is the correlation coefficient matrix between u i and t i.
In general, the specific implementation method is to exchange iteration variables in the iteration process, that is, to calculate P T with U instead of T, and Q T with T instead of U. After the relationship between T and U is obtained, the prediction can be made by Eq. (4).
C new=T new BQ T=A new PBQ T, (4)
where C new is the concentration matrix of a group of unknown samples, A new and T new are the measurement data matrix and their corresponding score matrix, respectively, and B is the correlation coefficient matrix between U and T.
2.4.2 PCA-MBSD
In recent years, MBSD is the most commonly used qualitative method without correction model in the study of blending end-point determination. The method takes n continuous spectra and calculates the mean value of the standard deviation (SD) of each wavelength in the spectra. Finally, the overall deviation from the spectra is obtained according to Eqs. (5) and (6).
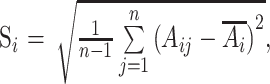 , ,
|
(5) |
 , ,
|
(6) |
where Aij represents the absorbance of spectrum j at wavelength i, represents the average absorbance of n spectra at wavelength i, Si is the SD at wavelength i, m is the number of wavelengths in the spectrum, and S (also named MBSD) is the mean SD at all wavelengths.
However, because of the interference of instrument noise and other factors on the accuracy of absorbance, the result will be affected. PCA-MBSD is the method that extracts a few potential variables which can explain the differences between all variables to replace the original spectral data for SD calculation according to Eqs. (7) to (9). The dimension of data space can be reduced and most of the noise can be eliminated in this way.
 , ,
|
(7) |
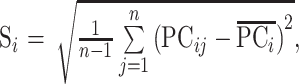 , ,
|
(8) |
 , ,
|
(9) |
where PCij represents the value of principal component i of spectrum j, and A is the number of principal components.
2.4.3 Elimination of abnormal points in the spectral data
The generation of outliers is relatively complex, and is linked to many factors including the state of the measuring instrument, measuring environment, and the operation of technicians. To improve the prediction performance of the models, the identification and processing of outliers are critical. In the process of establishing two kinds of models, a few outliers were removed according to the values of Hotelling T 2 and DModX (Xiong et al., 2012; Kona et al., 2013; Li et al., 2016; Mehmood, 2016). Hotelling T 2 is the sum of the normalized scores of all principal components. This can detect multiple principal components at the same time. It mainly reflects the distance between the sampling point and the center of the model, and it can be used to check whether the fluctuation of the internal variables of the model is abnormal. DModX is mainly used to detect whether the input data structure has changed. When the value exceeds the statistical limit, it indicates that the sample cannot be described by the established model. With the help of Hotelling T 2 and DModX, the outliers can be identified accurately, so as to monitor the real-time state of the blending process.
3. Results and discussion
3.1. Performance comparison of the models
To enhance spectral features and mitigate the influence of noise, spectral preprocessing techniques are essential. The commonly used spectral preprocessing techniques include standard normal variate (SNV), multiplicative scatter correction (MSC), etc. (Chen et al., 2006; Lin et al., 2015; Liu et al., 2019). In this study, several processing methods were used, and the results are listed in Tables 2 and 3. It was found that the combination of SNV and Savitzky-Golay smoothing could optimize the performance of the models. Moreover, the results show that the optimization effect of SNV is clearly better than that of other methods. SNV is one of the most commonly used scattering correction methods, which requires all data points of each spectrum to conform to the assumption of a normal distribution. The algorithm subtracts the average value of all data points of each data point, and then divides the result by the SD to eliminate the influence of scattering caused by uneven particle distribution and different sizes on the spectrum. Using this processing method may reduce the influence of density effect to a certain extent. Fig. 2 shows the raw spectra and the spectra after preprocessing. However, implementing these techniques does not eliminate the effects of density completely, because the non-linear effects and an apparent chemical change caused by density changes will have a subsequent impact on the model (Short et al., 2009; Mohan et al., 2018). After the spectral preprocessing, the principal component scores of the two models were calculated and compared. It was found that the first two principal components explained the variance of 91.23% and 90.98%, respectively, in the spectral data difference of the models. The scatter distribution is shown in Fig. 3. The scatter plots of the model with density effect covered the model with fixed powder density, thus indicating that the main factors affecting the difference in the NIR spectra exhibited in the latter were included in the former. Through PCA, the model including density variation showed better robustness. The reason may be that by changing the density of the powder, more factors that may cause the spectral difference would be contained in the calibration spectra, so that the robustness of the model could be improved to a certain extent.
Table 2.
Influence of different pretreatment methods and their combinations on number of principle components, RMSECV, RMSEC, RMSEP, R c 2, and R p 2 of the model with density effect
| Pretreatment method | Number of PCs | RMSECV (%)* | RMSEC (%)* | R c 2 | RMSEP (%)* | R p 2 |
| Raw spectra | 9 | 0.3339 | 0.2822 | 0.9866 | 0.2978 | 0.9865 |
| MSC | 9 | 0.2872 | 0.2561 | 0.9890 | 0.3025 | 0.9862 |
| SNV | 8 | 0.2892 | 0.2786 | 0.9870 | 0.2845 | 0.9878 |
| 1st derivative | 7 | 0.3551 | 0.3066 | 0.9842 | 0.3385 | 0.9829 |
| 2nd derivative | 6 | 0.4364 | 0.3442 | 0.9800 | 0.4073 | 0.9749 |
| Savitzky-Golay | 8 | 0.3197 | 0.3070 | 0.9841 | 0.3235 | 0.9842 |
| SNV+Savitzky-Golay | 11 | 0.2694 | 0.2451 | 0.9899 | 0.2788 | 0.9882 |
| 1st derivative+Savitzky-Golay | 7 | 0.3642 | 0.3171 | 0.9830 | 0.3451 | 0.9823 |
| SNV+1st derivative | 5 | 0.3456 | 0.3148 | 0.9833 | 0.3370 | 0.9829 |
Mass fraction. PCs: principal components; RMSECV: root mean square error of cross-validation; RMSEC: root mean square error of calibration; RMSEP: root mean square error of prediction; R c: related coefficient of calibration set; R p: related coefficient of prediction set; MSC: multiplicative scatter correction; SNV: standard normal variate
Table 3.
Influence of different pretreatment methods and their combinations on number of principle components, RMSECV, RMSEC, RMSEP, R c 2, and R p 2 of the model without density effect
| Pretreatment method | Number of PCs | RMSECV (%)* | RMSEC (%)* | R c 2 | RMSEP (%)* | R p 2 |
| Raw spectra | 9 | 4.3991 | 2.4609 | 0.9889 | 4.3670 | 0.9766 |
| MSC | 5 | 2.7524 | 3.2240 | 0.9809 | 3.8982 | 0.2819 |
| SNV | 9 | 3.3075 | 2.1246 | 0.9918 | 3.4420 | 0.9852 |
| 1st derivative | 5 | 3.8799 | 3.0253 | 0.9832 | 4.8695 | 0.9712 |
| 2nd derivative | 6 | 4.7132 | 2.1549 | 0.9915 | 5.6741 | 0.9603 |
| Savitzky-Golay | 7 | 3.8624 | 2.7719 | 0.9959 | 4.4223 | 0.9757 |
| SNV+Savitzky-Golay | 11 | 2.9610 | 1.9913 | 0.9928 | 3.6011 | 0.9837 |
| 1st derivative+Savitzky-Golay | 5 | 3.9886 | 3.1255 | 0.9820 | 4.9118 | 0.9709 |
| SNV+1st derivative | 5 | 3.3014 | 2.1133 | 0.9919 | 4.6162 | 0.9740 |
Mass fraction. PCs: principal components; RMSECV: root mean square error of cross-validation; RMSEC: root mean square error of calibration; RMSEP: root mean square error of prediction; R c: related coefficient of calibration set; R p: related coefficient of prediction set; MSC: multiplicative scatter correction; SNV: standard normal variate
Fig. 2.

Near-infrared spectra of samples
(a) Near-infrared raw spectra of 15 batches of samples; (b) The spectra of 15 batches of samples after the pretreatment with standard normal variate (SNV) and Savitzky-Golay smoothing
Fig. 3.

PC1–PC2 score plot for samples of the two models
PC: principal component
The quantitative models of five kinds of materials (emodin, emodin methyl ether, sodium bicarbonate, starch, and sucrose) were established, as shown in Figs. 4 and 5. In this study, the PLSR model of MgSt was not established. The mass fraction of MgSt in the prescription was only 0.3%, which was quite close to the detection limit of 0.1% of NIR spectra, resulting in a low response value of the spectra and a large deviation from prediction. The statistical data of model performance are shown in Table 4. It can be seen that emodin, emodin methyl ether, and sodium bicarbonate in the model with density effect showed lower root mean square error of prediction (RMSEP) and higher related coefficient of prediction set (R p 2). However, the corresponding values of starch and sucrose in model with density effect were not as good as another model. Because sucrose and starch only accounted for 10% (mass fraction) of the total content of the prescription, when the compression was applied, the densities of these two kinds of excipients above the spectral sampling site may not change significantly, and the influence of density variation was not included in the components. Referring to the above analysis, both methods confirm the importance of density effect on improving the model robustness.
Fig. 4.

Correlation plots of measured values vs. near-infrared predictions of the model with density effect
(a) Emodin; (b) Emodin methyl ether; (c) Sodium bicarbonate; (d) Starch; (e) Sucrose
Fig. 5.

Correlation plots of measured values vs. near-infrared predictions of the model without density effect
(a) Emodin; (b) Emodin methyl ether; (c) Sodium bicarbonate; (d) Starch; (e) Sucrose
Table 4.
Performance parameters of the two models
| Ingredient | Model with density effect |
Model without density effect |
||||||||
| Rc2 | RMSEC | Rp2 | RMSEP | Rc2 | RMSEC | Rp2 | RMSEP | |||
| (%)* | (%)* | (%)* | (%)* | |||||||
| Emodin | 0.99 | 0.2451 | 0.9896 | 0.2599 | 0.9937 | 0.1865 | 0.9842 | 0.3775 | ||
| Emodin methyl ether | 0.9859 | 0.0486 | 0.9857 | 0.0502 | 0.9919 | 0.0359 | 0.9843 | 0.0603 | ||
| Sodium bicarbonate | 0.9897 | 1.5214 | 0.9938 | 1.2456 | 0.9919 | 1.3105 | 0.9868 | 2.0329 | ||
| Starch/sucrose | 0.953 | 0.2643 | 0.9319 | 0.3177 | 0.9736 | 0.204 | 0.9434 | 0.2685 | ||
Mass fraction. Rc: related coefficient of calibration set; Rp: related coefficient of prediction set; RMSEC: root mean square error of calibration; RMSEP: root mean square error of prediction
3.2. Practical prediction performance of the two models
To further explore the prediction performance of the two models, three other independent blend batches were designed, and the details are shown in Table 1. Different from the first 15 modeling batches of blends, the contents of the four kinds of materials were set at different levels, so as to fully investigate the prediction accuracy of the models.
During the blending process, a 10-g sample was taken from the bottom of the blender every minute, and then a spectrum was obtained. A total of 30 spectra were collected for each batch of blend. The prediction trend of each material is shown in Figs. 6‒8. In the initial stage of blending, the predicted values of materials fluctuated greatly. As the blending proceeded, the prediction trends moved to being stable. The accuracy of the predictions of the APIs was assessed by the content information from HPLC after 30 min of blending, and typical chromatograms of emodin and emodin methyl ether are shown in Fig. 9. To establish whether there is significant difference between the predictions of these models, a 95% confidence interval was generated from the predicted value of the last 10 min of each material in the models (Table 5). By comparing the predicted value of each component in the 30th minute with the actual value, it was found that the prediction accuracies of the two models for sucrose in the second batch of samples were significantly lower than those in the first batch. Because of the long storage time, the sucrose had absorbed moisture, resulting in stratification during the blending process. After replacing it with dry sucrose in the third batch of mixture, the prediction performance of the two models was improved considerably, and the deviation from the expected value was small. On the other hand, starch is a polysaccharide composed of multiple sugar units, and sucrose belongs to disaccharide. It can be seen from Fig. 10 that compared with sodium bicarbonate, the NIR spectra of starch and sucrose are very similar, which will cause certain interference to the model prediction. This is also one of the main reasons for the lower predicted value of sucrose and the higher predicted value of starch in the second batch of mixture.
Fig. 6.

Prediction values of partial least squares regression (PLSR) models (batch 1)
(a) Emodin; (b) Emodin methyl ether; (c) Sodium bicarbonate; (d) Starch; (e) Sucrose
Fig. 9.

Typical chromatograms of the Dahuang extract
(1) Emodin; (2) Emodin methyl ether
Table 5.
Model performance comparison of three batches of blends
| Batch | Ingredient | Model with density effect |
Model without density effect |
Actual value | |||
| Mass fraction at the end (%) | 95% CI at 30 min | Mass fraction at the end (%) | 95% CI at 30 min | ||||
| 1 | Emodin | 8.54 | [7.80, 8.86] | 9.41 | [8.95, 9.88] | 8.79 | |
| Emodin methyl ether | 1.21 | [1.14, 1.26] | 1.47 | [1.40, 1.51] | 1.33 | ||
| Sodium bicarbonate | 47.70 | [45.64, 51.33] | 46.24 | [44.21, 49.55] | 48.00 | ||
| Starch | 8.50 | [8.16, 8.54] | 9.57 | [9.33, 9.64] | 8.00 | ||
| Sucrose | 1.50 | [1.46, 1.84] | 0.43 | [0.36, 0.67] | 2.00 | ||
| 2 | Emodin | 10.35 | [10.18, 10.70] | 10.25 | [10.02, 10.61] | 9.71 | |
| Emodin methyl ether | 1.58 | [1.57, 1.64] | 1.57 | [1.56, 1.63] | 1.47 | ||
| Sodium bicarbonate | 35.86 | [34.09, 36.72] | 36.47 | [34.84, 37.20] | 35.00 | ||
| Starch | 8.36 | [7.92, 8.47] | 8.57 | [8.21, 8.77] | 7.50 | ||
| Sucrose | 1.64 | [1.53, 2.08] | 1.43 | [1.23, 1.79] | 2.50 | ||
| 3 | Emodin | 6.62 | [6.48, 6.71] | 6.30 | [6.19, 6.44] | 6.76 | |
| Emodin methyl ether | 1.02 | [1.00, 1.04] | 1.01 | [0.98, 1.03] | 0.97 | ||
| Sodium bicarbonate | 58.12 | [57.70, 59.16] | 58.34 | [57.77, 59.49] | 57.00 | ||
| Starch | 8.49 | [8.19, 9.05] | 8.68 | [8.42, 9.17] | 8.50 | ||
| Sucrose | 1.51 | [1.16, 1.67] | 1.32 | [0.83, 1.58] | 1.50 | ||
CI: confidence interval
Fig. 10.

Near-infrared raw spectra of the three kinds of excipients
Fig. 7.

Prediction values of partial least squares regression (PLSR) models (batch 2)
(a) Emodin; (b) Emodin methyl ether; (c) Sodium bicarbonate; (d) Starch; (e) Sucrose
Fig. 8.

Prediction values of partial least squares regression (PLSR) models (batch 3)
(a) Emodin; (b) Emodin methyl ether; (c) Sodium bicarbonate; (d) Starch; (e) Sucrose
According to the result in Table 5, the prediction accuracy of the model with density effect is improved significantly compared to the model with fixed powder density. The result further confirms that the density effect has a significant impact on the robustness of the model. Table 6 shows the blending end-points of the APIs and the excipients in the three batches of blends, and it can be seen that there are some differences among the end-points of the five kinds of ingredients, and the end-points of the same ingredient in different batches are always different. For the ingredients with high content, the time required for uniform blending is relatively short. On the contrary, the excipients with lower content always take more time to reach the end-point.
Table 6.
Blending end-points of the ingredients in different batches
| Ingredient | Batch | Blending end-point (min) |
| Emodin | 1 | 8 |
| 2 | 5 | |
| 3 | 4 | |
| Emodin methyl ether | 1 | 8 |
| 2 | 5 | |
| 3 | 4 | |
| Sodium bicarbonate | 1 | 5 |
| 2 | 5 | |
| 3 | 11 | |
| Starch | 1 | 12 |
| 2 | 14 | |
| 3 | 4 | |
| Sucrose | 1 | 12 |
| 2 | 14 | |
| 3 | 9 |
3.3. End-point determination with the PCA-MBSD method
The first 13 principal components were extracted to replace the original spectral data for analysis. When the SD value of the spectra is lower than the predefined value (4) and tends to be stable, the mixture can be considered to be homogeneous. Fig. 11 shows that the blending process of the three batches of blends is completed in about 7 min. Compared with the results of quantitative analysis, PCA-MBSD can only be used to provide effective feedback for the blending process of high content ingredients. However, for the lower content excipients, the small response signal in the NIR spectra results in the relatively low interpretation of the difference on the whole spectrum, and it is impossible to accurately characterize the variation trend of their SD values using PCA-MBSD.
Fig. 11.

Principal component analysis-moving block standard deviation (PCA-MBSD) trend curves of the three batches blends
4. Conclusions
In this work, the influence of density on the model was investigated. Two kinds of models were used to monitor the blending end-point of Dahuang soda tablets. The model with density effect showed better prediction performance, which demonstrated that the density effect was a key factor in improving the robustness of the model. Compared with PCA-MBSD, PLSR is the method that is more suitable for determination of the blending end-point in the face of the complex systems of multi-components. In addition, it was found that sucrose has strong water absorption and similar NIR absorption to starch. Thus, it is proposed to replace it with other excipients in the actual production process to improve prediction performance. This study shows that establishing the calibration model with density effect using NIR spectroscopy is an effective means for homogenization research, and it can be extended to further technological processes.
Footnotes
Project supported by the National S&T Major Project of China (No. 2018ZX09201011)
Contributors: Si-jun WU performed the experimental research and data analysis, wrote and edited the manuscript. Ping QIU and Pian LI provided samples and other logistics support. Zheng LI provided research funding and participated in research discussion. Wen-long LI participated in research discussion, and wrote and edited of the manuscript. All authors have read and approved the final manuscript and, therefore, have full access to all the data in the study and take responsibility for the integrity and security of the data.
Compliance with ethics guidelines: Si-jun WU, Ping QIU, Pian LI, Zheng LI, and Wen-long LI declare that they have no conflict of interest.
This article does not contain any studies with human or animal subjects performed by any of the authors.
References
- 1.Abe H, Otsuka M. Effects of lubricant-mixing time on prolongation of dissolution time and its prediction by measuring near infrared spectra from tablets. Drug Dev Ind Pharm. 2012;38(4):412–419. doi: 10.3109/03639045.2011.608679. [DOI] [PubMed] [Google Scholar]
- 2.Barone A, Glassey J, Montague G. Towards online near-infrared spectroscopy to optimise food product mixing. J Food Eng. 2019;263:227–236. doi: 10.1016/j.jfoodeng.2019.07.003. [DOI] [Google Scholar]
- 3.Bodson C, Dewé W, Hubert P, et al. Comparison of FT-NIR transmission and UV-vis spectrophotometry to follow the mixing kinetics and to assay low-dose tablets containing riboflavin. J Pharm Biomed Anal. 2006;41(3):783–790. doi: 10.1016/j.jpba.2006.01.022. [DOI] [PubMed] [Google Scholar]
- 4.Chen H, Tan C, Lin Z, et al. Quantifying several adulterants of notoginseng powder by near-infrared spectroscopy and multivariate calibration. Spectrochim Acta Part A Mol Biomol Spectrosc. 2019;211:280–286. doi: 10.1016/j.saa.2018.12.003. [DOI] [PubMed] [Google Scholar]
- 5.Chen ZP, Morris J, Martin E, et al. Extracting chemical information from spectral data with multiplicative light scattering effects by optical path-length estimation and correction. Anal Chem. 2006;78(22):7674–7681. doi: 10.1021/ac0610255. [DOI] [PubMed] [Google Scholar]
- 6.de Leersnyder F, Peeters E, Djalabi H, et al. Development and validation of an in-line NIR spectroscopic method for continuous blend potency determination in the feed frame of a tablet press. J Pharm Biomed Anal. 2018;151:274–283. doi: 10.1016/j.jpba.2018.01.032. [DOI] [PubMed] [Google Scholar]
- 7.Deconinck E, van Campenhout R, Aouadi C, et al. Combining attenuated total reflectance-infrared spectroscopy and chemometrics for the identification and the dosage estimation of MDMA tablets. Talanta. 2019;195:142–151. doi: 10.1016/j.talanta.2018.11.027. [DOI] [PubMed] [Google Scholar]
- 8.de Leersnyder F, Vanhoorne V, Kumar A, et al. Evaluation of an in-line NIR spectroscopic method for the determination of the residence time in a tablet press. Int J Pharm. 2019;565:358–366. doi: 10.1016/j.ijpharm.2019.05.006. [DOI] [PubMed] [Google Scholar]
- 9.Goh HP, Heng PWS, Liew CV. Comparative evaluation of powder flow parameters with reference to particle size and shape. Int J Pharm. 2018;547(1-2):133–141. doi: 10.1016/j.ijpharm.2018.05.059. [DOI] [PubMed] [Google Scholar]
- 10.Hossain MN, Igne B, Anderson CA, et al. Influence of moisture variation on the performance of Raman spectroscopy in quantitative pharmaceutical analyses. J Pharm Biomed Anal. 2019;164:528–535. doi: 10.1016/j.jpba.2018.10.022. [DOI] [PubMed] [Google Scholar]
- 11.Järvinen K, Hoehe W, Järvinen M, et al. In-line monitoring of the drug content of powder mixtures and tablets by near-infrared spectroscopy during the continuous direct compression tableting process. Eur J Pharm Sci. 2013;48(4-5):680–688. doi: 10.1016/j.ejps.2012.12.032. [DOI] [PubMed] [Google Scholar]
- 12.Kona R, Qu HB, Mattes R, et al. Application of in-line near infrared spectroscopy and multivariate batch modeling for process monitoring in fluid bed granulation. Int J Pharm. 2013;452(1-2):63–72. doi: 10.1016/j.ijpharm.2013.04.039. [DOI] [PubMed] [Google Scholar]
- 13.Lee WB, Widjaja E, Heng PWS, et al. Near infrared spectroscopy for rapid and in-line detection of particle size distribution variability in lactose during mixing. Int J Pharm. 2019;566:454–462. doi: 10.1016/j.ijpharm.2019.06.002. [DOI] [PubMed] [Google Scholar]
- 14.Li WL, Han HF, Cheng ZW, et al. A feasibility research on the monitoring of traditional Chinese medicine production process using NIR-based multivariate process trajectories. Sensor Actuat B Chem. 2016;231:313–323. doi: 10.1016/j.snb.2016.03.023. [DOI] [Google Scholar]
- 15.Lin YQ, Li WY, Xu J, et al. Development of a NIR-based blend uniformity method for a drug product containing multiple structurally similar actives by using the quality by design principles. Int J Pharm. 2015;488(1-2):120–126. doi: 10.1016/j.ijpharm.2015.04.025. [DOI] [PubMed] [Google Scholar]
- 16.Liu P, Wang J, Li Q, et al. Rapid identification and quantification of Panax notoginseng with its adulterants by near infrared spectroscopy combined with chemometrics. Spectrochim Acta Part A Mol Biomol Spectrosc. 2019;206:23–30. doi: 10.1016/j.saa.2018.07.094. [DOI] [PubMed] [Google Scholar]
- 17.Martínez L, Peinado A, Liesum L, et al. Use of near-infrared spectroscopy to quantify drug content on a continuous blending process: influence of mass flow and rotation speed variations. Eur J Pharm Biopharm. 2013;84(3):606–615. doi: 10.1016/j.ejpb.2013.01.016. [DOI] [PubMed] [Google Scholar]
- 18.Mehmood T. Hotelling T 2 based variable selection in partial least squares regression. Chemometr Intell Lab Syst. 2016;154:23–28. doi: 10.1016/j.chemolab.2016.03.001. [DOI] [Google Scholar]
- 19.Mohan S, Momose W, Katz JM, et al. A robust quantitative near infrared modeling approach for blend monitoring. J Pharm Biomed Anal. 2018;148:51–57. doi: 10.1016/j.jpba.2017.09.011. [DOI] [PubMed] [Google Scholar]
- 20.Momose W, Imai K, Yokota S, et al. Process analytical technology applied for end-point detection of pharmaceutical blending by combining two calibration-free methods: simultaneously monitoring specific near-infrared peak intensity and moving block standard deviation. Powder Technol. 2011;210(2):122–131. doi: 10.1016/j.powtec.2011.03.005. [DOI] [Google Scholar]
- 21.Otsuka M, Tanabe H, Osaki K, et al. Chemoinformetrical evaluation of dissolution property of indomethacin tablets by near-infrared spectroscopy. J Pharm Sci. 2007;96(4):788–801. doi: 10.1002/jps.20704. [DOI] [PubMed] [Google Scholar]
- 22.Pauli V, Roggo Y, Pellegatti L, et al. Process analytical technology for continuous manufacturing tableting processing: a case study. J Pharm Biomed Anal. 2019;162:101–111. doi: 10.1016/j.jpba.2018.09.016. [DOI] [PubMed] [Google Scholar]
- 23.Pawar P, Talwar S, Reddy D, et al. A “Large-N” content uniformity process analytical technology (PAT) method for phenytoin sodium tablets. J Pharm Sci. 2019;108(1):494–505. doi: 10.1016/j.xphs.2018.06.031. [DOI] [PubMed] [Google Scholar]
- 24.Sánchez-Paternina A, Sierra-Vega NO, Cárdenas V, et al. Variographic analysis: a new methodology for quality assurance of pharmaceutical blending processes. Comput Chem Eng. 2019;124:109–123. doi: 10.1016/j.compchemeng.2019.02.010. [DOI] [Google Scholar]
- 25.Scheibelhofer O, Balak N, Wahl PR, et al. Monitoring blending of pharmaceutical powders with multipoint NIR spectroscopy. AAPS Pharm Sci Tech. 2013;14:234–244. doi: 10.1208/s12249-012-9910-4. [DOI] [PMC free article] [PubMed] [Google Scholar]
- 26.Scheibelhofer O, Balak N, Koller DM, et al. Spatially resolved monitoring of powder mixing processes via multiple NIR-probes. Powder Technol. 2013;243:161–170. doi: 10.1016/j.powtec.2013.03.035. [DOI] [Google Scholar]
- 27.Scheibelhofer O, Grabner B, Bondi RW, Jr, et al. Designed blending for near infrared calibration. J Pharm Sci. 2015;104(7):2312–2322. doi: 10.1002/jps.24488. [DOI] [PubMed] [Google Scholar]
- 28.Short SM, Cogdill RP, Wildfong PLD, et al. A near-infrared spectroscopic investigation of relative density and crushing strength in four-component compacts. J Pharm Sci. 2009;98(3):1095–1109. doi: 10.1002/jps.21473. [DOI] [PubMed] [Google Scholar]
- 29.Sibik J, Chalus P, Maurer L, et al. Mechanistic approach in powder blending PAT: bi-layer mixing and asymptotic end point prediction. Powder Technol. 2017;308:306–317. doi: 10.1016/j.powtec.2016.12.038. [DOI] [Google Scholar]
- 30.Sierra-Vega NO, Román-Ospino A, Scicolone J, et al. Assessment of blend uniformity in a continuous tablet manufacturing process. Int J Pharm. 2019;560:322–333. doi: 10.1016/j.ijpharm.2019.01.073. [DOI] [PubMed] [Google Scholar]
- 31.Sun XD, Subedi P, Walsh KB. Achieving robustness to temperature change of a NIRS-PLSR model for intact mango fruit dry matter content. Postharvest Biol Technol, 162:111117. 2020 doi: 10.1016/j.postharvbio.2019.111117. [DOI] [Google Scholar]
- 32.Vanarase AU, Osorio JG, Muzzio FJ, et al. Effects of powder flow properties and shear environment on the performance of continuous mixing of pharmaceutical powders. Powder Technol. 2013;246:63–72. doi: 10.1016/j.powtec.2013.05.002. [DOI] [Google Scholar]
- 33.Vargas JM, Nielsen S, Cárdenas V, et al. Process analytical technology in continuous manufacturing of a commercial pharmaceutical product. Int J Pharm. 2018;538(1-2):167–178. doi: 10.1016/j.ijpharm.2018.01.003. [DOI] [PubMed] [Google Scholar]
- 34.Xiong HS, Gong XC, Qu HB, et al. Monitoring batch-to-batch reproducibility of liquid-liquid extraction process using in-line near-infrared spectroscopy combined with multivariate analysis. J Pharm Biomed Anal. 2012;70:178–187. doi: 10.1016/j.jpba.2012.06.028. [DOI] [PubMed] [Google Scholar]
- 35.Xu L, Shou JY, Gill RA, et al. Effects of ZJ0273 on barley and growth recovery of herbicide-stressed seedlings through application of branched-chain amino acids. J Zhejiang Univ-Sci B (Biomed & Biotechnol) 2019;20(1):71–83. doi: 10.1631/jzus.B1700375. [DOI] [PMC free article] [PubMed] [Google Scholar]
- 36.Xue SW, Lee TW, Guo YH. Spontaneous activity in medial orbitofrontal cortex correlates with trait anxiety in healthy male adults. J Zhejiang Univ-Sci B (Biomed & Biotechnol) 2018;19(8):643–653. doi: 10.1631/jzus.B1700481. [DOI] [PMC free article] [PubMed] [Google Scholar]