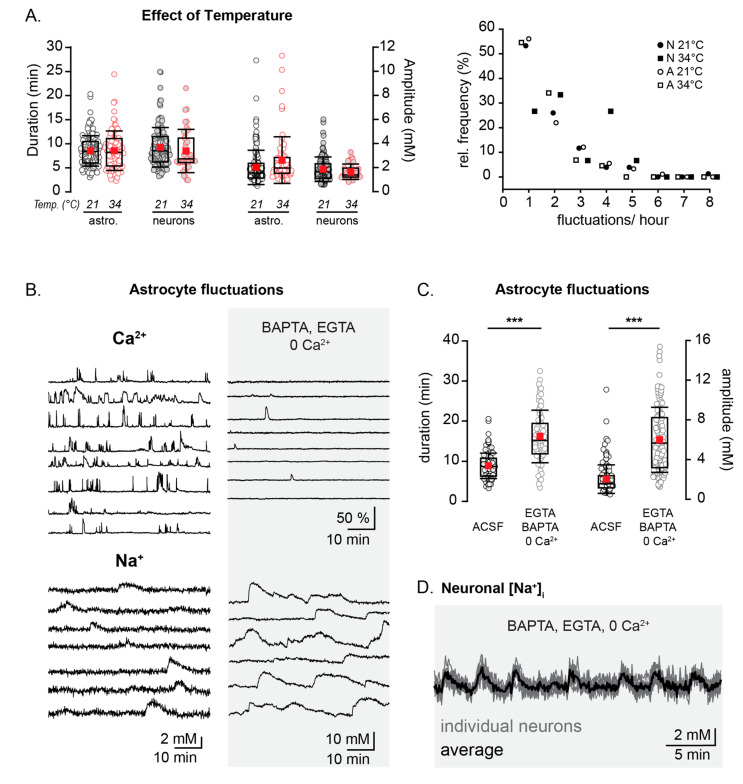
Figure 4.
Temperature dependence and interrelation with spontaneous Ca2+-signaling. (A) Left: the duration and amplitude of neonatal astrocytic and neuronal Na+ fluctuations at 21 °C (black) and 34 °C (red). Right: the relative frequency distribution plot of neonatal Na+ fluctuations at 21 °C (neurons- black circles, astrocytes- white circles) and 34 °C (neurons- black squares, astrocytes- white squares). (B) Example traces from individual astrocytes in Ca2+ imaging experiments (top) and during Na+ imaging (bottom), both in ACSF (left) and in the presence of a Ca2+-chelated solution (0 Ca2+, ACSF containing 500 µM of BAPTA-AM and 1 mM of EGTA) (right). (C) Box plots illustrating the increase in the astrocytic Na+ fluctuation amplitudes after the chelation of Ca2+. (D) Traces showing the Na+ fluctuations in several individual neurons (grey) and an averaged trace (black) in a Ca2+-chelated solution. *** p < 0.001.

