

Summary
Allogeneic CD8+ cytotoxic T cells play an essential role in rejecting transplanted allografts, but how their effector function is regulated on a transcriptional level remains unclear. Herein, we investigate the role of interferon regulatory factor 4 (IRF4) in controlling CD8+ T‐cell function in response to transplant. B6.Rag1−/− mice were adoptively transferred with CD8+ T cells isolated from either Irf4 fl/fl Cd4‐Cre (T‐cell‐specific Irf4‐deficient) or Irf4 fl/fl control mice, followed by BALB/c skin transplantation. Recipients that received Irf4‐deficient CD8+ T cells permanently accepted the skin allografts, whereas recipients that received control CD8+ T cells acutely rejected the transplanted skins. Mechanistically, compared with the transferred control CD8+ T cells in B6.Rag1−/− recipients, the transferred Irf4‐deficient CD8+ T cells lost the capacity to differentiate into CD127−KLRG1+ terminal effector cells, barely produced effector cytokines and cytotoxic molecules (e.g. IL‐2, IFN‐γ, TNF‐α, granzyme A and granzyme B), and displayed defect in proliferative capacity, evident by their decreased Ki67 expression and lower frequencies. Moreover, the transferred Irf4‐deficient CD8+ T cells displayed low expression of transcription factors ID2 and T‐bet that govern the terminal effector T‐cell programmes, and high expression of transcription factor TCF1 that maintains the naïve‐memory T‐cell programmes. Hence, IRF4 deficiency in CD8+ T cells abrogates their terminal effector differentiation and promotes transplant acceptance. These findings suggest that targeting IRF4 expression represents an attractive and promising therapeutic approach for inducing transplant acceptance.
Keywords: CD8 T cells, IRF4, T‐cell differentiation, transplantation
Ablation of IRF4 in CD8+ T cells abrogates their function to reject skin allografts. Mechanistically, IRF4 deletion in CD8+ T cells impairs the production of proinflammatory cytokines and cytotoxic molecules, and completely abolishes their differentiation into terminal effector cells.

Abbreviations
- APC
antigen‐presenting cell
- B6
C57BL/6
- Blimp‐1
B lymphocyte‐induced maturation protein‐1
- EOMES
eomesodermin
- H&E
, haematoxylin and eosin
- Helios
IKAROS family zinc finger 2
- ID2
inhibitor of DNA binding 2
- IRF4
interferon regulatory factor 4
- MFI
mean fluorescent intensity
- MLR
mixed leucocyte reaction
- MST
Mean survival time
- T‐bet
Tbox protein expressed in T cells
- TCF1
the transcription factor T‐cell factor 1
- WT
wild type
- ZEB2
zinc finger E‐box binding homeobox 2
INTRODUCTION
T cells play a central role in mediating transplant rejection. One of the main effector mechanisms in transplant rejection is the generation of allogeneic CD8+ cytotoxic effector T cells 1 . In some transplantation models, CD8+ T cells have been shown to recognize alloantigens and reject allografts in the absence of help from CD4+ T helper cells. 2 , 3 CD8+ effector T cells that infiltrate the allografts produce proinflammatory cytokines and cytotoxic molecules, and thus contribute to allograft rejection. 3 , 4
Several key transcription factors regulate the differentiation of antigen‐specific naïve CD8+ T cells into functional cytotoxic effector T cells. T‐cell factor 1 (TCF1, encoded by Tcf7) has been shown to repress effector differentiation and function of CD8+ T cells. 5 By contrast, Tbox protein expressed in T cells (T‐bet), inhibitor of DNA binding 2 (ID2) and zinc finger E‐box binding homeobox 2 (ZEB2) promote the effector differentiation of CD8+ T cells, in particular the CD127−KLRG1+ terminal effector T cells. 6 , 7 , 8 , 9 Nevertheless, in the context of transplantation, the transcriptional programmes that regulate allogeneic CD8+ T‐cell responses have not been adequately explored.
Interferon regulatory factor 4 (IRF4) belongs to the IRF family of transcription factors and is preferentially expressed in haematopoietic cells. In T cells, IRF4 is promptly expressed following TCR stimulation, and regulates the majority of the TCR affinity‐driven transcriptional changes. 10 In CD4+ T cells, IRF4 promotes the differentiation of naïve CD4+ T cell into Th1, Th2, Th9, Th17 or Tfh cells. 11 , 12 , 13 , 14 , 15 In CD8+ T cells, IRF4 controls the production of effector molecules following activation, and sustains the effector differentiation and clonal expansion. 16 , 17 Deletion of IRF4 in T cells abrogates T‐cell‐mediated immune responses, such as autoimmunity, allergy and infections. 15 , 18 , 19 , 20
We have recently demonstrated that BALB/c allografts are accepted and tolerated by Irf4 fl/fl Cd4‐Cre mice, which are in B6 background with T‐cell‐specific IRF4 deletion. 21 , 22 In those studies, we mainly investigated the role of IRF4 in allogeneic CD4+ T‐cell responses, and found that IRF4 deletion drives CD4+ T‐cell dysfunction. 21 Herein, we investigated the role of IRF4 in CD8+ T‐cell‐mediated transplant rejection. B6.Rag1−/− recipients were adoptively transferred with either Irf4‐deficient CD8+ T cells from Irf4 fl/fl Cd4‐Cre mice or control CD8+ T cells from Irf4 fl/fl mice, and then transplanted with BALB/c skin allografts. Adoptively transferred control CD8+ T cells mediated acute BALB/c allograft rejection in B6.Rag1−/− recipients. By contrast, BALB/c allografts were permanently accepted by B6.Rag1−/− recipients that were adoptively transferred with Irf4‐deficient CD8+ T cells. Mechanistically, deletion of IRF4 abrogated the terminal effector differentiation of antigraft CD8+ T cells. Hence, we propose that targeting IRF4 expression represents a potential therapeutic approach for achieving transplant acceptance.
MATERIALS AND METHODS
Mice
C57BL/6 (B6), BALB/c, B6.Rag1−/− mice, Cd4‐Cre (B6 background) and Irf4 fl/fl(B6 background) were purchased from the Jackson Laboratory (Bar Harbor). Cd4‐Cre mice were crossed to Irf4 fl/fl mice to create Irf4 fl/fl Cd4‐Cre mice. All animal experiments in this study were approved by the Houston Methodist Animal Care Committee in accordance with Institutional Animal Care and Use Guidelines.
In vitro T‐cell stimulation
Splenocytes were isolated from wild‐type (WT) B6 mice, and plated in 96‐well round‐bottom tissue‐culture plates (3 × 10⁵ cells/well) in the presence of 2 µg/ml soluble anti‐CD3e mAb (clone 145‐2C11; BioLegend) for 24 h. Stimulated CD8+ T cells were analysed by an LSR II or Fortessa flow cytometer (BD Biosciences).
Mixed leucocyte reaction
The Dynabeads Untouched Mouse CD8 Cells Kit (Thermo Fisher Scientific) was used to purify CD8+ T cells from the spleens of either Irf4 fl/fl Cd4‐Cre or Irf4 fl/fl mice, followed by using an anti‐CD44 mAb (clone IM7; BioLegend) and the Depletion Dynabeads (Thermo Fisher Scientific) to obtain CD44Low naïve CD8+ T cells. An anti‐CD3 mAb (clone 17A2; BioLegend) and the Depletion Dynabeads were used to obtain T‐cell‐depleted BALB/c (allogeneic stimulators) or B6 (syngeneic stimulators) splenocytes. CD44low naïve CD8+ T cells and stimulators were then mixed in a 1:1 ratio, plated into 96‐well round‐bottom plates (a total of 4 × 10⁵ cells/well) and incubated with or without 10 ng/ml murine IL‐2 (PeproTech) for 72 h. The cultured CD8+ T cells were analysed by an LSR II or Fortessa flow cytometer.
Adoptive transfer of CD8+ T cells
Total CD8+ T cells were isolated from the spleens of either Irf4 fl/fl Cd4‐Cre or Irf4 fl/fl mice by using the Dynabeads Untouched Mouse CD8 Cells Kit. CD44Low naïve CD8+ T cells were further purified from total CD8+ T cells by using an anti‐CD44 mAb and the Depletion Dynabeads. B6.Rag1−/− mice were intravenously transferred with 5 x 10⁵ total or naïve CD8+ T cells 1 day prior to skin transplantation.
Murine skin transplantation and histology staining
Full‐thickness tail skins (~1 cm2) from BALB/c mice were transplanted onto B6.Rag1−/− mice using a previously described method. 23 Skin graft survival was monitored daily up to 100 days. Graft rejection is characterized by more than 90% necrosis of the donor skin tissues. Haematoxylin and eosin (H&E) staining was performed on paraffin sections of skin grafts.
Flow cytometric analysis
Fluorochrome‐conjugated antibodies specific for mouse CD3 (clone 17A2), CD8 (53‐6.7), CD62L (MEL‐14), CD44 (IM7), CD154 (SA047C3), CD45 (30‐F11), CD45.2 (104), TCR‐β (H57‐597), CD127 (A7R34), KLRG1 (2F1/KLRG1), CX3CR1 (SA011F11), NK1.1 (PK136), PD‐1 (29F.1A12), TIM‐3 (RMT3‐23), LAG‐3 (C9B7 W), IL‐2 (JES6‐5H4), IFN‐γ (XMG1.2), TNF‐α (MP6‐XT22), granzyme A (3G8.5), granzyme B (QA16A02), Ki67 (16A8) and T‐bet (4B10) were purchased from BioLegend. Goat anti‐rabbit IgG (Catalog A‐21244) and fluorochrome‐conjugated antibodies specific for CD69 (H1.2F3), Nur77 (12.14), Helios (22F6), ID2 (ILCID2) and EOMES (Dan11mag) were purchased from Thermo Fisher. Fluorochrome‐conjugated antibody specific for TCF1 (C63D9) and purified antibody specific for IRF4 (D9P5H) were purchased from Cell Signaling Technology.
In brief, CD8+ T cells from cell cultures or transplant recipients were stained with the above antibodies and analysed on an LSR II or Fortessa flow cytometer (BD Biosciences) by using a previously described method. 21 Dead cells were excluded from the analysis by using the Zombie Aqua Fixable Viability Kit (BioLegend). For intracellular staining of cytokines, cultured or ex vivo‐isolated T cells were restimulated for 4 h with 50 ng/ml phorbol 12‐myristate 13‐acetate (Sigma‐Aldrich) and 500 ng/ml ionomycin (Sigma‐Aldrich) in the presence of GolgiStop (BD Biosciences). Intracellular expression of transcription factors, cytokines and cytotoxic molecules was determined by using the Foxp3/Transcription Factor Staining Buffer Set (Thermo Fisher Scientific) or the Cytofix/Cytoperm solution (BD Biosciences) as previously described. 21 The data were processed by using the FlowJo v10 software (Tree Star, Inc.).
Statistical analysis
Data were represented as mean ± SD and analysed with Prism version 8 (GraphPad Software). The p values of skin graft survival were determined by the Mann–Whitney test. Other measurements were performed using unpaired Student's t‐test. Differences were considered significant when p < 0.05.
RESULTS
IRF4 expression in WT CD8+ T cells is positively correlated with the production of effector molecules
To determine IRF4 expression levels in WT CD8+ T cells in response to in vitro stimulation, splenocytes from WT B6 mice were stimulated with 2 µg/ml soluble anti‐CD3e mAb for 24 h, followed by flow cytometric analysis (Figure 1A). All plots are gated on living CD8+ T cells. Representative plots in Figure 1B show the IRF4 expression levels in CD127+KLRG1−, CD127−KLRG1− and CD127−KLRG1+ CD8+ T‐cell subsets. Compared with CD127+KLRG1− and CD127−KLRG1− CD8+ T cells, CD127−KLRG1+ CD8+ T cells expressed the highest level of IRF4 (Figure 1B,C).
FIGURE 1.

IRF4 expression in WT CD8+ T cells is positively correlated with the production of effector molecules. Splenocytes from WT B6 mice were stimulated with 2 µg/ml soluble anti‐CD3e mAb for 24 h, followed by flow cytometric analysis. All contour plots were gated on living CD8+ T cells. (A) Schematic of the experimental design. (B,C) Representative contour plots and bar graphs display the IRF4 expression of CD127+KLRG1−, CD127−KLRG1− and CD127−KLRG1+ CD8+ T‐cell subsets. (D,E) Representative contour plots and bar graphs show the expression of IFN‐γ and granzyme B in CD8+ T‐cell subpopulations that express high, medium or low levels of IRF4. Data are mean ± SD (n = 5). **p < 0.01, ****p < 0.0001 (unpaired Student's t‐test)
Figure 1D shows the representative plots for detecting IFN‐γ and granzyme B production in IRF4high, IRF4medium and IRF4low CD8+ T‐cell subpopulations. IRF4low CD8+ T cells barely produced IFN‐γ and granzyme B. Compared with IRF4medium and IRF4low CD8+ T cells, IRF4high CD8+ T cells produced significantly higher levels of both IFN‐γ and granzyme B (Figure 1D,E). Hence, CD127−KLRG1+ CD8+ T cells overexpress IRF4, and IRF4 expression is positively correlated with the production of effector molecules.
Irf4‐deficient CD8+ T cells are able to respond to allogeneic APC stimulation
The role of IRF4 in regulating allogeneic CD8+ T‐cell response remains unknown. To address this issue, we first determined whether IRF4 deletion in naïve CD8+ T cells (isolated from Irf4 fl/fl Cd4‐Cre mice) affects their ability to recognize and respond to alloantigens in vitro. Of note, IRF4 deletion using the Irf4 fl/fl Cd4‐Cre system may not only directly affect CD8+ T‐cell response to alloantigens, but also potentially affects allogeneic T‐cell repertoire due to IRF4 deletion during T‐cell development in the thymus. In brief, we performed a mixed leucocyte reaction (MLR) assay, in which Irf4‐deficient (from Irf4 fl/fl Cd4‐Cre mice) or control (from Irf4 fl/fl mice) CD8+ T cells were stimulated by T‐cell‐depleted BALB/c or B6 splenocytes for 72 h. The deletion of IRF4 in CD8+ T cells from Irf4 fl/fl Cd4‐Cre mice was confirmed by flow cytometric analysis (Figure S1). As shown in Figure 2, both Irf4‐deficient and Irf4 fl/fl control CD8+ T cells barely responded to syngeneic B6 APC stimulation, and displayed CD62L+CD44−, CD69− and Nur77−Ki67− phenotypes. Both Irf4‐deficient and Irf4 fl/fl control CD8+ T cells responded to allogeneic BALB/c stimulators. Addition of IL‐2 in cultures significantly enhanced the % CD62L−CD44+ cells in Irf4‐deficient CD8+ T cells (Figure 2A,B). However, compared with Irf4 fl/fl control CD8+ T cells, Irf4‐deficient CD8+ T cells showed significantly lower percentages of CD62L−CD44+, CD69+ and Nur77+Ki67+ cells (Figure 2A‐F). Taken together, Irf4‐deficient CD8+ T cells respond to allogeneic BALB/c stimulators, but display an impaired ability.
FIGURE 2.
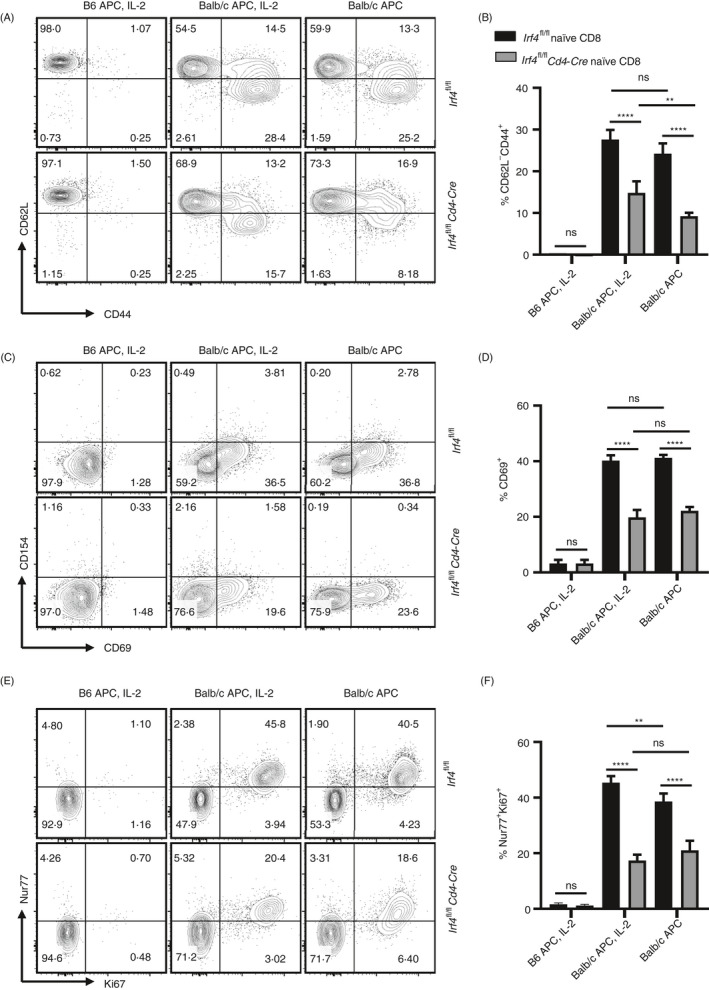
Irf4‐deficient CD8+ T cells are capable of recognizing BALB/c alloantigens. Irf4‐deficient or control CD8+ T cells were stimulated by B6 or BALB/c APCs for 72 h, supplemented with or without murine IL‐2. All contour plots were gated on the living CD8+ T cells. (A,B) % CD62L−CD44+ cells among the living CD8+ T cells in response to B6 or BALB/c stimulators. (C,D) % CD69+ cells among the living CD8+ T cells in response to B6 or BALB/c stimulators. (E,F) % Nur77+Ki67+ cells among the living CD8+ T cells in response to B6 or BALB/c stimulators. Data are mean ± SD (n = 5). ns, no significance; **p < 0.01, ****p < 0.0001 (unpaired Student's t‐test). APC, antigen‐presenting cell
IRF4 deficiency in CD8+ T cells abrogates their antigraft function
To determine the role of IRF4 in allogeneic CD8+ T‐cell response, B6.Rag1−/− recipients were adoptively transferred with either Irf4‐deficient CD8+ T cells isolated from Irf4 fl/fl Cd4‐Cre mice, or control CD8+ T cells obtained from Irf4 fl/fl mice. One day later, B6.Rag1−/− recipients were transplanted with fully MHC‐mismatched skin allografts from BALB/c donors (Figure 3A). B6.Rag1−/− recipients that received the control CD8+ T cells acutely rejected the transplanted BALB/c skins (mean survival time [MST] =14.2 ± 1.2 days; n = 5). By contrast, all B6.Rag1−/− recipients that received the Irf4‐deficient CD8+ T cells permanently accepted the BALB/c skin allografts (MST >100 days; n = 5) (Figure 3B). Figure 3C shows a rejected skin graft on a recipient that received control CD8+ T cells (left image), and accepted skin grafts on recipients that received Irf4‐deficient CD8+ T cells (middle and right images) at indicated days post‐skin grafting. The accepted grafts are intact with no signs of rejection. Therefore, IRF4 deletion in CD8+ T cells abrogates their function in rejecting skin allografts.
FIGURE 3.

IRF4 deletion in CD8+ T cells abrogates their function in rejecting skin allografts. Lymphopenic B6.Rag1−/− recipients were adoptively transferred with either 5 × 10⁵ Irf4‐deficient CD8+ T cells isolated from Irf4 fl/fl Cd4‐Cre mice, or 5 × 10⁵ control CD8+ T cells obtained from Irf4 fl/fl mice. One day later, B6.Rag1−/− recipients were transplanted with fully MHC‐mismatched skin allografts from BALB/c donors. (A) Schematic of the experimental design. Tx, transplantation. (B) The percentage of graft survival post‐allogeneic tail skin transplantation (n = 5). **p < 0.01; Mann–Whitney test. (C) Representative images of a rejected skin graft on a recipient that received control CD8+ T cells (left image), and accepted skin grafts on recipients that received Irf4‐deficient CD8+ T cells (middle and right images) at indicated days post‐skin grafting
Irf4‐deficient CD8+ T cells fail to differentiate into terminal effector cells in transplant recipients
To investigate the mechanism by which Irf4‐deficient CD8+ T cells fail to mediate allograft rejection, B6.Rag1−/− recipients were adoptively transferred with either Irf4‐deficient (Irf4 fl/fl Cd4‐Cre) or control (Irf4 fl/fl) CD8+ T cells, followed by BALB/c skin transplantation. Adoptively transferred CD8+ T cells in spleens and draining lymph nodes (DLNs) were analysed at day 14 post‐skin grafting. Figure S2a shows the gating strategy for detecting the transferred CD8+ T cells. The transferred control, but not Irf4‐deficient, CD8+ T cells were capable of developing into CD127−KLRG1+ terminal effector cells in transplant recipients. Indeed, most transferred Irf4‐deficient CD8+ T cells maintained a CD127+KLRG1− memory precursor‐like phenotype (Figure 4A,B). Moreover, CX3CR1 correlates with the degree of effector CD8+ T‐cell differentiation. 24 We found that the transferred Irf4‐deficient CD8+ T cells barely differentiated into CD62L−CX3CR1+ cells when compared to those of control CD8+ T cells (Figure 4C,D). Inhibitory receptors are transiently expressed on functional effector T cells. 25 , 26 We found that Irf4‐deficient CD8+ T cells barely expressed inhibitory receptors PD‐1, TIM‐3 and LAG‐3 when compared to those of control CD8+ T cells (Figure S2b‐e). Taken together, IRF4 deficiency in CD8+ T cells abrogates their terminal effector differentiation in transplant recipients.
FIGURE 4.

IRF4 deletion in CD8+ T cells completely abolishes their terminal effector differentiation in transplant recipients. B6.Rag1−/− recipients were adoptively transferred with either Irf4‐deficient (Irf4 fl/fl Cd4‐Cre) or control (Irf4 fl/fl) CD8+ T cells, followed by BALB/c skin transplantation. Adoptively transferred CD8+ T cells in spleens and DLNs were analysed at day 14 post‐skin grafting. All contour plots were gated on the living transferred CD8+ T cells. (A,B) Representative contour plots and bar graph display the % CD127−KLRG1+ terminal effector cells among the transferred CD8+ T cells. (C,D), Representative contour plots and bar graph display the % CD62L−CX3CR1+ effector cells among the transferred CD8+ T cells. Data are mean ± SD (n = 3). ****p < 0.0001 (unpaired Student's t‐test)
Irf4‐deficient CD8+ T cells barely produce proinflammatory cytokines and cytotoxic molecules in transplant recipients
To further investigate the mechanism by which Irf4‐deficient CD8+ T cells fail to mediate allograft rejection, we analysed the production of effector molecules by the adoptively transferred Irf4‐deficient and control CD8+ T cells in B6.Rag1−/− recipients at day 14 post‐BALB/c skin grafting. Compared with the transferred control CD8+ T cells in spleens and DLNs, the transferred Irf4‐deficient CD8+ T cells produced significantly diminished levels of effector cytokines, including IL‐2, IFN‐γ and TNF‐α (Figure 5A,B,E,F). In addition, Irf4‐deficient CD8+ T cells produced significantly lower levels of granzyme A and granzyme B than those of the control CD8+ T cells (Figure 5C‐F). Hence, Irf4‐deficient CD 8+ T cells lose the ability to produce effector molecules in transplant recipients.
FIGURE 5.

Irf4‐deficient CD8+ T cells barely produce proinflammatory cytokines and cytotoxic molecules in transplant recipients. At day 14 post‐BALB/c skin grafting, the adoptively transferred Irf4‐deficient and control CD8+ T cells in B6.Rag1−/− recipients were analysed. All contour plots were gated on the living transferred CD8+ T cells. (A,B) % IFN‐γ+ TNF‐α+ cells among the transferred CD8+ T cells in spleens and DLNs. (C,D) Percentage of granzyme B+ cells among the transferred CD8+ T cells in spleens and DLNs. (E,F) % IL‐2+ and % granzyme A+ cells among the transferred CD8+ T cells. Data are mean ± SD (n = 3). *p < 0.05; **p < 0.01, ***p < 0.001; ****p < 0.0001 (unpaired Student's t‐test)
Irf4‐deficient CD8+ T cells exhibit a lower frequency and reduced Ki67 expression in transplant recipients
We further analysed the proliferative capacity of the adoptively transferred Irf4‐deficient and control CD8+ T cells in B6.Rag1−/− recipients at day 14 post‐BALB/c skin grafting. As shown in Figure 6A,B, the frequency of the transferred control CD8+ T cells in spleens of transplant recipients is ~10 times higher than that of transferred Irf4‐deficient CD8+ T cells (Figure 6A,B). In consistence with their lower frequency in spleens, the transferred Irf4‐deficient CD8+ T cells expressed significantly lower level of the proliferation marker Ki67 when compared to that of the transferred control CD8+ T cells (Figure 6C,D). Hence, Irf4‐deficient CD8+ T cells exhibit a lower frequency and reduced Ki67 expression in transplant recipients.
FIGURE 6.

Irf4‐deficient CD8+ T cells exhibit low frequency and low Ki67 expression in transplant recipients. At day 14 post‐BALB/c skin grafting, the adoptively transferred Irf4‐deficient and control CD8+ T cells in B6.Rag1−/− recipients were analysed. All contour plots and overlay histograms were gated on the living transferred CD8+ T cells in spleens. (A,B) Representative plots and bar graph display the percentage of the transferred CD8+ T cells among CD45+ immune cells. (C‐D) Representative plots and bar graphs display MFI Ki67 among the transferred CD8+ T cells. Data are mean ± SD (n = 3). **p < 0.01 (unpaired Student's t‐test)
IRF4 deficiency in CD8+ T cells affects the expression of key transcription factors that control terminal effector differentiation
Decision of CD8+ T‐cell effector fate is delicately orchestrated by several key transcriptional factors, such as TCF1, ID2, T‐bet and EOMES. We thus analysed the expression of these transcription factors in the adoptively transferred Irf4‐deficient and control CD8+ T cells in B6.Rag1−/− recipients at day 14 post‐BALB/c skin grafting. Compared with the control CD8+ T cells in spleens, the expression levels of T‐bet and ID2 are significantly decreased in Irf4‐deficient CD8+ T cells (Figure 7A‐D). By contrast, the expression levels of TCF1 and EOMES are significantly higher in Irf4‐deficient CD8+ T cells than those of the control CD8+ T cells (Figure 7E‐H). Therefore, IRF4 deficiency affects the expression of key transcription factors that regulates terminal effector differentiation of CD8+ T cells.
FIGURE 7.

IRF4 deficiency in CD8+ T cells affects the expression of key transcription factors that control terminal effector differentiation. At day 14 post‐BALB/c skin grafting, the adoptively transferred Irf4‐deficient and control CD8+ T cells in B6.Rag1−/− recipients were analysed. All overlay histograms and contour plots were gated on the living transferred CD8+ T cells in spleens. Representative overlay histograms and bar graphs show T‐bet (A,B) and ID2 (C,D) expression levels of the transferred CD8+ T cells. Representative contour plots and bar graphs show % TCF1+ (E,F) and % EOMES+ (G,H) cells among the transferred CD8+ T cells. Data are mean ± SD (n = 3). *p < 0.05; **p < 0.01, ***p < 0.001; (unpaired Student's t‐test)
Naïve Irf4‐deficient CD8+ T cells barely differentiate into terminal effector cells and fail to reject skin allografts
CD44hi‐activated T cells are prone to apoptosis. 27 The preferential deletion of CD44hi T cells may interfere the assessment of effector differentiation of remaining T cells. Therefore, here we investigated the antigraft response of CD44low naïve Irf4‐deficient CD8+ T cells. CD44low naïve Irf4‐deficient or control CD8+ T cells were adoptively transferred into B6.Rag1−/− recipients, followed by BALB/c skin transplantation. B6.Rag1−/− hosts without transplantation were used as additional groups, which can determine whether or not the Irf4‐deficient CD8+ T cells have a defect in surviving after adoptive transfer (Figure 8A). Figure 8B shows the purified CD44low naïve CD8 T cells prior to cell transfer. As shown in Figure 8C, recipients that received naïve control CD8+ T cells rejected all allografts within 16 days (MST = 15.0 ± 0.89 days; n = 6), whereas recipients that received naïve Irf4‐deficient CD8+ T cells accepted the allografts (MST >60 days; n = 6). Figure 8D shows the representative H&E images of allografts at day 14 post‐skin grafting. Skin grafts from the control T‐cell group displayed massive infiltrating cells and damaged skin structures. By contrast, skin grafts from the Irf4‐deficient T‐cell group displayed minimal infiltrating cells, as well as intact epidermis, hair follicles and sebaceous glands.
FIGURE 8.

Naïve Irf4‐deficient CD8+ T cells barely differentiate into terminal effector cells and fail to reject skin allografts. B6.Rag1−/− recipients were adoptively transferred with naïve Irf4‐deficient or control CD8+ T cells, and transplanted with BALB/c tail skins or left without transplantation. (A) Schematic of the experimental design. (B) Representative contour plots display the purified CD44low naïve CD8 T cells prior to adoptive transfer. (C) The percentage of graft survival post‐transplantation (n = 6). ***p < 0.001; Mann–Whitney test. (D) Representative H&E staining images (×200) of the skin grafts on recipients that received naïve control (left image) or naïve Irf4‐deficient (right image) CD8+ T cells at day 14 post‐grafting. (E,F) Representative contour plots and graphs show % CD8+ cells among CD45.2+ immune cells, and the absolute number of CD8+ cells in spleens on day 14 post‐grafting. (G,H) Representative contour plots and the graph display % CD127−KLRG1+ cells among the transferred CD8+ T cells. Data are mean ± SD (n = 4). ns, no significance; *p < 0.05; ***p < 0.001; ****p< 0.0001 (unpaired Student's t‐test). Tx, transplantation
Splenocytes were analysed on day 14. In mice that did not receive skin grafts, the percentage of CD8+ T cells in CD45.2+ cells was higher in the control T‐cell group than that in the Irf4‐deficient T‐cell group, but the absolute numbers of CD8+ T cells were not significantly different between these two groups. In skin‐transplanted recipients, CD8+ T‐cell frequency and number were significantly higher in the control T‐cell group than those in the Irf4‐deficient T‐cell group (Figure 8E,F). Moreover, naïve Irf4‐deficient CD8+ T cells barely differentiated into CD127−KLRG1+, CD62L−CX3CR1+ and IFN‐γ+TNF‐α+ cells (Figures 8G,H and S3a‐d). Therefore, naïve Irf4‐deficient CD8+ T cells barely differentiate into terminal effector cells and fail to reject skin allografts.
Irf4‐deficient CD8+ T cells fail to acquire terminal effector phenotypes in recipients with long‐term accepted allografts
Defining the long‐term fate of Irf4‐deficient CD8+ T cells in transplant recipients is critical for understanding the mechanism underlying transplant acceptance. To this end, B6.Rag1−/− recipients were adoptively transferred with either Irf4‐deficient or control CD8+ T cells, and transplanted with BALB/c skins. All skin allografts were rejected in the control T‐cell group but were accepted in the Irf4‐deficient T‐cell group. Adoptively transferred CD8+ T cells in spleens were analysed by flow cytometry at day 100 post‐grafting. Figure 9A shows the representative plots for detecting the frequency of Irf4‐deficient or control CD8+ T cells in CD45.2+ immune cells (Figure 9A). While the % CD8+ in CD45.2+ cells were not significantly different between two groups, the absolute number of Irf4‐deficient CD8+ T cells was significantly lower than that of control CD8+ T cells (Figure 9B). Irf4‐deficient CD8+ T cells barely expressed PD‐1 (Figure S4c,d) and failed to differentiate into CD127−KLRG1+ terminal effector cells (Figure 9C,D). The majority of the control CD8+ T cells lost CD62L expression, and became CD62L−CD44+ and CD62L− CX3CR1+ cells. Irf4‐deficient CD8+ T cells maintained CD62L expression, and exhibited CD62L+CD44+ and CD62L+ CX3CR1− cell phenotypes (Figures 9E,F and S4a,b). The percentages of IFN‐γ‐, IL‐2‐ and granzyme A‐expressing cells in Irf4‐deficient CD8+ T cells were significantly lower than those of control CD8+ T cells (Figures 9G,H and S4e,f). By contrast, Irf4‐deficient CD8+ T cells expressed significantly higher levels of TCF1 and EOMES than those of control CD8+ T cells (Figure 9I,J). Therefore, IRF4 deficiency in CD8+ T cells leads to long‐term defect of effector function, which correlates with allograft acceptance.
FIGURE 9.

Irf4‐deficient CD8+ T cells fail to acquire terminal effector phenotypes in recipients with long‐term accepted allografts. B6.Rag1−/− recipients were adoptively transferred with either Irf4‐deficient or control CD8+ T cells, followed by BALB/c skin transplantation. Adoptively transferred CD8+ T cells in spleens were analysed by flow cytometry at day 100 post‐skin grafting. (A,B) Representative contour plots and bar graphs show % CD8+ T cells among CD45.2+ immune cells (A,B left bar graph), and absolute CD8+ T cells in spleens (B right bar graph). (C‐J) Contour plots were gated on the living transferred CD8+ T cells in spleens. Representative contour plots and bar graphs show % CD127−KLRG1+ (C,D), CD62L−CX3CR1+ (E,F), IFN‐γ+ (G,H), TCF1+ (I,J left bar graph) and EOMES+ (i,j right bar graph) cells among the adoptively transferred CD8+ T cells. Data are mean ± SD of n ≥ 3 animals per group. ns, no significance; *p < 0.05; **p < 0.01; ****p < 0.0001 (unpaired Student's t‐test)
DISCUSSION
Little is known about the transcriptional programmes that drive the effector differentiation of CD8+ T cells in response to transplant. 28 Here, we found that ablation of IRF4 in CD8+ T cells abrogated their function to reject skin allografts. Further mechanistic investigation in the setting of transplantation revealed that IRF4 deletion in CD8+ T cells impaired the production of proinflammatory cytokines and cytotoxic molecules, reduced proliferative capacity and completely abolished their differentiation into CD127−KLRG1+ terminal effector cells. Therefore, IRF4 deletion in CD8+ T cells abrogates their ability to reject skin allografts, which correlates with diminished effector differentiation.
Man et al. have shown that upon chronic LCMV Cl‐13 infection, Irf4 +/− P14 cells exhibit lower expression of inhibitor receptors (e.g. PD‐1 and TIM‐3) and higher expression of naïve/memory markers (e.g. TCF1, CD62L, and IL‐7R) when compared to WT P14 cells. Of note, although lowering IRF4 (Irf4 +/−) may prevent the exhaustion of P14 cells, it does not improve LCMV clearance. 19 Here, our results indicated that adoptive transfer of Irf4‐deficient CD8+ T cells did not mediate skin transplant rejection in B6.Rag1−/− mice. There are multiple differences between the LCMV Cl‐13 infection model and our transplantation model. For example, B6.Rag1−/− mice (without CD4+ T cells) were used as transplant recipients, whereas WT mice (with CD4+ T cells) were used for LCMV infection. The absence and presence of CD4 T‐cell help may differently impact CD8+ T‐cell response. Moreover, Irf4‐deficient CD8+ T cells may behave differently than Irf4 +/− CD8+ T cells. Indeed, Nayar et al. showed that upon acute LCMV‐Armstrong infection, both WT and Irf4 +/fl mice have cleared the virus, but 70% of Irf4‐deficient mice failed to clear the virus due to functional defect of Irf4‐deficient CD8+ T cells. 29
In infection models, TCF1 has been shown to restrain CD8+ T‐cell effector differentiation. Virus‐specific Tcf7‐deficient CD8+ T cells show elevated effector differentiation in acute infection. 5 By contrast, T‐bet and ID2 promote CD8+ T‐cell effector differentiation and function. Deletion of T‐bet or ID2 in CD8+ T cells impairs the generation of KLRG1high effector cells and sequentially fails to eliminate the infections. 30 , 31 , 32 , 33 Interestingly, IRF4 promotes the expression of ID2, T‐bet and Blimp‐1 during CD8+ T‐cell effector differentiation. 17 , 20 T‐bet activates IFN‐γ expression in T cells, and IFN‐γ further up‐regulates T‐bet expression. This establishes a self‐amplifying feed‐forward loop to sustain T‐bet expression. 34 In Irf4‐deficient CD8+ T cells, it has been shown that binding of T‐bet to Ifng promoter is impaired, 17 which may disrupt the feed‐forward loop and thus reduces T‐bet expression. This is one of the possible explanations how IRF4 affects T‐bet expression. Here, in the setting of transplantation, Irf4‐deficient CD8+ T cells failed to develop into CD127−KLRG1+ terminal effector cells, accompanied by diminished expression of T‐bet and ID2 and increased expression of TCF1. Hence, the interplay between IRF4 and these transcription factors co‐ordinately regulate transcriptional programmes for CD8+ T‐cell effector differentiation.
We found previously that all heart allografts survive indefinitely in Irf4 fl/fl Cd4‐Cre mice, in which IRF4 is selectively deleted in T cells. 21 Heart‐transplanted Irf4 fl/fl Cd4‐Cre recipients further accept the donor‐specific but not third‐party secondary skin allografts, indicating that donor‐specific transplant tolerance is achieved. 22 Mechanistically, Irf4‐deficient CD4+ T cells express elevated levels of Helios (IKAROS family zinc finger 2, encoded by Ikzf2) and PD‐1, and undergo differentiation to a dysfunctional fate in response to transplant. 21 In the present study, we found that Irf4‐deficient CD8+ T cells also lost ability to mediate allograft rejection. However, both control and Irf4‐deficient CD8+ T cells did not express Helios in transplant recipients (Figure 5C). Although Irf4‐deficient CD8+ T cells highly expressed one of the exhaustion drivers EOMES (Figure 6G,H), 35 control but not Irf4‐deficient CD8+ T cells expressed high levels of inhibitory receptors, including PD‐1, TIM‐3 and LAG‐3 (Figure S2). In consistent with these data, Irf4 +/− CD8+ T cells with reduced IRF4 expression also exhibit impaired expression of inhibitory receptors in response to chronic infection. 19 , 36 Therefore, in the setting of transplantation, Irf4‐deficient CD8+ T cells fail to differentiate into effector cells rather than commit to an exhaustive fate.
In summary, IRF4 in T cells is the key transcriptional determinant that governs transplant immunity. Ablation of IRF4 in T cells establishes donor‐specific transplant tolerance. Indeed, ablation of IRF4 not only drives allogeneic CD4+ T‐cell dysfunction, but also abrogates CD8+ T‐cell effector differentiation. Targeting IRF4 represents a potential therapeutic strategy for treatment of transplant rejection.
AUTHOR CONTRIBUTION
Dawei Zou, Zhiyong Guo and Wenhao Chen designed the research and wrote the manuscript. Dawei Zou and Jinfei Fu performed the experiments and analysed the data. All authors approved the manuscript.
CONFLICT OF INTEREST
The authors have no conflicts of interest to disclose.
Supporting information
Figure S1. IRF4 is deleted in CD8+ T cells isolated from Irf4fl/flCd4‐Cre mice. PBMCs from either Irf4fl/flCd4‐Cre or Irf4fl/fl control mice were stimulated with 2 µg/ml soluble anti‐CD3e for 24 hours in vitro, followed by flow cytometric analysis. Representative plots were gated on living CD8+ T cells. Representative contour plots (A) and bar graph (B) show the IRF4 expression in CD8+ T cells. Data are mean ± SD (n = 5). **P < 0.01 (unpaired student's t‐test).
Figure S2. Irf4‐deficient CD8+ T cells barely express inhibitory receptors in transplant recipients. B6.Rag1‐/‐ recipients were adoptively transferred with either Irf4‐deficient (Irf4fl/flCd4‐Cre) or control (Irf4fl/fl) CD8+ T cells, followed by Balb/c skin transplantation. Adoptively transferred CD8+ T cells in spleens were analyzed at day 14 post‐skin grafting. Representative plots and overlay histograms were gated on the living transferred CD8+ T cells. (A) Gating strategy for detecting the living transferred CD8+ T cells. (B,C) Representative plots and bar graphs display % PD‐1+ and %TIM‐3+ cells among CD8+ T cells. (D,E) Representative overlay histogram and bar graph display the expression levels of LAG‐3 on CD8+ T cells. Data are mean ± SD (n = 3). **P < 0.01, ***P < 0.001, ****P < 0.0001 (unpaired student's t‐test).
Figure S3. Naïve Irf4-deficient CD8+ T cells barely differentiate into terminal effector cells. B6.Rag1‐/‐ recipients were adoptively transferred with naïve Irf4‐deficient or control CD8+ T cells, and transplanted with Balb/c tail skins. All representative plots were gated on living CD8+ T cells. Representative contour plots and bar graphs show % CD62L‐CX3CR1+ (A,B), and IFN‐γ+TNF‐α+ (C,D) cells among the transferred CD8+ T cells. Data are mean ± SD (n = 4). **P < 0.01; ****P < 0.0001 (unpaired student's t‐test).
Figure S4. Irf4‐deficient CD8+ T cells fail to acquire terminal effector phenotypes in recipients with long‐term accepted allografts. B6.Rag1‐/‐ recipients were adoptively transferred with either Irf4‐deficient or control CD8+ T cells, followed by Balb/c skin transplantation. Adoptively transferred CD8+ T cells in spleens were analyzed by flow cytometry at day 100 post‐skin grafting. Representative plots were gated on living CD8+ T cells. Representative contour plots and bar graphs show % CD62L‐CX3CR1+ (A,B), PD‐1+ (C,D), IL‐2+ (E,F left bar graph), and Granzyme A+ (E,F right bar graph) cells among the living CD8+ T cells. Data are mean ± SD of n ≥ 3 animals per group. *P < 0.05; **P < 0.01 (unpaired student's t‐test).
ACKNOWLEDGEMENTS
This study was supported by the startup funding and the Career Cornerstone Award from Houston Methodist Research Institute (to W.C.). The authors would like to thank the Houston Methodist Flow Cytometry Core Facility for excellent services.
Contributor Information
Zhiyong Guo, Email: rockyucsf1981@126.com, Email: wchen@houstonmethodist.org.
Wenhao Chen, Email: wchen@houstonmethodist.org.
DATA AVAILABILITY STATEMENT
Data are available on request from the authors.
REFERENCES
- 1. Rocha PN, Plumb TJ, Crowley SD, Coffman TM. Effector mechanisms in transplant rejection. Immunol Rev. 2003;196:51–64. [DOI] [PubMed] [Google Scholar]
- 2. Halamay KE, Kirkman RL, Sun L, Yamada A, Fragoso RC, Shimizu K, et al. CD8 T cells are sufficient to mediate allorecognition and allograft rejection. Cell Immunol. 2002;216:6–14. [DOI] [PubMed] [Google Scholar]
- 3. Diamond AS, Gill RG. An essential contribution by IFN‐gamma to CD8+ T cell‐mediated rejection of pancreatic islet allografts. J Immunol. 2000;165:247–55. [DOI] [PubMed] [Google Scholar]
- 4. Yap M, Brouard S, Pecqueur C, Degauque N. Targeting CD8 T‐cell metabolism in transplantation. Front Immunol. 2015;6:547. [DOI] [PMC free article] [PubMed] [Google Scholar]
- 5. Tiemessen MM, Baert MR, Kok L, van Eggermond MC, van den Elsen PJ, Arens R, et al. T Cell factor 1 represses CD8+ effector T cell formation and function. J Immunol. 2014;193:5480–7. [DOI] [PubMed] [Google Scholar]
- 6. Hamilton SE, Jameson SC. Effective effector generation of CD8+ T cells and NK cells: a need for T‐bet and ZEB‐too. J Exp Med. 2015;212:1990. [DOI] [PMC free article] [PubMed] [Google Scholar]
- 7. Dominguez CX, Amezquita RA, Guan T, Marshall HD, Joshi NS, Kleinstein SH, et al. The transcription factors ZEB2 and T‐bet cooperate to program cytotoxic T cell terminal differentiation in response to LCMV viral infection. J Exp Med. 2015;212:2041–56. [DOI] [PMC free article] [PubMed] [Google Scholar]
- 8. Omilusik KD, Best JA, Yu B, Goossens S, Weidemann A, Nguyen JV, et al. Transcriptional repressor ZEB2 promotes terminal differentiation of CD8+ effector and memory T cell populations during infection. J Exp Med. 2015;212:2027–39. [DOI] [PMC free article] [PubMed] [Google Scholar]
- 9. Omilusik KD, Nadjsombati MS, Shaw LA, Yu B, Milner JJ, Goldrath AW. Sustained Id2 regulation of E proteins is required for terminal differentiation of effector CD8(+) T cells. J Exp Med. 2018;215:773–83. [DOI] [PMC free article] [PubMed] [Google Scholar]
- 10. Man K, Kallies A. Synchronizing transcriptional control of T cell metabolism and function. Nat Rev Immunol. 2015;15:574–84. [DOI] [PubMed] [Google Scholar]
- 11. Mahnke J, Schumacher V, Ahrens S, Kading N, Feldhoff LM, Huber M, et al. Interferon regulatory factor 4 controls TH1 cell effector function and metabolism. Sci Rep. 2016;6:35521. [DOI] [PMC free article] [PubMed] [Google Scholar]
- 12. Bollig N, Brustle A, Kellner K, Ackermann W, Abass E, Raifer H, et al. Transcription factor IRF4 determines germinal center formation through follicular T‐helper cell differentiation. Proc Natl Acad Sci USA. 2012;109:8664–9. [DOI] [PMC free article] [PubMed] [Google Scholar]
- 13. Zheng Y, Chaudhry A, Kas A, deRoos P, Kim JM, Chu TT, et al. Regulatory T‐cell suppressor program co‐opts transcription factor IRF4 to control T(H)2 responses. Nature 2009;458:351–6. [DOI] [PMC free article] [PubMed] [Google Scholar]
- 14. Staudt V, Bothur E, Klein M, Lingnau K, Reuter S, Grebe N, et al. Interferon‐regulatory factor 4 is essential for the developmental program of T helper 9 cells. Immunity 2010;33:192–202. [DOI] [PubMed] [Google Scholar]
- 15. Brustle A, Heink S, Huber M, Rosenplanter C, Stadelmann C, Yu P, et al. The development of inflammatory T(H)‐17 cells requires interferon‐regulatory factor 4. Nat immunol. 2007;8:958–66. [DOI] [PubMed] [Google Scholar]
- 16. Man K, Miasari M, Shi W, Xin A, Henstridge DC, Preston S, et al. The transcription factor IRF4 is essential for TCR affinity‐mediated metabolic programming and clonal expansion of T cells. Nat immunol. 2013;14:1155–65. [DOI] [PubMed] [Google Scholar]
- 17. Yao S, Buzo BF, Pham D, Jiang L, Taparowsky EJ, Kaplan MH, et al. Interferon regulatory factor 4 sustains CD8(+) T cell expansion and effector differentiation. Immunity 2013;39:833–45. [DOI] [PMC free article] [PubMed] [Google Scholar]
- 18. Campos Carrascosa L, Klein M, Kitagawa Y, Luckel C, Marini F, Konig A, et al. Reciprocal regulation of the Il9 locus by counteracting activities of transcription factors IRF1 and IRF4. Nat Commun. 2017;8:15366. [DOI] [PMC free article] [PubMed] [Google Scholar]
- 19. Man K, Gabriel SS, Liao Y, Gloury R, Preston S, Henstridge DC, et al. Transcription factor IRF4 promotes CD8(+) T cell exhaustion and limits the development of memory‐like T cells during chronic infection. Immunity 2017;47:1129–41.e5. [DOI] [PubMed] [Google Scholar]
- 20. Raczkowski F, Ritter J, Heesch K, Schumacher V, Guralnik A, Hocker L, et al. The transcription factor Interferon Regulatory Factor 4 is required for the generation of protective effector CD8+ T cells. Proc Natl Acad Sci USA. 2013;110:15019–24. [DOI] [PMC free article] [PubMed] [Google Scholar]
- 21. Wu J, Zhang H, Shi X, Xiao X, Fan Y, Minze LJ, et al. Ablation of transcription factor IRF4 promotes transplant acceptance by driving allogenic CD4(+) T cell dysfunction. Immunity 2017;47:1114–28.e6. [DOI] [PMC free article] [PubMed] [Google Scholar]
- 22. Zhang H, Wu J, Zou D, Xiao X, Yan H, Li XC, et al. Ablation of interferon regulatory factor 4 in T cells induces "memory" of transplant tolerance that is irreversible by immune checkpoint blockade. Am J Transplant. 2019;19:884–93. [DOI] [PMC free article] [PubMed] [Google Scholar]
- 23. Zou D, Dai Y, Zhang X, Wang G, Xiao X, Jia P, et al. T cell exhaustion is associated with antigen abundance and promotes transplant acceptance. Am J Transplant. 2020;20:2540–50 [DOI] [PMC free article] [PubMed] [Google Scholar]
- 24. Gerlach C, Moseman EA, Loughhead SM, Alvarez D, Zwijnenburg AJ, Waanders L, et al. The chemokine receptor CX3CR1 defines three antigen‐experienced CD8 T cell subsets with distinct roles in immune surveillance and homeostasis. Immunity 2016;45:1270–84. [DOI] [PMC free article] [PubMed] [Google Scholar]
- 25. Vigano S, Bobisse S, Coukos G, Perreau M, Harari A. Cancer and HIV‐1 infection: patterns of chronic antigen exposure. Front Immunol. 2020;11:1350. [DOI] [PMC free article] [PubMed] [Google Scholar]
- 26. Naran K, Nundalall T, Chetty S, Barth S. Principles of immunotherapy: implications for treatment strategies in cancer and infectious diseases. Front Microbiol. 2018;9:3158. [DOI] [PMC free article] [PubMed] [Google Scholar]
- 27. Scott AC, Dundar F, Zumbo P, Chandran SS, Klebanoff CA, Shakiba M, et al. TOX is a critical regulator of tumour‐specific T cell differentiation. Nature 2019;571:270–4. [DOI] [PMC free article] [PubMed] [Google Scholar]
- 28. Crepeau RL, Ford ML. Programmed T cell differentiation: implications for transplantation. Cell Immunol. 2020;351:104099. [DOI] [PMC free article] [PubMed] [Google Scholar]
- 29. Nayar R, Schutten E, Bautista B, Daniels K, Prince AL, Enos M, et al. Graded levels of IRF4 regulate CD8+ T cell differentiation and expansion, but not attrition, in response to acute virus infection. J immunol. 2014;192:5881–93. [DOI] [PMC free article] [PubMed] [Google Scholar]
- 30. Yang CY, Best JA, Knell J, Yang E, Sheridan AD, Jesionek AK, et al. The transcriptional regulators Id2 and Id3 control the formation of distinct memory CD8+ T cell subsets. Nat Immunol. 2011;12:1221–9. [DOI] [PMC free article] [PubMed] [Google Scholar]
- 31. Joshi NS, Cui W, Chandele A, Lee HK, Urso DR, Hagman J, et al. Inflammation directs memory precursor and short‐lived effector CD8(+) T cell fates via the graded expression of T‐bet transcription factor. Immunity 2007;27:281–95. [DOI] [PMC free article] [PubMed] [Google Scholar]
- 32. Cannarile MA, Lind NA, Rivera R, Sheridan AD, Camfield KA, Wu BB, et al. Transcriptional regulator Id2 mediates CD8+ T cell immunity. Nat Immunol. 2006;7:1317–25. [DOI] [PubMed] [Google Scholar]
- 33. Kao C, Oestreich KJ, Paley MA, Crawford A, Angelosanto JM, et al. Transcription factor T‐bet represses expression of the inhibitory receptor PD‐1 and sustains virus‐specific CD8+ T cell responses during chronic infection. Nat Immunol. 2011;12:663–71. [DOI] [PMC free article] [PubMed] [Google Scholar]
- 34. Lazarevic V, Szabo S, Glimcher LH. T‐bet Runs INTERFERence. Immunity 2017;46:968–70. [DOI] [PMC free article] [PubMed] [Google Scholar]
- 35. Li J, He Y, Hao J, Ni L, Dong C. High levels of eomes promote exhaustion of anti‐tumor CD8(+) T cells. Front Immunol. 2018;9:2981. [DOI] [PMC free article] [PubMed] [Google Scholar]
- 36. Gupta PK, McIntosh CM, Chong AS, Alegre ML. The pursuit of transplantation tolerance: new mechanistic insights. Cell Mol Immunol. 2019;16:324–33. [DOI] [PMC free article] [PubMed] [Google Scholar]
Associated Data
This section collects any data citations, data availability statements, or supplementary materials included in this article.
Supplementary Materials
Figure S1. IRF4 is deleted in CD8+ T cells isolated from Irf4fl/flCd4‐Cre mice. PBMCs from either Irf4fl/flCd4‐Cre or Irf4fl/fl control mice were stimulated with 2 µg/ml soluble anti‐CD3e for 24 hours in vitro, followed by flow cytometric analysis. Representative plots were gated on living CD8+ T cells. Representative contour plots (A) and bar graph (B) show the IRF4 expression in CD8+ T cells. Data are mean ± SD (n = 5). **P < 0.01 (unpaired student's t‐test).
Figure S2. Irf4‐deficient CD8+ T cells barely express inhibitory receptors in transplant recipients. B6.Rag1‐/‐ recipients were adoptively transferred with either Irf4‐deficient (Irf4fl/flCd4‐Cre) or control (Irf4fl/fl) CD8+ T cells, followed by Balb/c skin transplantation. Adoptively transferred CD8+ T cells in spleens were analyzed at day 14 post‐skin grafting. Representative plots and overlay histograms were gated on the living transferred CD8+ T cells. (A) Gating strategy for detecting the living transferred CD8+ T cells. (B,C) Representative plots and bar graphs display % PD‐1+ and %TIM‐3+ cells among CD8+ T cells. (D,E) Representative overlay histogram and bar graph display the expression levels of LAG‐3 on CD8+ T cells. Data are mean ± SD (n = 3). **P < 0.01, ***P < 0.001, ****P < 0.0001 (unpaired student's t‐test).
Figure S3. Naïve Irf4-deficient CD8+ T cells barely differentiate into terminal effector cells. B6.Rag1‐/‐ recipients were adoptively transferred with naïve Irf4‐deficient or control CD8+ T cells, and transplanted with Balb/c tail skins. All representative plots were gated on living CD8+ T cells. Representative contour plots and bar graphs show % CD62L‐CX3CR1+ (A,B), and IFN‐γ+TNF‐α+ (C,D) cells among the transferred CD8+ T cells. Data are mean ± SD (n = 4). **P < 0.01; ****P < 0.0001 (unpaired student's t‐test).
Figure S4. Irf4‐deficient CD8+ T cells fail to acquire terminal effector phenotypes in recipients with long‐term accepted allografts. B6.Rag1‐/‐ recipients were adoptively transferred with either Irf4‐deficient or control CD8+ T cells, followed by Balb/c skin transplantation. Adoptively transferred CD8+ T cells in spleens were analyzed by flow cytometry at day 100 post‐skin grafting. Representative plots were gated on living CD8+ T cells. Representative contour plots and bar graphs show % CD62L‐CX3CR1+ (A,B), PD‐1+ (C,D), IL‐2+ (E,F left bar graph), and Granzyme A+ (E,F right bar graph) cells among the living CD8+ T cells. Data are mean ± SD of n ≥ 3 animals per group. *P < 0.05; **P < 0.01 (unpaired student's t‐test).
Data Availability Statement
Data are available on request from the authors.