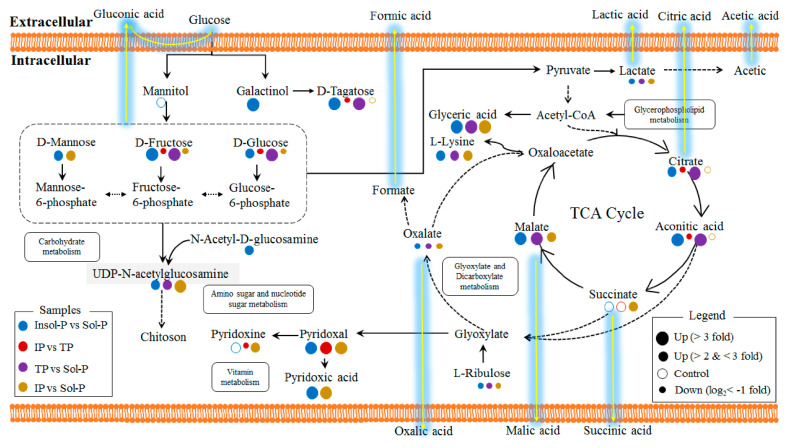
Figure 5.
Intracellular metabolic pathways regulated by P sources in P. oxalicum. Identified metabolites from Q-TOF are marked with colored circles. Briefly, blue, red, purple, and yellow circles represent the metabolite intensity of the samples that are affected by insoluble P (Insol-P) vs. soluble P (Sol-P), iron phosphate (IP) vs. tricalcium phosphate (TP), TP vs. Sol-P, IP vs. Sol-P, respectively. The diameters of the cycles represent the intensities of the intracellular metabolites in four comparisons. The solid circles represent the significant increase (FC > 2 fold, p < 0.05) and decrease (log2(FC) < −1, p < 0.05) intensities of important metabolites comparing to each control treatments. The hollow circles represent no significant changes (0.5 < FC < 2, p < 0.05) of the metabolic intensities. Solid lines show the intracellular metabolic pathways that exist in P. oxalicum, while the dotted lines show the supposed metabolic pathways. The yellow gleam lines represent the supposed extracellular acid production pathways collecting with intracellular metabolic pathways.

