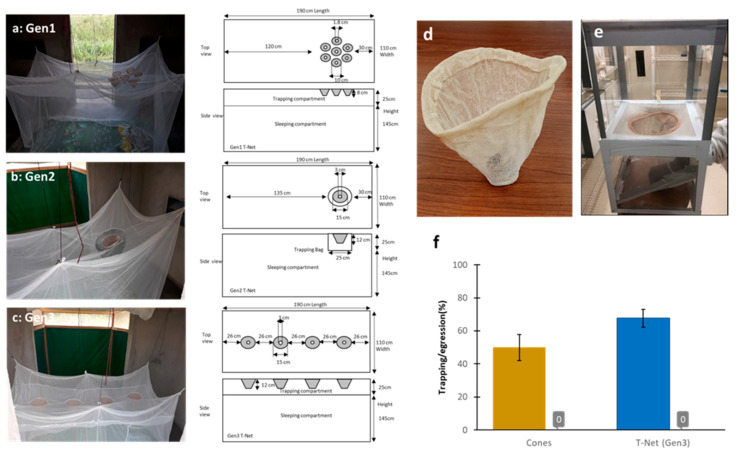
Figure 2.
Different T-Net designs and testing. (a) Generation (Gen) 1 T-Net made of a circular aggregate of seven small cones, (b) Gen2 T-Net made with one large cone fitted on a trapping bag (c) Gen3 T-Net fitted with four large cones, (d) example of a knitted cone, (e) experimental tunnel apparatus to assess the trapping efficacy of a knitted cone, and (f) results obtained from the tunnel test for trapping efficiency of a large cone (on the left) and for the Gen3 T-Net in a laboratory hut experiment (on the right). The histograms represent the trapping rates, the bars on top are the 95% confidence intervals, and “0” are the exit rates (= egression) in the absence of host cues.

