Abstract
Purpose
To investigate presumed activated retinal astrocytes and Müller cells (ARAM) detected by scanning laser ophthalmoscopy (SLO) and spectral domain optical coherence tomography, and to investigate its presence in healthy controls as well as its relationship to posterior vitreal detachment (PVD) and glaucoma.
Methods
This retrospective study involved 1337 eyes of 805 controls between ages 8 and 90, and 250 eyes of 146 patients with glaucoma between the ages of 28 and 95. Subjects were counted as possessing ARAM only if they met the following criteria: (1) a patchy, discrete, glittering appearance on SLO, (2) a distinct, flat, hyper‐reflective layer at the internal limiting membrane on at least one B‐scan crossing the glittering area and (3) absence of any surface wrinkling retinopathy. The diagnosis of PVD was based on both the patient’s clinical examination and imaging data. Frequency tables were used to describe categorical variables and differences were compared by means of χ2. Analyses were separated based on right and left eye, first on controls and then between glaucomatous eyes and age‐similar sex‐matched controls.
Results
ARAM was found in both healthy controls and patients with glaucoma at similar frequencies. There was no association between having glaucoma and the presence of ARAM. ARAM was not different between the sexes but was associated with age and having a PVD.
Conclusions
This large retrospective study found that ARAM can be seen in healthy controls, is associated with PVD and possibly independently with age, and occurred at similar frequency in glaucomatous eyes.
Keywords: activated glial cells, astrocytes, glaucoma, Müller cells, optical coherence tomography
Introduction
Glaucoma is a group of optic neuropathies characterised by progressive loss of retinal ganglion cells and their axons, cupping of the optic nerve head and visual field defects. It can lead to permanent vision loss if left untreated and is the leading cause of irreversible blindness in the world. 1 Historically, the clinical focus has been on examination of the optic nerve head with stereo biomicroscopy 2 , 3 and visual fields, 4 but with the advent of optical coherence tomography (OCT), retinal nerve fibre layer (RNFL) thickness analysis has become an integral part of the diagnosis and management of glaucoma. The RNFL is composed of ganglion cell axons, vasculature, as well as Müller cells, astrocytes and some microglia. In recent years, there has been an increasing interest in glial cells within the retina and their responses to injury. Previous studies have reported that “presumed activated retinal astrocytes and Müller cells” (hereafter referred to as ARAM) are seen in patients with primary open‐angle glaucoma (POAG) 5 and normal tension glaucoma (NTG) 6 as well as POAG patients with peripheral vascular dysregulation. 7 It was not until recently that ARAM was reported in eyes free of disease. 8 This paper will focus specifically on ARAM as seen in controls and patients with glaucoma.
Glial cell activation is a non‐specific response to central nervous system (CNS) trauma, characterised by an increase in size and number of glial cells and an upregulation of glial fibrillary acidic protein (GFAP). 9 The retina is an extension of the CNS, thus sharing many of the same injury responses. 5 , 7 , 10 Glial cell activation has been well documented by introducing mechanical, 11 hypoxic, 12 light damage 13 and other stresses to the retina, 14 as well as in experimentally induced glaucoma designs. 9 , 10 It has been found in murine models that astrocyte reactivity in the retina 15 and the optic nerve 16 increases with the onset of glaucoma. The percentage of retinal area covered by activated astrocytes could be a biomarker with the potential to predict retinal ganglion cell health as well as to identify retina at risk of glaucoma‐related vision loss. 15 This is supported by recent studies investigating the relationship between activated glia and glaucoma. 8 , 17 Edwards et al. characterised idiopathic preretinal glia immunohistochemically and identified both Müller cells and astrocytes in these preretinal glial projections and membranes. They found a high level of glial activation at vitreous attachment sites. 18 The extensions of the activated glial cells form a dense irregular meshwork on the surface of the retina enhancing light scatter. 5 These changes as observed clinically have been previously termed presumed activated retinal astrocytes and Müller cells (ARAM) 7 . The term ARAM is “presumed” because to our knowledge, there is no direct histological evidence in the current scientific literature that these observable preretinal changes are indeed activated retinal astrocytes and Müller cells. ARAM can be detected using red‐free but not standard colour fundus photography, 5 , 6 , 7 and are much more visible with Spectral Domain Optical Coherence Tomography (SD‐OCT) and adaptive optics scanning laser ophthalmoscopy (AO‐SLO). 19 Thus, the combination of increased astrocyte reactivity in animal glaucoma models with the identification of the retinal surface changes presumed to be of Müller cell and astrocyte origin leads one to hypothesise that ARAM would be increased in glaucoma.
Müller cells span the vertical extent of the inner retina, with their endfeet at the inner limiting membrane (ILM) and forming the outer limiting membrane at the photoreceptor layer. 7 , 9 , 18 , 20 , 21 Astrocytes are found throughout the retinal nerve fibre layer with close associations with retinal vasculature acting as part of the blood‐retina barrier. Astrocyte density decreases towards the retinal periphery and is absent in the foveal avascular zone. 9 , 18 , 20 , 21 , 22 Due to the location of Müller cell endfeet at the ILM and astrocytic perivascular endfeet enveloping the vessels, a posterior vitreous detachment (PVD) may tear the endfeet away from the cell body; a traumatic event to these cells which may result in their activation. 18 This would lead to the hypothesis of ARAM being present either exclusively or with increased frequency after a PVD occurs.
Unlike an epiretinal membrane (ERM), ARAM does not contract with resulting distortion of the retina, and therefore does not lead to symptoms such as reduced visual acuity or metamorphopsia. 5 , 6 , 7 Due to the light scattering properties of ARAM and its location at the vitreoretinal interface, it can obscure underlying structures in reflectance based retinal imaging. Clinically, it has been proposed that ARAM may mask areas of RNFL loss in POAG patients 5 and therefore may pose a problem to both researchers and clinicians. This study aimed to use a large sample size in an attempt to replicate the finding reported by Ashimatey et al. 8 that ARAM is found in healthy controls, as previous reports from our literature review all had relatively small samples. 5 , 6 , 7 This study also tested the hypothesis of a relationship between ARAM and PVD in healthy controls and in patients with glaucoma.
Patients and methods
The study was approved by the Institutional Review Board at Indiana University (USA) and adhered to the tenets of the Declaration of Helsinki. Informed consent was obtained from all participants.
Establishing ARAM criteria on SD‐OCT
High density macular OCT scans acquired using SD‐OCT (Spectralis™, Heidelberg Engineering, www.heidelbergengineering.com) at the Indiana University School of Optometry were reviewed retrospectively on glaucomatous eyes with a known history of ARAM. The high‐density protocol was a rectangular grid 20.0° × 25.0° consisting of 241 B‐scans, automatic real time‐function (ART) 9. These scans were compared to scans taken of the same eyes at the Atwater Eye Care Center (Bloomington, Indiana, USA) using the clinical protocol, which is a rectangular grid 30.0° × 25.0° consisting of 61 B‐scans, ART 9. The high‐density protocol scans allowed the generation of en face images on the Spectralis software while the clinical scans did not due to low sampling. En face images enhance visualisation of the ARAM from above the ILM (see Figure 1a ), which corresponds to the patches of glial alterations seen on the SLO image (see Figure 1b ). These findings are concordant with previous descriptions of ARAM as patchy, discrete glittering but transparent changes of the superficial layers of the retina. 5 The B‐scans revealed a distinct, flat, hyper‐reflective layer at the ILM in areas with these glial alterations (see Figure 1c ). For comparison, these glial alterations were not easily seen with fundus photography (see Figure 1d ). Any subject with surface wrinkling retinopathy was excluded. Based on OCT imaging, these three criteria were established as our definition for identifying ARAM in the absence of high density en face imaging: (1) a patchy, discrete, glittering appearance on SLO, (2) a distinct, flat, hyper‐reflective layer at the ILM on at least one B‐scan crossing the glittering area and (3) absence of any surface wrinkling. See Figures 2 , 3 and 2 , 3 for examples using the clinical protocol.
Figure 1.
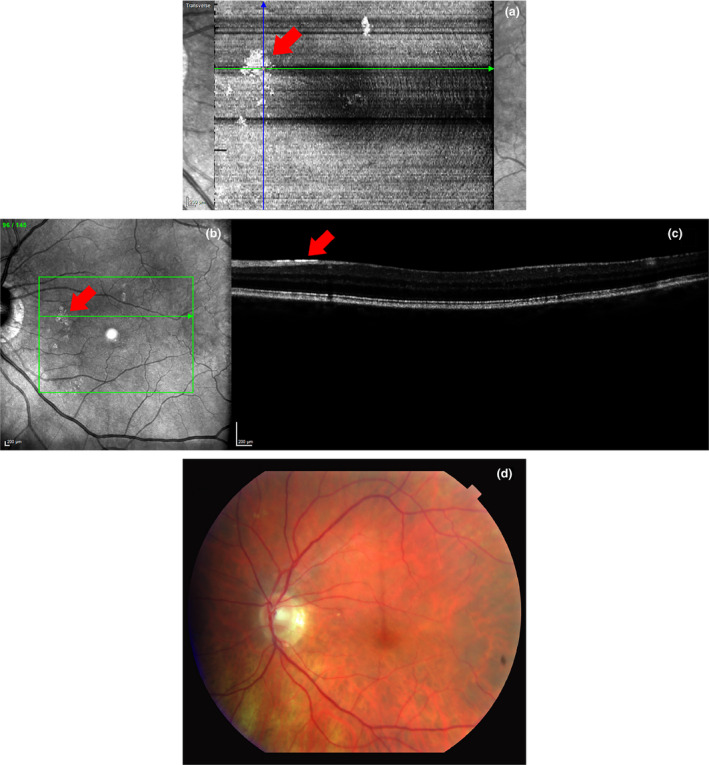
(a) En face image of an 85‐year‐old control subject with high myopia and ARAM using a high‐density protocol. Patches of hyper‐reflectivity can be seen here in the same locations as the patchy, discrete, glistening lesions on the SLO image in (b). On the B‐scan (c), a hyper‐reflective line is seen at the ILM in the glittering area. In comparison, the ARAM cannot be seen in (d) a standard colour fundus photo of the same patient taken 15 min after OCT imaging.
Figure 2.
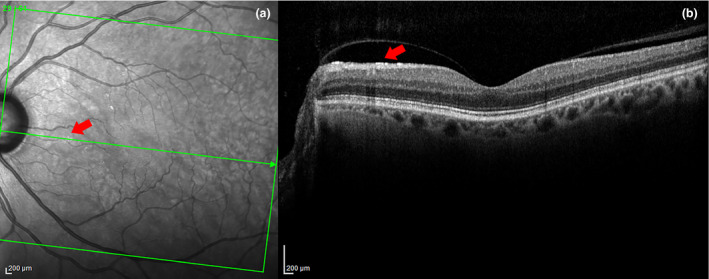
In 2a, the arrow points to a very small patch of ARAM in the SLO image. In 2b, a hyper‐reflective layer is seen at the ILM in the B‐scan at the same location as the ARAM lesion on the SLO. A partial PVD with detachment in the area of the ARAM is also evident here. There are several other small patches of ARAM seen in (a) but could not be captured due to the sparse sampling of B‐scans.
Figure 3.
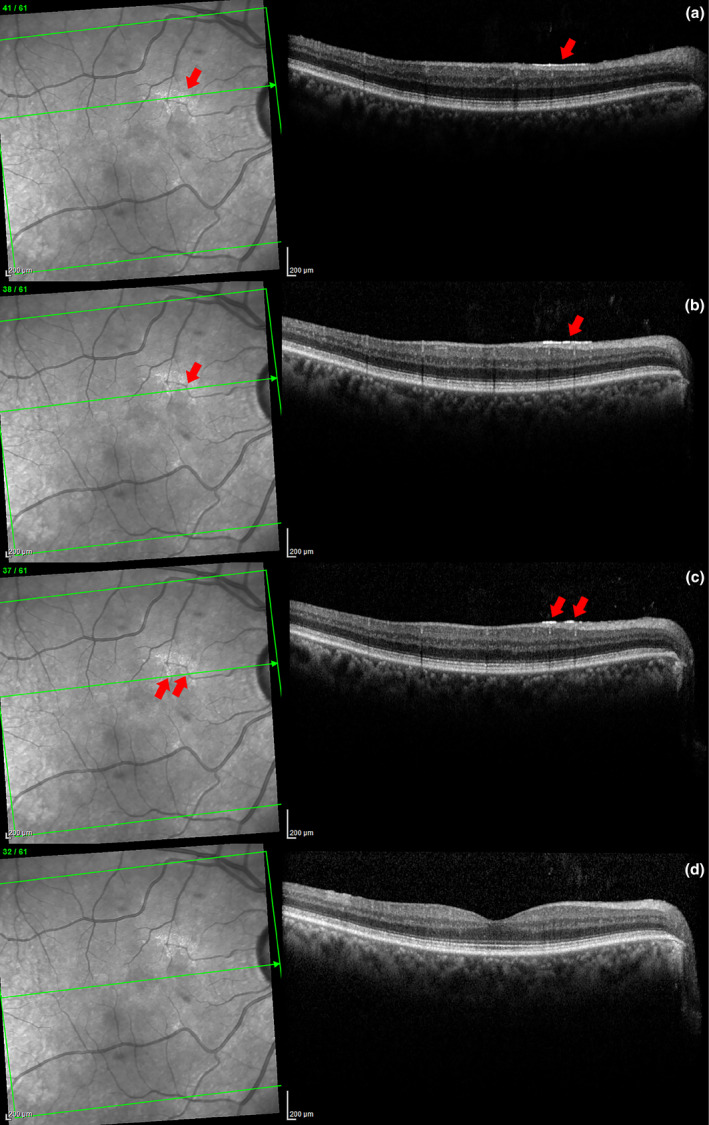
Series of SD‐OCT scans of a patch of ARAM in a glaucoma patient (a through c). On the left, the patchy glistening ARAM can be clearly visualized in the SLO image. On the right, a corresponding hyper‐reflective line at the ILM can be seen in the same location depicted by the arrows. The bottom scan (d) is inferior to the ARAM, the hyper‐reflective line is absent here.
Inclusion and exclusion criteria
Common inclusion criteria for both groups included an absence of optic nerve or vitreoretinal disease (except for glaucoma in the patient group) during a comprehensive eye examination, and OCT imaging with quality score of at least 16 within 2 years of the eye examination for controls and within 1 year for patients. There were no restrictions in terms of age, spherical or cylindrical correction, axial length, or ocular media opacities in either group.
Common exclusion criteria for both groups were ocular disease (other than glaucoma for the patient group) currently affecting visual function, a history of intraocular surgery (except for uncomplicated cataract or glaucoma surgery), eyes with epiretinal membranes or undetermined vitreal status. The vitreous status was categorised as attached, detached including partial PVDs, or undetermined based on clinical and imaging data. Careful evaluation for the presence of PVD was made including the relationship of ARAM to specific areas of detachment in cases of partial vitreous detachment, see Figure 2 .
The control group was chosen from our existing SD‐OCT research database in April 2013. Additional inclusion criteria included a best corrected visual acuity of 6/9 or better and IOP of < 21mmHg. Additional exclusion criteria included a positive family history of glaucoma in a first‐degree relative or history of ocular trauma. Eyes with undetermined vitreous status (n = 170) were excluded. Both eyes of 987 subjects were reviewed; 1,337 eyes of 805 subjects met the inclusion and exclusion criteria.
Medical charts of glaucoma patients seen at the Atwater Eye Care Center between July 2011 and February 2016 were retrospectively reviewed. For the patient group, the inclusion criteria were clinically diagnosed glaucoma (all forms except for traumatic glaucoma). Eyes with undetermined vitreous status (n = 15) were excluded. A total of 375 eyes of 204 patients with glaucoma were reviewed. Of these, 126 right eyes and 124 left eyes of 146 patients had usable data. Analysis of right and left eyes were performed separately. Figure 3 shows an example of a typical OCT scan of a glaucoma patient with ARAM.
Statistical analysis
Frequency tables were generated, and chi‐square analysis was used to describe the relationships between the categorical variables. This was an exploratory study, and so the level of significance was set as a p‐value < 0.05. Statistical analyses were performed using SPSS version 24.0 (IBM Corp., www.ibm.com). To avoid inherent correlation between eyes from the same subject, analysis was performed on the right and left eyes separately. Right eyes were used in the primary analysis, and the left eyes in the secondary analysis to confirm the findings from the primary analysis. This allowed us to assess data reproducibility. Controls were first analysed to determine ARAM relationship to PVD, age and sex, and then age‐similar sex‐matched controls were randomly selected [using a random number generator from Microsoft Excel (www.microsoft.com)] from the pool of controls with usable data to be compared against patients with glaucoma.
Results
ARAM is found in both healthy controls and glaucoma patients at similar proportions. ARAM was only found in eyes that had a PVD, and in the case of partial PVDs was only seen in an area under the detached vitreous face. The presence of ARAM was not associated with sex or glaucoma.
Healthy controls: Age distribution
The age of healthy controls ranged from 8 to 90 years of age; see Figure 4 for age distribution. From the 805 controls, 712 right eyes and 625 left eyes had usable data. The association between ARAM and PVD, age and sex was analysed.
Figure 4.
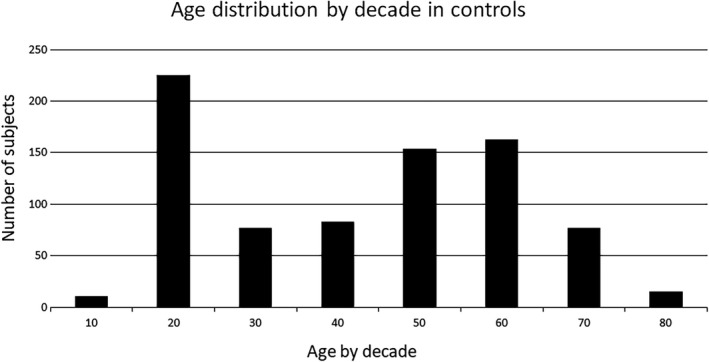
The age of controls is distributed by decade. The large sample of subjects in their 20’s is due to a large number of optometry students. There was only one subject below the age of 10 and one subject who was 90, they were grouped into the next closest decade category in this and subsequent figures.
Healthy controls: ARAM and PVD
A chi‐square test of independence showed a significant relation between ARAM and PVD, right eye χ2 (1, N = 712) = 71.867, p < 0.001, left eye χ2 (1, N = 625) = 59.477, p < 0.001, both with a moderate effect size; right eye ф = 0.318, left eye ф = 0.308. ARAM was found in 16% of right control eyes and 15% of left control eyes, and only in those eyes that had a PVD. ARAM seems to occur almost exclusively in older subjects with a PVD. See Tables 1 , 3 and 1 , 3 for a summary.
Table 1.
Frequencies of ARAM in healthy controls
| Right Eye | Left Eye | |||
|---|---|---|---|---|
| ARAM − | ARAM + | ARAM − | ARAM + | |
| ARAM and PVD | ||||
| PVD − | 435 | 0 | 385 | 0 |
| PVD + | 234 | 43 (16%) | 205 | 35 (15%) |
| ARAM and Age | ||||
| 20–40 | 289 | 0 | 245 | 0 |
| 60–80 | 203 | 36 (15%) | 174 | 30 (15%) |
| ARAM and Sex | ||||
| Male | 305 | 19 (6%) | 264 | 15 (5%) |
| Female | 364 | 24 (6%) | 326 | 20 (6%) |
Table 3.
Statistical output for each variable in healthy controls
| Right Eye | Left Eye | |||||
|---|---|---|---|---|---|---|
| χ2 | p‐value* | ф | χ2 | p‐value* | ф | |
| ARAM and PVD | 71.867 | 0.000 | 0.318 | 59.477 | 0.000 | 0.308 |
| ARAM and Age | 46.717 | 0.000 | 0.297 | 38.609 | 0.000 | 0.293 |
| ARAM and Sex | 0.032 | 0.858 | – | 0.048 | 0.827 | – |
| PVD and Age | 344.788 | 0.000 | 0.808 | 282.544 | 0.000 | 0.793 |
χ2, Chi‐square; ф, Effect size.
P‐value by the Chi‐square test
Healthy controls: Effect of age on ARAM and PVD
To specifically look at the effect of age, two age groups (20–40 and 60–80 years) were selected. A chi‐square test of independence was calculated comparing the frequency of PVD in these two age groups. As expected, a significant age effect was found in each eye: right eye, χ2 (1, N = 528) = 344.79, p < 0.001, with higher age being more likely to have a PVD (ф = 0.81), and also left eye, χ2 (1, N = 449) = 285.54, p < 0.001, with a strong effect size (ф = 0.80), see Tables 1 , 2 and 1 , 2 and Figure 5 . ARAM also showed an association with age with a moderate effect size: right eye χ2 (1, N = 528) = 46.72, p < 0.001, ф = 0.297, and left eye χ2 (1, N = 449) = 38.61, p < 0.001, ф = 0.29. PVD occurred in 4% of the young control group compared to over 80% of the older control group, see Tables 1 , 2 , 3 – 1 , 2 , 3 and Figure 6 .
Table 2.
Frequencies of PVD in healthy controls separated into two age groups
| Right Eye | Left Eye | |||
|---|---|---|---|---|
| PVD − | PVD + | PVD − | PVD + | |
| PVD and Age | ||||
| 20–40 | 278 (96%) | 11 (4%) | 236 (96%) | 9 (4%) |
| 60–80 | 40 (17%) | 199 (83%) | 38 (19%) | 166 (81%) |
Figure 5.
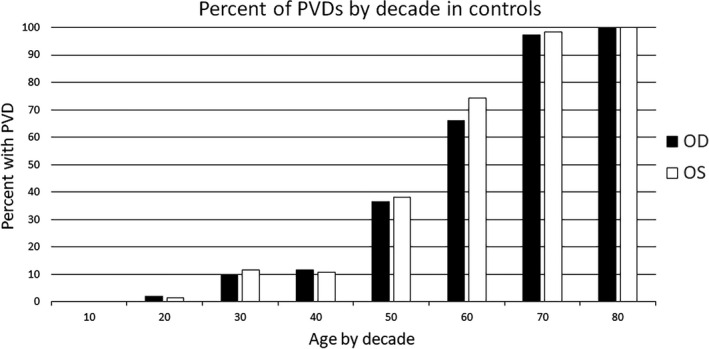
As age increases, the percentage of subjects with PVD increases.
Figure 6.

On the left, the percent of subjects with ARAM by decade, and on the right, percent of subjects with a PVD and ARAM by decade. Similar trends are seen between the two eyes in both cases. Numbers in the 80’s group are small and likely produce the greater difference between the two eyes. OD, right eye; OS, left eye.
Healthy controls: ARAM and sex
The association between ARAM and sex did not reach statistical significance. There was essentially the same percentage of males and females with ARAM (see Tables 1 , 3 and 1 , 3 ).
Glaucoma patients: ARAM and PVD, primary analysis
Using only the right eyes in our primary analysis, 126 glaucomatous eyes (mean age 67.54, range 28–92, S.D. 11.18) of 58 males and 68 females were compared against 126 age‐similar, sex‐matched controls (mean age 66.65, range 28–90, S.D. 10.97). Of these controls, 100 out of 126 (79%) had a PVD compared to 92 of 126 (73%) in glaucomatous eyes. Thus, PVDs were found at very similar rates in both groups. In the glaucomatous group with a PVD, 21 of 92 (23%) had ARAM, compared to 19 out of 100 (19%) in the control group with PVD. Again, ARAM was found to be associated with PVD in both matched controls and glaucomatous eyes with small to moderate effect size, χ2 (1, N = 126) = 5.82, p = 0.016 and χ2 (1, N = 126) = 9.31, p = 0.002. See summary of glaucoma patients and their matched controls in Table 4 .
Table 4.
Characteristics of glaucoma patients and matched controls
| Right Eye | Left Eye | |||
|---|---|---|---|---|
| Control | Glaucoma | Control | Glaucoma | |
| Age (years) | 66.65 ± 10.97 | 67.54 ± 11.18 | 66.68 ± 10.56 | 67.54 ± 11.64 |
| Range (years) | 28 to 90 | 28 to 92 | 28 to 90 | 28 to 95 |
| Sample size | 126 | 126 | 124 | 124 |
| Male | 58 (46%) | 58 (46%) | 60 (48%) | 60 (48%) |
| Female | 68 (54%) | 68 (54%) | 64 (52%) | 64 (52%) |
| PVD | 100 (79%) | 92 (73%) | 95 (77%) | 91 (73%) |
| PVD with ARAM | 19 (19%) | 21 (23%) | 16 (17%) | 14 (15%) |
Glaucoma patients: ARAM and glaucoma, primary analysis
A chi‐square test of independence was calculated comparing the frequency of ARAM in the age‐similar, sex‐matched control and glaucomatous groups. The association between ARAM and glaucoma did not reach statistical significance; thus having glaucoma does not increase the likelihood of having ARAM, see Tables 5 , 6 and 5 , 6 .
Table 5.
Number of people with ARAM in glaucoma and control groups
| Right Eye | Left Eye | |||
|---|---|---|---|---|
| ARAM− | ARAM + | ARAM − | ARAM + | |
| ARAM and PVD | ||||
| Control | ||||
| PVD − | 26 | 0 | 29 | 0 |
| PVD + | 81 | 19 | 79 | 16 |
| Glaucoma | ||||
| PVD − | 34 | 0 | 33 | 0 |
| PVD + | 71 | 21 | 77 | 14 |
| ARAM and Glaucoma | ||||
| Group | ||||
| Control | 107 | 19 | 108 | 16 |
| Glaucoma | 105 | 21 | 110 | 14 |
| ARAM and Glaucoma with PVD | ||||
| Group | ||||
| Control | 81 | 19 | 79 | 16 |
| Glaucoma | 71 | 21 | 77 | 14 |
Table 6.
Statistical output for association between ARAM, PVD, and glaucoma
| Right Eye | Left Eye | |||||
|---|---|---|---|---|---|---|
| χ2 | p‐value* | ф | χ2 | p‐value* | ф | |
| ARAM and PVD | 9.313 | 0.002 | 0.272 | 5.723 | 0.017 | 0.215 |
| ARAM and glaucoma | 0.119 | 0.730 | ‐ | 0.152 | 0.697 | ‐ |
| ARAM and glaucoma with PVD | 0.425 | 0.514 | ‐ | 0.073 | 0.787 | ‐ |
χ2, Chi‐square; ф, Effect size.
p‐value by the Chi‐square test
Glaucoma patients: Secondary analysis
Using the left eye in the secondary analysis, the results were very similar, supporting our findings from the primary analysis. PVD showed a significant association with ARAM, but the association between ARAM and glaucoma did not reach statistical significance. See Table 4 for a summary of results from patients and the matched controls, and Tables 5 , 6 and 5 , 6 for comparisons between the right and left eyes.
Discussion
In this present study using SD‐OCT, we were able to visualise and differentiate ARAM from the RNFL. ARAM is common and was seen in approximately 15% of healthy eyes. It was found in both healthy controls and glaucomatous eyes at similar rates. The association between ARAM and age as well as ARAM and PVD reached statistical significance with a moderate effect size (see Table 3 ). Since PVD is typically an age‐related event, excluding other causes such as trauma, it is likely that the association between ARAM and age is partially explained by PVD.
In the past, studies investigating ARAM mainly focused on patients with glaucoma and had few if any controls. It was reported that ARAM was not found in healthy subjects, 5 , 6 and unrelated to age or eye‐side. 7 , 17 ARAM was more frequent in female patients, 7 while patients with progressive field loss had a higher prevalence of ARAM (86.7%) compared to those without progressive field loss (14.3%). 6 In 1993, Graf et al. found ARAM in 87% of POAG patients (n = 45), but none in the controls (n = 10). 6 In 2007, Grieshaber et al. observed that more female patients with POAG (41%) had ARAM when compared with male patients (18%), and suggested a relationship between peripheral vascular dysregulation in females and the development of ARAM. 7 His study examined 186 eyes from 93 POAG patients, but had no control group. In a later study of 32 eyes from 19 patients with POAG, they noted ARAM in 84% to 95% of left and right eyes, respectively, but none in 58 eyes of 35 age‐matched control subjects. 5 In 2017, Nutzi et al. studied 18 eyes of 12 patients with POAG and found that when testing with microperimetry, local areas with ARAM exhibited lower sensitivity when compared to regions without ARAM. 17 In addition, they found that the density of ARAM was inversely correlated with average retinal sensitivity, as well as with the corresponding circumpapillary RNFL sector thickness, concluding that a larger quantity of ARAM in patients with POAG is a clinical sign indicating a more advanced stage of the disease. In 2018, Ashimatey et al. investigated the association between glaucomatous abnormality and the presence, extent and spatial distribution of ARAM, and found that the surface area of ARAM can be a potential predictor of glaucoma damage, 8 in line with findings of Nutzi et al. 17 In addition to a glaucoma group between 40–85 years of age, Ashimatey et al. also included two control groups; a similar aged control group (n = 38), and a younger control group(n = 35) between 21–35 years of age. This was the first study we found that reported ARAM in healthy age‐similar controls as well as an effect of age.
The contradictory findings on controls and age raises the question of whether ARAM may be a glaucoma‐specific finding as previously suggested, a normal finding that can be exacerbated by disease processes such as glaucoma, or whether the discrepancies are due to the different methods and technologies used in each study. Firstly, different age groups were used across studies. Grieshaber et al. concluded there was no effect of age when comparing 93 patients having an average age of 68.6 ± 8.1 years and 65.6 ± 13.6 years in groups with and without ARAM, respectively. 7 Nutzi et al. concluded there was no effect of age in a group of 12 patients with an average age of 77.6 ± 7.2 years. 17 In agreement with Ashimatey et al., 8 the present study found a significant age effect. Additionally, ARAM was noted in healthy age‐similar controls at similar frequencies to patients with glaucoma. This may be explained by having a younger control group as well as the age‐similar control group, which was not the case for any of the previous studies other than Ashimatey et al. 8 Secondly, advances in technology can make a significant difference. Both this investigation as well as Ashimatey et al. used the Heidelberg Spectralis™ to gather SD‐OCT and SLO images. This is superior to previously used techniques such as laser‐scanning funduscopy, red‐free fundus photography and time‐domain OCT. 5 , 6 , 7 , 17 Nevertheless, despite using different imaging technologies, we were able to identify patchy, discrete and glittering changes to the superficial retina, and it is reasonable to assume we were identifying the same structures as previous studies but with higher axial and lateral resolution and image quality. Thirdly, most of the previous studies had small sample sizes with either no or only a small control groups. Our larger sample size (250 eyes from 146 glaucomatous patients and 1,337 eyes from 805 controls) may also account for these differences. Lastly, we analysed the right and left eyes separately, whereas previous studies pooled both eyes in their analysis. Our separate analysis allowed us to demonstrate reproducibility in the data and strengthen support for our findings. Grieshaber et al. reported a higher incidence of ARAM in females with peripheral vascular dysregulation, as well as ARAM being moderately related to the stage of POAG as quantified by the mean defect (MD). 7 We did not find a significant effect of sex, but did not examine the relationship between peripheral vascular dysregulation and ARAM. The relationship between ARAM and the severity of glaucoma was assessed using the modified glaucoma staging system (mGSS). 23 While this method of staging glaucoma was easy to understand and implement, it was too conservative, which resulted in too few visual fields being classified as moderate and none as severe. As such, meaningful statistics could not be performed using the mGSS (data not shown). Table 7 shows a summary of previous reports of ARAM prevalence.
Table 7.
Summary of previously reported ARAM prevalence compared to the present study
| n | Summary | ||
|---|---|---|---|
| Graf et al. 1993 | |||
| Control | Subjects | 15 |
|
| Eyes | x | ||
| Glaucoma | Subjects | 45 | |
| Eyes | x | ||
| Grieshaber et al. 2007 | |||
| Control | Subjects | 0 |
|
| Eyes | 0 | ||
| Glaucoma | Subjects | 93 | |
| Eyes | 186 | ||
| Grieshaber et al. 2012 | |||
| Control | Subjects | 35 |
|
| Eyes | 58 | ||
| Glaucoma | Subjects | 19 | |
| Eyes | 32 | ||
| Nutzi et al. 2017 | |||
| Control | Subjects | 0 |
|
| Eyes | 0 | ||
| Glaucoma | Subjects | 12 | |
| Eyes | 18 | ||
| Ashimatey et al. 2018 | |||
| Control (younger) | Subjects | 35 |
|
| Eyes | 35 | ||
| Control (older) | Subjects | 42 | |
| Eyes | 42 | ||
| Glaucoma | Subjects | 38 | |
| Eyes | 38 | ||
| Cheung et al. 2020 | |||
| Control | Subjects | 805 |
|
| Eyes | 1337 | ||
| Glaucoma | Subjects | 146 | |
| Eyes | 250 | ||
In previous studies, only POAG and NTG patients were used. To maximise our sample size, we included all types of glaucoma except for traumatic glaucoma, but by doing so, unknown variables may have been introduced into the data that we did not account for. Of the 126 glaucomatous right eyes and 124 glaucomatous left eyes, 81 and 84 had POAG, respectively. When evaluating the presence of ARAM, the control eyes were assessed by one clinician while the glaucomatous eyes were assessed by a second clinician. This may have introduced observer biases even though the same criteria were used. While assessing glaucomatous eyes, it was noted that some eyes had a typical ARAM appearance on SLO, although no hyper‐reflectivity was seen on the B‐scan, and vice versa. The clinical protocol with 61 B‐scans may have been too sparse to capture small ARAMs that fell between the scans (around 116–146 µm). In the preretinal glial classification by Edwards et al., a glial sprout is the smallest and simplest preretinal glial structure, and can extend between 100–200 µm. 18 Therefore, small glial sprouts may be missed with the clinical protocol adopted here. On the other hand, glial blooms, which can extend between 200 and 800 µm, and glial membranes, which extend more than 500 µm in all directions, should be readily observed with our clinical protocol. 18 The high‐density protocol with a denser sampling of 241 B‐scans would be more appropriate because the distance between B‐scans is much smaller, approximately 30–31 µm, but it is not practical in a clinical setting. While our imaging results are consistent with the immunohistochemical findings reported by Edwards et al., 18 we did not characterise the appearance in as much detail, nor did we attempt to spatially quantify the ARAM. We also found that many eyes had a distinct hyperreflective line on the B‐scan but no corresponding ARAM lesion on the SLO image. In an exploratory analysis, we redefined the presence of ARAM based solely on the B‐scan image, and found 41% to 46% of post PVD glaucomatous eyes had ARAM. It is possible that some patches of ARAM are too small to be visualised with the SLO image.
In addition, the clinical protocol uses a 30.0° x 25.0° scan centred at the macula. ARAM that fall outside this area, including part of the superior and inferior temporal arcades and all of the nasal retina will not be detected. Considering these factors, we may be underestimating the true prevalence of ARAM due to low B‐scan sampling and the limited scanned area in the clinical protocol. Additionally, our glaucoma group had a low number of patients with advanced disease and patients were generally well controlled. Therefore, it remains possible that ARAM is actually elevated in glaucoma patients with advanced disease or progression, which would run counter to the results found in this study for those individuals with largely non‐progressive stage 0 and 1. We found that ARAM occurred in 15%–23% of patients and 17%–19% of age‐similar controls. This is similar to the 14% of a non‐progressing POAG group reported by Graf et al. 6 If ARAM occurs post PVD due to the mechanical avulsion of Müller cells and astrocytic endplates, then stage 0 and 1 subjects would be very similar to the controls, whereas advanced glaucoma, with loss of most of the nerve fibre layer, leaves the vessels exposed at the retinal surface and perhaps the astrocytes more susceptible to damage by the process of vitreal detachment. This leaves open the possibility that stage 4 and 5 eyes would have higher rates of ARAM. Even though the percentage of subjects with ARAM were similar between the control and the glaucoma group, we are limited by a categorical variable of “yes or no” in regard to the presence of ARAM. A continuous variable such as quantifying the percentage area covered by ARAM may be more helpful, as it has previously been identified as a potential biomarker for retinal ganglion cell (RGC) health 15 and the severity of glaucomatous damage. 8 , 17 To resolve the relationship of ARAM to glaucoma, and especially to the severity of glaucoma, including subjects with more advanced glaucomatous disease would be informative.
Glial cell activation is a non‐specific injury response of the CNS. 9 As such, the development of ARAM is likely multifactorial depending on the injuries sustained by the retina. With close proximity to retinal vasculature and increased evidence of vascular dysregulation in the pathogenesis of glaucomatous damage, it is not surprising that a strong relation between peripheral vascular dysregulation and ARAM has previously been reported. 7 Interestingly, Schwab et al. recently reported a higher prevalence of PVD in patients with glaucoma compared to controls. They suggested that this finding may be attributed to increased oxidative stress in the RGC layer in glaucoma, and that an increase in reactive oxygen species at the vitreoretinal interface may be accelerating the liquefaction of the vitreous leading to earlier PVD. 24 We found a strong association between ARAM and PVD, which may be explained by damage to the Müller cells and astrocytic endfeet. If ARAM develops after a PVD, and more frequently in glaucoma patients, then there are mechanisms that might explain this. Underlying activation of glial cells in glaucoma may be a contributing factor, making them more prone to express GFAP in response to the trauma experienced with a PVD. Another factor may be changes in the retinal anatomy seen in glaucoma with the thinning of the RNFL. This results in relative prominence of the blood vessels compared to those of a non‐glaucomatous patient where the blood vessels are largely embedded in the RNFL. With this alteration in the anatomy, there may be enhanced trauma to the astrocytic endfeet surrounding retinal blood vessels at the ILM during the process of a PVD. This seems increasingly likely in patients with progressive or advanced stages of glaucoma, perhaps explaining the higher frequency of ARAM reported by Graf et al. 6 and the larger surface area of ARAM suggested by Nutzi et al. 17 and Ashimatey et al. 8
Glial cell activation appears to be a dynamic process. Seven healthy subjects free of eye disease were imaged over intervals ranging from months to years using SLO with OCT and AO‐SLO. One patient was imaged over four years with SLO and another imaged on two occasions approximately three months apart by AO‐SLO, see Figures 7 , 8 and 7 , 8 , respectively. While the numbers of subjects is small, their images show that ARAM changes over time. Figure 7 illustrates this change in a series of SLO images where patches of ARAM become less distinct and less extensive over time while new lesions arise. Figure 8 shows a patch of ARAM (using AO‐SLO) that changes in size and shape over three months. A well‐designed longitudinal study with a larger sample size is required to understand the natural history of ARAM.
Figure 7.
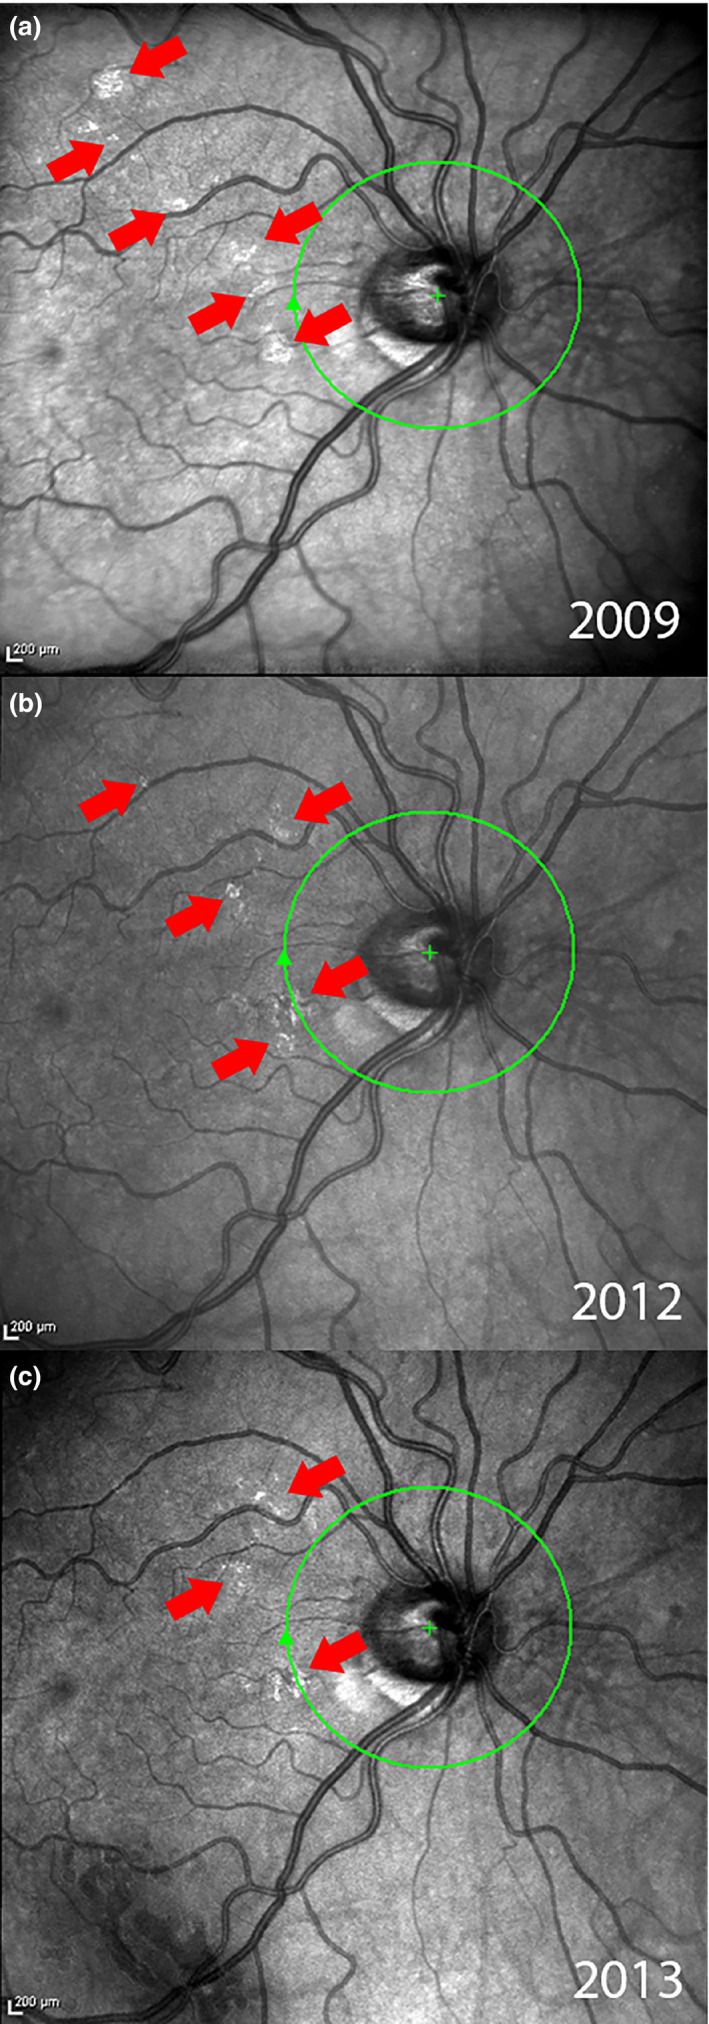
Series of SLO images from the SD‐OCT of a control subject over a period of four years showing temporal changes in ARAM. (a) The initial scan taken in 2009, multiple small patches of ARAM can be seen depicted by the arrows. (b) Scan taken in 2012. Much of the ARAM in (a) has faded, with some new areas of ARAM developing. (c) Scan taken in 2013 continues to show changes in ARAM.
Figure 8.
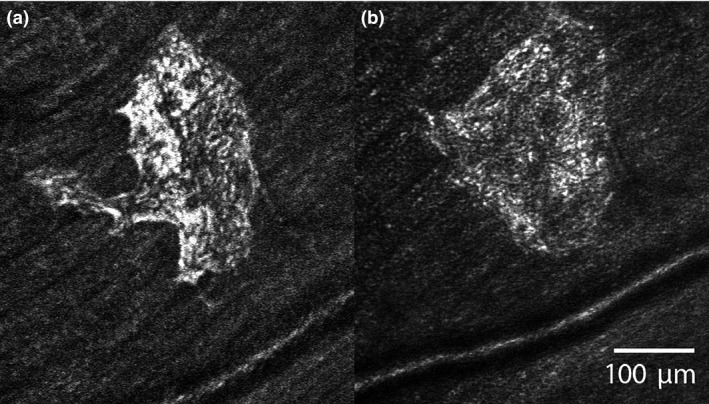
AO‐SLO images of ARAM in a healthy control. Image (b) was taken 3 months after image (a) and shows substantial remodeling in this short time frame, similar to the waxy membranes described by Scoles et al. 19
A limitation of this study is the potential to confuse the hyperreflective structures with ERMs or specular reflections. Some patches seen on SLO may be early ERM changes that cannot be differentiated from ARAM, or perhaps ARAM and ERMs fall on a continuum of superficial glial changes with different factors causing it to grow, regress or contract. Eyes with any obvious signs of ERM were excluded, even if the eye also had ARAM (see Figure 9 ). Specular reflection is the ‘retinal sheen’ commonly seen during ophthalmoscopy or in colour fundus photographs of healthy young retinas, but is rarely observed in older eyes. Specular reflection has a bright bleached appearance and can change in shape, location and size in subsequent images. It does not manifest as a distinct, flat, hyperreflective line at the ILM on OCT. In contrast, ARAM has a glistening appearance, and this spatially varied brightness is indicative of some form of texture and structure. In addition, these glistening areas have a distinct, flat, hyperreflective line at the ILM on OCT, and have consistent shape, location and size when imaged over a short period of time. These observations were confirmed when eyes with multiple images from different visits were available. Therefore, it is unlikely that the hyperreflectivity from ARAM was confused with that of specular reflection, especially in the older control subjects and patients with glaucoma.
Figure 9.
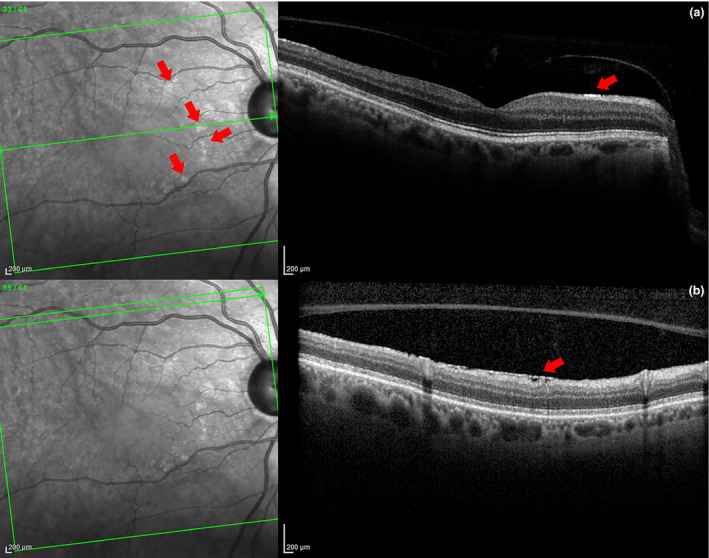
Glaucomatous eye with both ERM and ARAM seen in distinct OCT sections. Note the increased reflectance seen on SLO without retinal distortion with ARAM (a) and the retinal distortion but lack of increased reflectance on SLO with ERM (b). This occurs even though each type of lesion has increased signal at the ILM on OCT B‐scan images.
ARAM forms a dense irregular meshwork that increases reflectance. Due to its light scattering properties, ARAM may complicate imaging techniques by hiding or decreasing the signal from underlying retinal structures and it has been suggested to mask RNFL loss. 5 It may be possible to segment ARAM and remove it from RNFL thickness measurements on OCT. However, ARAM also appears to behave dynamically; new lesions may proliferate in areas of recent and ongoing PVD while post‐PVD lesions begin to regress and fade (see Figures 8 , 9 and 8 , 9 ). Due to our small sample of longitudinal imaging with either SD‐OCT or AO‐SLO in the controls (N = 7), it is unclear how quickly and to what extent ARAM changes over time; whether it continually grows and spreads, regresses and disappears, or remains stable at some point in its natural history. If ARAM does undergo a dynamic process of proliferation and regression, the same segmentation may not apply longitudinally to subsequent scans. In this case, resegmentation at each visit may be required, which is both inconvenient and unrealistic in a clinical setting. More interestingly, recent studies using reflectance‐based en face images to visualise RNFL defects have shown great potential in clinical decision making and compatibility with other structural and functional testing, 25 , 26 , 27 , 28 and methods to mitigate the presence of ARAM have been proposed. 29
In conclusion, ARAM can be detected using SD‐OCT in a clinical setting. PVD seems to be a necessary but not a sufficient factor for the presence of ARAM in both normal and glaucomatous eyes, while there may be a higher incidence in glaucoma. The impact of ARAM on the management of glaucoma remains unclear.
Author contributions
Hin Cheung: Conceptualization (supporting); Data curation (equal); Formal analysis (equal); Investigation (equal); Methodology (equal); Writing‐original draft (lead); Writing‐review & editing (equal). Brett J King: Conceptualization (equal); Formal analysis (supporting); Investigation (supporting); Methodology (equal); Project administration (lead); Supervision (lead); Writing‐review & editing (equal). Thomas J Gast: Conceptualization (equal); Data curation (equal); Formal analysis (equal); Investigation (equal); Methodology (equal); Writing‐review & editing (equal).
Conflict of interest
The authors report no conflicts of interest and have no proprietary interest in any of the materials mentioned in this article.
Acknowledgements
We would like to thank Dr. Victor E. Malinovsky and Dr. William H. Swanson for reading an earlier version of this manuscript, and Dr. Stephen A. Burns for providing the AO‐SLO images. This study was supported in part by Grant R01EY024542 and Grant R01EY024315 from the National Eye Institute, National Institutes of Health, U.S. Department of Health and Human Services.
Cheung H, King BJ, & Gast TJ. Presumed activated retinal astrocytes and müller cells in healthy and glaucomatous eyes detected by spectral domain optical coherence tomography. Ophthalmic Physiol Opt 2020; 40: 738–751. 10.1111/opo.12731
References
- 1. Tham YC, Li X, Wong TY, Quigley HA, Aung T & Cheng CY. Global prevalence of glaucoma and projections of glaucoma burden through 2040: a systematic review and meta‐analysis. Ophthalmology 2014; 121: 2081–2090. [DOI] [PubMed] [Google Scholar]
- 2. Spaeth GL, Henderer J, Liu C et al The disc damage likelihood scale: reproducibility of a new method of estimating the amount of optic nerve damage caused by glaucoma. Trans Am Ophthalmol Soc 2002; 100: 181–185; discussion 185–186. [PMC free article] [PubMed] [Google Scholar]
- 3. Zangalli C, Gupta SR & Spaeth GL. The disc as the basis of treatment for glaucoma. Saudi J Ophthalmol 2011; 25: 381–387. [DOI] [PMC free article] [PubMed] [Google Scholar]
- 4. Garway‐Heath DF, Lascaratos G, Bunce C, Crabb DP, Russell RA & Shah A. The United Kingdom Glaucoma Treatment Study: a multicenter, randomized, placebo‐controlled clinical trial: design and methodology. Ophthalmology 2013; 120: 68–76. [DOI] [PubMed] [Google Scholar]
- 5. Grieshaber MC, Moramarco F, Schoetzau A, Flammer J & Orguel S. Detection of retinal glial cell activation in glaucoma by time domain optical coherence tomography. Klin Monatsbl Augenheilkd 2012; 229: 314–318. [DOI] [PubMed] [Google Scholar]
- 6. Graf T, Flammer J, Prunte C & Hendrickson P. Gliosis‐like retinal alterations in glaucoma patients. J Glaucoma 1993; 2: 257–259. [PubMed] [Google Scholar]
- 7. Grieshaber MC, Orgul S, Schoetzau A & Flammer J. Relationship between retinal glial cell activation in glaucoma and vascular dysregulation. J Glaucoma 2007; 16: 215–219. [DOI] [PubMed] [Google Scholar]
- 8. Ashimatey BS, King BJ & Swanson WH. Retinal putative glial alterations: implication for glaucoma care. Ophthalmic Physiol Opt 2018; 38: 56–65. [DOI] [PMC free article] [PubMed] [Google Scholar]
- 9. Wang L, Cioffi GA, Cull G, Dong J & Fortune B. Immunohistologic evidence for retinal glial cell changes in human glaucoma. Invest Ophthalmol Vis Sci 2002; 43: 1088–1094. [PubMed] [Google Scholar]
- 10. Xue LP, Lu J, Cao Q, Hu S, Ding P & Ling EA. Muller glial cells express nestin coupled with glial fibrillary acidic protein in experimentally induced glaucoma in the rat retina. Neuroscience 2006; 139: 723–732. [DOI] [PubMed] [Google Scholar]
- 11. Ostrow LW, Suchyna TM & Sachs F. Stretch induced endothelin‐1 secretion by adult rat astrocytes involves calcium influx via stretch‐activated ion channels (SACs). Biochem Biophys Res Comm 2011; 410: 81–86. [DOI] [PMC free article] [PubMed] [Google Scholar]
- 12. Napper GA & Kalloniatis M. Neurochemical changes following postmortem ischemia in the rat retina. Vis Neurosci 1999; 16: 1169–1180. [DOI] [PubMed] [Google Scholar]
- 13. de Raad S, Szczesny PJ, Munz K & Reme CE. Light damage in the rat retina: glial fibrillary acidic protein accumulates in Muller cells in correlation with photoreceptor damage. Ophthalmic Res 1996; 28: 99–107. [DOI] [PubMed] [Google Scholar]
- 14. Yoshida A, Ishiguro S & Tamai M. Expression of glial fibrillary acidic protein in rabbit Muller cells after lensectomy‐vitrectomy. Invest Ophthalmol Vis Sci 1993; 34: 3154–3160. [PubMed] [Google Scholar]
- 15. Formichella CR, Abella SK, Sims SM, Cathcart HM & Sappington RM. Astrocyte reactivity: a biomarker for retinal ganglion cell health in retinal neurodegeneration. J Clin Cell Immunol 2014; 5: 188. [DOI] [PMC free article] [PubMed] [Google Scholar]
- 16. Son JL, Soto I, Oglesby E et al Glaucomatous optic nerve injury involves early astrocyte reactivity and late oligodendrocyte loss. Glia 2010; 58: 780–789. [DOI] [PubMed] [Google Scholar]
- 17. Nutzi C, Schotzau A & Grieshaber MC. Structure and function relationship of activated retinal glia in primary open‐angle glaucoma patients. J Ophthalmol 2017; 2017: 7043752. [DOI] [PMC free article] [PubMed] [Google Scholar]
- 18. Edwards MM, McLeod DS, Bhutto IA, Villalonga MB, Seddon JM & Lutty GA. Idiopathic preretinal glia in aging and age‐related macular degeneration. Exp Eye Res 2016; 150: 44–61. [DOI] [PMC free article] [PubMed] [Google Scholar]
- 19. Scoles D, Higgins BP, Cooper RF et al Microscopic inner retinal hyper‐reflective phenotypes in retinal and neurologic disease. Invest Ophthalmol Vis Sci 2014; 55: 4015–4029. [DOI] [PMC free article] [PubMed] [Google Scholar]
- 20. Chong RS & Martin KR. Glial cell interactions and glaucoma. Curr Opin Ophthalmol 2015; 26: 73–77. [DOI] [PMC free article] [PubMed] [Google Scholar]
- 21. Wolter JR. Glia of the human retina. Am J Ophthalmol 1959; 48: 370–393. [DOI] [PubMed] [Google Scholar]
- 22. Schnitzer J. Astrocytes in the guinea pig, horse, and monkey retina: their occurrence coincides with the presence of blood vessels. Glia 1988; 1: 74–89. [DOI] [PubMed] [Google Scholar]
- 23. Hirasawa K, Shoji N, Morita T & Shimizu K. A modified glaucoma staging system based on visual field index. Graefe's Arch Clin Exp Ophthalmol 2013; 251: 2747–2752. [DOI] [PubMed] [Google Scholar]
- 24. Schwab C, Glatz W, Schmidt B et al Prevalence of posterior vitreous detachment in glaucoma patients and controls. Acta Ophthalmol 2017; 95: 276–280. [DOI] [PubMed] [Google Scholar]
- 25. Hood DC, Fortune B, Mavrommatis MA et al Details of glaucomatous damage are better seen on OCT en face images than on OCT retinal nerve fiber layer thickness maps. Invest Ophthalmol Vis Sci 2015; 56: 6208–6216. [DOI] [PMC free article] [PubMed] [Google Scholar]
- 26. King BJ, Swanson WH, Klemencic SA et al Assessing the impact of en face retinal nerve fiber layer imaging on clinical decision making for glaucoma suspects. Optom Vis Sci 2020; 97: 54–61. [DOI] [PMC free article] [PubMed] [Google Scholar]
- 27. Sakamoto M, Mori S, Ueda K et al En face slab images visualize nerve fibers with residual visual sensitivity in significantly thinned macular areas of advanced glaucomatous eyes. Invest Ophthalmol Vis Sci 2019; 60: 2811–2821. [DOI] [PubMed] [Google Scholar]
- 28. Alluwimi MS, Swanson WH, Malinovsky VE & King BJ. Customizing perimetric locations based on en face images of retinal nerve fiber bundles with glaucomatous damage. Transl Vis Sci Technol 2018; 7: 5. [DOI] [PMC free article] [PubMed] [Google Scholar]
- 29. Ashimatey BS, King BJ, Burns SA & Swanson WH. Evaluating glaucomatous abnormality in peripapillary optical coherence tomography enface visualisation of the retinal nerve fibre layer reflectance. Ophthalmic Physiol Opt 2018; 38: 376–388. [DOI] [PMC free article] [PubMed] [Google Scholar]


