Abstract
Aim
This study was conducted to investigate the effects of sex hormone‐binding globulin (SHBG) on glucose metabolism and insulin resistance in human placental trophoblasts and involvement of the cAMP/PKA/CREB1 signaling pathway in these effects.
Methods
An insulin resistance cell model of human trophoblasts was established. An SHBG‐overexpression plasmid was transfected into these cells, and the expression of glucose transporter 1 (GLUT1), CREB and p‐CREB was detected and analyzed in normal cells, model cells and all groups of transfected cells by real‐time PCR and western blotting; cAMP, PKA, glucose consumption and pyruvic acid levels were also detected.
Results
Among the four groups, there was no significant difference in the expression of CREB mRNA or GLUT1 mRNA (P > 0.05); however, CREB, p‐CREB, GLUT1 protein, cAMP and PKA showed low expression (P < 0.05) and cell glucose consumption and pyruvate production were decreased (P < 0.05) in the model group, compared to the normal group. SHBG overexpression in insulin‐resistant cells partially increased the levels of p‐CREB, GLUT1, cAMP and PKA (P < 0.05). Intracellular glucose consumption and pyruvate production were nearly restored to the levels observed in cells from the normal group.
Conclusion
Sex hormone‐binding globulin regulates GLUT1 expression via the cAMP/PKA/CREB1 pathway and affects glucose transport in the placenta, which can induce insulin resistance and gestational diabetes.
Keywords: cAMP/PKA/CREB1, glucose metabolism, GLUT1, insulin resistance, sex hormone‐binding globulin
Introduction
Gestational diabetes mellitus (GDM) occurs when abnormal glucose tolerance develops during pregnancy, which can cause many complications. 1 The pathogenesis of GDM involves complex molecular mechanisms. Among them, abnormal placental synthesis and secretion can mediate insulin‐antagonistic effects, such as those of human chorionic gonadotropin, human placental lactogen, progesterone and estrogen, 2 leading to insulin resistance and abnormal glucose metabolism. Recent studies showed that many other hormones secreted by the placenta are associated with insulin resistance and are independent risk factors for abnormal glucose metabolism. 3 Sex hormone‐binding globulin (SHBG) is a microglycoprotein that can bind to sex hormones, which are steroids. Most studies of SHBG in women have focused on the myocardium and endocrine metabolism. 4 The expression of SHBG is decreased in endocrine metabolism, polycystic ovary syndrome, 5 type 2 diabetes mellitus and other insulin‐related diseases, indicating that SHBG can be used as a biomarker for predicting the development of endocrine diseases. 6 Previous studies showed that SHBG plays an important role in the pathogenesis of GDM. A low level of SHBG is considered as a marker of insulin resistance. 7 , 8 However, in recent years, researchers have found that the placenta also contains autocrine SHBG; thus, we examined whether the function of autocrine SHBG in the placenta is related to endocrine diseases during pregnancy.
Glucose transporter 1 (GLUT1) is an important one‐way glucose transporter in the human body. Previous studies showed that GLUT1 is the main glucose transporter in the full‐term placenta and is responsible for glucose transport between maternal circulation and the placenta. 9 During pregnancy, when GLUT1 expression in the placenta is abnormal, the ability to utilize glucose is weakened, leading to insulin resistance, elevated maternal blood sugar levels and inadequate fetal glucose intake. These factors can eventually lead to GDM and intrauterine growth retardation. 10 , 11 , 12
Cyclic adenosine phosphate‐responsive element binding protein 1 (CREB1) is a protein that stimulates gene transcription as a transcription enhancer. CREB1 is involved in various cellular signaling pathways, the most classical being the cAMP/PKA pathway. Previous studies showed that regulation of GLUT1 expression by the cAMP/PKA/CREB1 signaling pathway can affect glucose transport in many types of cancer cells. 13 However, in GDM, it is currently unknown whether glucose transport in placental cells is affected by GLUT1 and the involvement of the cAMP/PKA/CREB1 signaling pathways. In this study, we examined the effect of SHBG on glucose transport and involvement of the cAMP/PKA/CREB1 pathway on these effects in vitro. GDM was evaluated at the molecular level in placental trophoblasts and an insulin resistance model of human placental trophoblasts (HTR8‐S/Vneo) was established. CREB1 was used as a new target to explore the effects of GLUT1 protein expression on glucose metabolism and insulin resistance in human placental trophoblasts.
Methods
Cell culture and model cell construction
Human placental trophoblasts (HTR8‐S/Vneo cell line) were purchased from ATCC. The cells were cultured in a 25‐mL flask in RPMI 1640 (Gibco) medium containing 10% fetal bovine serum (Gibco) at 37°C and 5% CO2 for 2–3 days, and passaged at a ratio of 1:3. After digestion of cells in the logarithmic phase, the cell density was adjusted to 2.5 × 10⁴ cells/mL. When the cells adhered to the cell monolayer, a membrane of insulin‐resistant cells was formed, as described by Feng et al. 14 Control group cells were cultured in normal growth medium (RPMI 1640), and freshly prepared insulin (Sigma–Aldrich) was added to the cells in the experimental group at concentrations of 10−5, 10−6, 10−7 and 10−8 mol/L medium, followed by incubation for 24 h at 37°C and 5% CO2. The culture supernatant was obtained, and the glucose content was determined with a glucose‐hexokinase kit. An MTT assay (Jiancheng) was performed to evaluate cell viability. To select the best insulin concentration to establish a cell model of insulin resistance, HTR8‐S/Vneo cells were treated with increasing hormone concentrations.
Transfection and cell groups
To construct a plasmid encoding the SHBG gene, a pcDNA vector encoding the SHBG transcript was cloned in a pEX‐4 vector tagged with green fluorescence protein. The plasmid was purchased from Biomed (Beijing, China). The established insulin‐resistant cell model was transfected with the pEX‐4‐SHBG plasmid using a Lipofectamine 3000 kit (Invitrogen). Successfully transfected cells were observed by inverted fluorescence microscopy. The cells were confirmed to overexpress SHBG by western blot analysis and used in subsequent experiments. The cells were divided into four groups: normal cell group, insulin‐resistant model cell group, model cells transfected with empty plasmid group and model cells transfected with SHBG plasmid group.
Real‐time PCR
Total RNA was extracted using Trizol reagent (Takara), and 1 μL of total RNA was reverse‐transcribed into cDNA using the PrimeScript RT Reagent Kit with gDNA Eraser (Takara). Next, 2 μL cDNA was used in a 20‐μL reaction with the SYBR Premix EX Taq II Kit (Takara) and ABI 7500 fast Real‐Time PCR System (Applied Biosystems). The reaction conditions were as follows: 95°C for 30 s, followed by 40 cycles at 95°C for 5 s and 60°C for 34 s, with fluorescence signals measured during the reaction process. Targeted genes were amplified with the specific primers shown in Table 1.
Table 1.
Primers used for RT‐PCR
| Gene | Forward | Reverse |
|---|---|---|
| CREB1 | 5′‐CCTGCCATCACCACTGTAACG‐3′ | 5′‐GAGTGGCTGCTGCATTGGTC‐3′ |
| GLUT1 | 5′‐TGCTGATGATGAACCTGCTG‐3′ | 5′‐GATGAGGATGCCGACGAC‐3′ |
| β‐Actin | 5′‐AGCACAATGAAGATCAAGATCAT‐3′ | 5′‐ACTCGTCATACTCCTGCTTGC‐3′ |
Western blotting
Total proteins were extracted using Lysis Buffer (Beyotime), and the protein concentration was quantified with the BCA Assay Kit (Beyotime). The extracted proteins were subjected to SDS‐PAGE and transferred to a nitrocellulose membrane. Primary antibodies against SHBG (Abcam, ab119436), GLUT1 (Abcam, ab115730), CREB1 (Cell Signaling Technology, 9197), and p‐CREB (Cell Signaling Technology, 9198) were diluted with phosphate‐buffered saline containing Tween‐20 0.05% at a ratio of 1:1000 and incubated at 4°C overnight. Secondary antibodies (goat anti‐rabbit IgG, Proteintech) were diluted (1:2000) and incubated with the membrane at room temperature for 90 min. An electrochemiluminescence detection kit (Millipore) was used for staining and imaging.
cAMP and PKA activity and glucose metabolites
After transferring the four groups of treated cells into a 96‐well plate, 1 mM IBMX was added to the medium and the cells were incubated for 1 h. A cAMP assay was performed according to the cAMP‐Glo Assay Kit (Sigma–Aldrich) instructions. The cells were induced with a test compound for 1 h to modulate cAMP levels. After induction, the cells were lysed to release cAMP, and then cAMP Detection Solution, which contains protein kinase A, was added. Kinase‐Glo Reagent was added to terminate the PKA reaction and detect the remaining ATP via a luciferase assay. Luminescence was correlated with the cAMP concentrations by using a cAMP standard curve.
For PKA detection, the cells were washed with phosphate‐buffered saline, and then the buffer was completely removed. The cells were suspended in 0.5 mL of cold PKA extraction buffer and homogenized using a cold homogenizer for 10 min. The lysates were collected and centrifuged for 5 min at 4°C at 14 000 × g in a microcentrifuge to obtain the supernatant. PKA activity was tested by using the PepTag Assay for Non‐Radioactive Detection of Protein Kinase C or cAMP‐Dependent Protein Kinase (Sigma–Aldrich). The optical density was measured at 450 nm. To analyze the glucose metabolites, we detected intracellular glucose using the glucose‐hexokinase method as described above. The culture supernatant was obtained, and pyruvic acid was evaluated with a pyruvate test kit (Jiancheng). The optical density was measured at 505 nm.
Statistical analyses
spss 22.0 software (SPSS, Inc.) was used for statistical analyses. The relative expression of the investigated factors was expressed as the mean ± standard deviation. Independent sample t‐test was used to compare differences between two groups. One way anova was used for the comparison between multiple groups. P < 0.05 was defined as statistically significant.
Results
Establishment of insulin resistance cell model
Compared to the control group, hormone concentrations showing minimal effects on intracellular glucose content and cell survival rate (i.e., no significant difference) indicated that the concentration induced insulin resistance. When the concentration of insulin was 1 × 10⁻⁸ mol/L, there was no significant difference in the cell glucose content or cell viability (P > 0.05). Thus, induction with insulin at 1 × 10⁻⁸ mol/L for 24 h was the optimal condition for preparing the insulin resistance cell model (Table 2).
Table 2.
Absorbance value, cell viability, and glucose content after 24 h following the treatment of the cells with different insulin concentrations (, n = 6)
| Insulin (mol/L) | Absorbance A | Glucose (mmol/L) | Viability |
|---|---|---|---|
| Control group | 0.372 ± 0.01 | 3.20 ± 0.09 | — |
| 10−5 | 0.357 ± 0.03* | 2.559 ± 1.27* | 0.91 ± 0.11* |
| 10−6 | 0.351 ± 0.02* | 2.518 ± 1.24* | 0.93 ± 0.07* |
| 10−7 | 0.367 ± 0.02 | 3.163 ± 0.24 | 0.89 ± 0.06* |
| 10−8 | 0.376 ± 0.02 | 3.240 ± 1.33 | 0.98 ± 0.07 |
P < 0.05.
Transfection of HTR8‐S/Vneo insulin resistance model cells
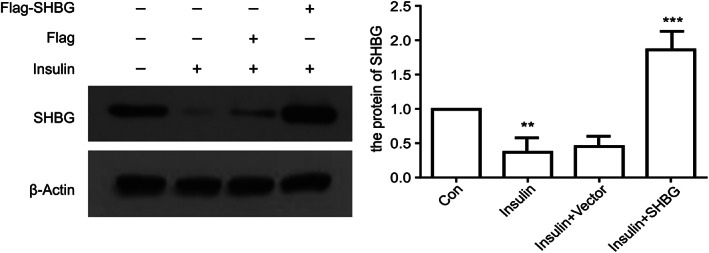
The transfection efficiency of SHBG was detected by western blot analysis after transfection for 24 h (Fig. 1). Protein expression levels are expressed as means ± SD of three experiments for each condition determined using densitometry relative to β‐actin expression. We found that the SHBG content in resistant model cells was significantly lower than that in normal cells (P < 0.05) but was significantly higher in transfected model cells (P < 0.05).
Figure 1.

Confirmation of SHBG overexpression by western blotting analysis after 24 h of transfection (means ± SD; n = 3 independent experiments; one way anova; **P < 0.05, ***P < 0.01).
Analysis of mRNA levels of CREB and GLUT1
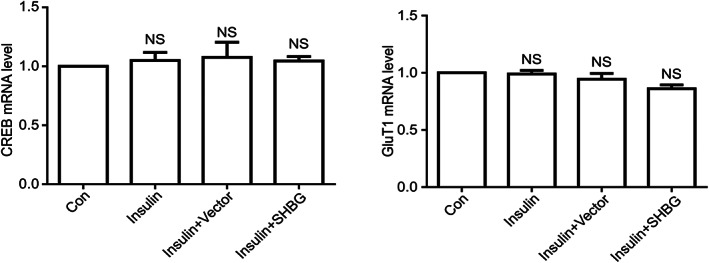
Real‐time detection of CREB and GLUT1 levels was performed on the four groups of cells: normal cells, insulin resistance model cells, model cells + empty plasmid, and model cells + SHBG plasmid. The relative mRNA content was calculated using β‐actin gene expression as an internal reference. Notably, β‐actin was used as a reference gene for real‐time PCR analyses because it is found in most tissues and cells and is widely distributed and shows high expression in the cytoplasm. The results revealed no significant difference in the expression of CREB mRNA and GLUT1 mRNA among the four groups (P > 0.05) (Fig. 2).
Figure 2.

Relative mRNA expression of CREB and GLUT1 in four groups of cells: normal cells, insulin resistance model cells, model cells + empty plasmid and model cells + SHBG‐overexpression plasmid. Relative mRNA levels were quantified by real‐time qPCR (means ± SD; n = 3 independent experiments; one way anova; **P < 0.05).
Analysis of protein levels of CREB and GLUT1
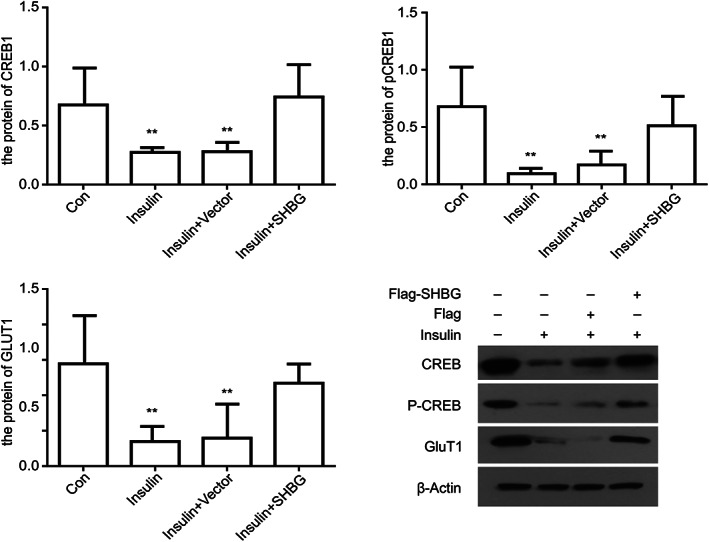
The protein levels of CREB, pCREB and GLUT1 in the insulin‐resistant cell model group and cell transfection group were significantly lower than those in the control group (P < 0.05). However, there was no significant difference between the contents of CREB, pCREB and GLUT1 in insulin‐resistant cells transfected with SHBG plasmid (P > 0.05) (Fig. 3).
Figure 3.

Relative protein expression of CREB, pCREB and GLUT1 in four groups of cells: normal cells, insulin resistance model cells, model cells + no load and model cells + SHBG. All groups of cells were immunoblotted with the indicated antibodies (means ± SD; n = 3 independent experiments; one way anova; **P < 0.05).
Analysis of cAMP PKA content and glucose metabolites
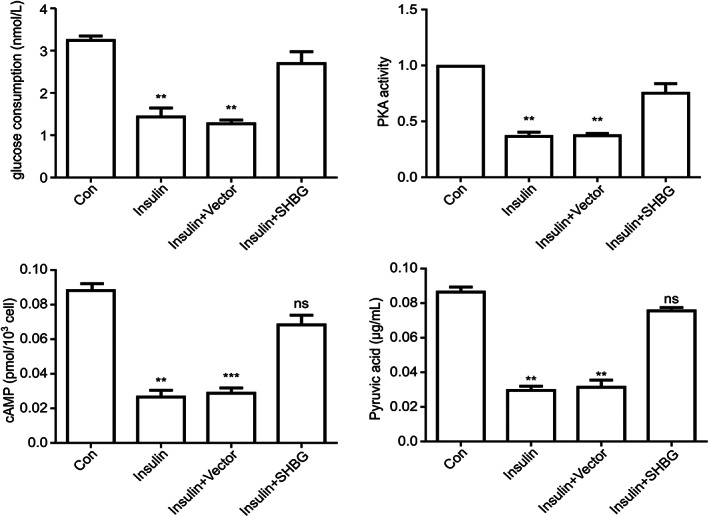
Compared to the normal cell group, glucose consumption and pyruvate production in insulin resistance model cells were significantly decreased (P < 0.05). There was no significant difference in glucose consumption and pyruvate content between the insulin resistance model cell and normal cell groups after transfection of the SHBG vector (Fig. 4) (P > 0.05).
Figure 4.

Expression of cAMP and PKA and glucose consumption and pyruvate production in the four groups of cells (means ± SD; n = 3 independent experiments; one way anova; **P < 0.05, ***P < 0.01).
Discussion
Sex hormone‐binding globulin not only binds and transports sex hormones, but also plays an important biological role as a cytokine. Recent studies showed that SHBG is independently related to the occurrence of GDM, and plasma SHBG is important for the diagnosis and prognosis of the disease. 15 , 16 SHBG can be secreted by hormone‐dependent organs such as the liver, testis and ovary. The production of SHBG is regulated by many factors, such as hormones, nutrition and metabolic factors. 17 However, in vitro experiments showed 3 that HTR8‐S/Vneo cell lines can also express SHBG in the cell membrane and cytoplasm. It is also predicted that the placenta is a secretory organ for SHBG. In our study, trophoblasts were regulated by SHBG in an autocrine manner, and SHBG expression in the cells was lower under insulin resistance. Thus, physiological insulin resistance in pregnancy may affect the autocrine function of SHBG in the placenta.
Previous studies showed that SHBG binding to its cell receptors can promote the release of the second messenger cAMP. However, no further studies were conducted to determine the effects of this signaling pathway and its possible effects in the placenta. Activation of the cAMP signaling pathway can enhance the replication and function of many endocrine cells and regulate cell differentiation, growth, metabolism and apoptosis. 18 Therefore, changes in the cAMP signaling pathway can result in many endocrine diseases.
The placenta is a large endocrine organ formed during pregnancy. Abnormal glucose metabolism in the placenta may affect both glucose metabolism in pregnant women and fetal glucose uptake, which affect fetal energy supply. Thus, we evaluated whether SHBG can also cause endocrine changes in trophoblasts after promoting the release of cAMP, which may lead to some endocrine diseases. HTR8‐S/Vneo cells are noncancer cells derived from human extravillous trophoblast cells and share many characteristics (e.g., invasion mechanism and morphology) with these cells. Notably, the HTR8‐S/Vneo cell line is a widely used model for studying gestational trophoblast cells because of their similar physiological environment. We prepared an HTR8‐S/Vneo trophoblast cell model of insulin resistance by simulating insulin resistance in gestational diabetes at the cellular level. Previously, most cell models of insulin resistance were based on hepatocytes, and most were stimulated by high concentrations of insulin. The results showed that an insulin concentration of 10−8 mol/L stimulated trophoblast cells to produce insulin resistance, which may be related to the characteristics of trophoblast cells. Placental trophoblastic cells are endocrine cells that secrete large amounts of human chorionic gonadotropin, progesterone and estrogen, among other hormones, which have an antagonizing effect on insulin.
To further examine the function of SHBG, we transfected an SHBG‐overexpression plasmid into insulin resistance model cells. We found that SHBG overexpression activated the release of cAMP and increased the expression of PKA and CREB1, thereby promoting the phosphorylation of CREB1. In contrast, we found that in SHBG‐overexpressing cells, GLUT1 protein expression was increased and the intracellular glucose content was decreased, indicating that cell glucose consumption and the pyruvate among glucose metabolites increases, resulting in increased intracellular glucose utilization. In the present study, the expression of CREB1 and GLUT1 in model cells transfected with SHBG plasmid was upregulated, suggesting that the expression of GLUT1 in trophoblasts is regulated by phosphorylated CREB1. Additionally, SHBG can activate and phosphorylate CREB1 through the cAMP/PKA/CREB1 pathway, thus regulating the expression of GLUT1 protein.
CREB1 is a transcription factor in the nucleus that is activated by phosphorylation. The main signaling pathway for phosphorylation of CREB1 is the cAMP signaling pathway. Other reports showed that CREB1 is closely related to the occurrence and development of various metabolic and tumorigenic diseases. Xu et al. 19 suggested that genetic variation in the CREB1 gene is associated with the risk of diabetes and plays an important role in glucose metabolism and insulin secretion in a Chinese population. A study by another group, which used RNA interference technology to downregulate the expression of CREB1 in glioma cell lines, showed results similar to those of the present study. Their results showed that downregulation of CREB1 reduced the expression of GLUT1 and decreased the glucose‐absorption ability of glioma cell lines. 20 In our study, the increased expression of phosphorylated CREB1 and GLUT1 in SHBG‐transfected cells suggests that pCREB1 regulates the expression of GLUT1 at the protein level but not the mRNA level. It is also likely that GLUT1 is not regulated at the RNA transcription level, but rather by other means such as posttranscriptional regulation. However, some results were inconsistent with our findings. Chong et al. 21 found that SHBG expression in trophoblast cells was correlated with insulin resistance and glucose transporter expression but negatively correlated with GLUT1. Thus, clinical case studies are needed to determine the correlation between GDM and the content of GLUT1 in the placenta. Additionally, GLUT1 expression may be regulated by many factors. In placental trophoblasts, previous studies showed that insulin‐like growth factor can regulate the expression of GLUT1 in human trophoblasts. 22 In addition, many types of glucose transporters exist, though we only studied GLUT1 in this study. Specifically, GLUT3 and GLUT4 are glucose transporters also found in the placenta. Future studies should investigate alternative glucose transporters such as GLUT3 and GLUT4 to determine if the effects observed in the present study are consistent across other glucose transporters. These findings may also affect the glucose utilization of placental cells.
In conclusion, we found that SHBG in the placenta can activate the cAMP/PKA/CREB1 pathway, which regulates the expression of GLUT1 by phosphorylating CREB1 to yield pCREB1 and affects cell glucose absorption and metabolism, thereby improving insulin resistance and reducing maternal blood sugar levels. Thus, SHBG may affect the incidence and pregnancy outcomes of GDM. However, clinical trials are needed to determine whether changes in glucose transporters in the plasma are related to fetal development.
Disclosure
None declared.
Acknowledgments
X. C. executed the study and drafted the manuscript, Z. J. designed the study, C. F. analyzed the experimental data and X. W. made the critical discussion. This study was supported by the National Natural Science Foundation of China (Nos. 81300511 and 81170591).
References
- 1. Wahlberg J, Ekman B, Nyström L, Hanson U, Persson B, Arngvist HJ. Gestational diabetes: Glycaemic predictors for fetal macrosomia and maternal risk of future diabetes. Diabetes Res Clin Pract 2016; 114: 99–105. [DOI] [PubMed] [Google Scholar]
- 2. Vitoratos N, Deliveliotou A, Dimitrakaki A et al Maternal serum resistin concentrations in gestational diabetes mellitus and normal pregnancies. J Obstet Gynaecol Res 2011; 37: 112–118. [DOI] [PubMed] [Google Scholar]
- 3. Feng C, Chi XS, Zhang B et al SHBG expression is correlated with PI3K/AKT pathway activity in a cellular model of human insulin resistance. Gynecol Endocrinol 2018; 34: 567–573. [DOI] [PubMed] [Google Scholar]
- 4. Al Essa HB, Malik VS, Yuan C. Dietary patterns and cardiometabolic and endocrine plasma biomarkers in US women. Am J Clin Nutr 2017; 105: 432–441. [DOI] [PMC free article] [PubMed] [Google Scholar]
- 5. Keevil BG, Adaway J, Fiers T, Moghetti P, Kaufman JM. The free androgen index is inaccurate in women when the SHBG concentration is low. Clin Endocrinol (Oxf) 2018; 88: 706–710. [DOI] [PubMed] [Google Scholar]
- 6. Zhang X, Sun L, Jin Z. Effect of placental sex hormone‐binding globulin single nucleotide polymorphism rs6259 on protein and function in gestational diabetes mellitus. Int J Mol Med 2018; 41: 2927–2934. [DOI] [PubMed] [Google Scholar]
- 7. Sun L, Jin Z, Teng W et al SHBG in GDM maternal serum, placental tissues and umbilical cord serum expression changes and its significance. Diabetes Res Clin Pract 2013; 99: 168–173. [DOI] [PubMed] [Google Scholar]
- 8. Hedderson MM, Xu F, Darbinian JA et al Prepregnancy SHBG concentrations and risk for subsequently developing gestational diabetes mellitus. Diabetes Care 2014; 37: 1296–1303. [DOI] [PMC free article] [PubMed] [Google Scholar]
- 9. Park MS. Molecular dynamics stimulations of the human glucose transporter GLUT1. PLoS One 2015; 10: e0125361. [DOI] [PMC free article] [PubMed] [Google Scholar]
- 10. Acosta O, Ramirezy VI, Lager S et al Increased glucose and placental GLUT‐1 in large infants of obese nondiabetic mothers. Am J Obestet Gynecol 2015; 212: 227.e1–227.e7. [DOI] [PubMed] [Google Scholar]
- 11. Lüscher BP, Marini C, Joerger‐Messerli MS et al Placental glucose transporter (GLUT)‐1 is down‐regulated in preeclampsia. Placenta 2017; 55: 94–99. [DOI] [PubMed] [Google Scholar]
- 12. Stanirowski PJ, Szukiewicz D, Pyzlak M. Analysis of correlations between the placental expression of glucose transporters GLUT‐1, GLUT‐4 and GLUT‐9 and selected maternal and fetal parameters in pregnancies complicated by diabetes mellitus. J Matern Fetal Neonatal Med 2019; 32: 650–659. [DOI] [PubMed] [Google Scholar]
- 13. Linnerth NM, Baldwin M, Campbell C, Brown M, McGowan H, Moorehead RA. IGF‐II induces CREB phosphorylation and cell survival in human lung cancer cells. Oncogene 2005; 24: 7310–7319. [DOI] [PubMed] [Google Scholar]
- 14. Feng C, Jin Z, Fan JH et al Establishment of placental trophoblastic cells model of insulin resistance. Chin J Birth Health Heredity 2016; 24: 49–51. [Google Scholar]
- 15. Smirnakis KV, Plati A, Wolf M, Thadhani R, Ecker JL. Predicting gestational diabetes: Choosing the optimal early serum marker. Am J Obstet Gynecol 2007; 196: 410. [DOI] [PubMed] [Google Scholar]
- 16. Zhang B, Jin Z, Sun L et al Expression and correlation of sex hormone‐binding globulin and insulin signal transduction and glucose transporter proteins in gestational diabetes mellitus placental tissue. Diabetes Res Clin Pract 2016; 119: 106–117. [DOI] [PubMed] [Google Scholar]
- 17. Burke CW, Anderson DC. Sex‐hormone‐binding globulin is an estrogen amplifier. Nature 1972; 240: 38–40. [DOI] [PubMed] [Google Scholar]
- 18. Kim MO, Lee YJ, Park JH, Ryu JM, Yun SP, Han HJ. PKA and cAMP stimulate proliferation of mouse embryonic stem cells by elevating GLUT1 expression mediated by the NF‐κB and CREB/CBP signaling pathways. Biochim Biophys Acta 2012; 1820: 1636–1646. [DOI] [PubMed] [Google Scholar]
- 19. Xu Y, Song R, Long W et al CREB1 functional polymorphisms modulating promoter transcriptional activity are associated with type 2 diabetes mellitus risk in Chinese population. Gene 2018; 665: 133–140. [DOI] [PubMed] [Google Scholar]
- 20. Chen J, Zhang C, Mi Y, Chen F, Du D. CREB1 regulates glucose transport of glioma cell line U87 by targeting GLUT1. Mol Cell Biochem 2017; 436: 79–86. [DOI] [PubMed] [Google Scholar]
- 21. Chong F, Zhen J, Lei S et al Endogenous SHBG levels correlate with that of glucose transporters in insulin resistance model cells. Mol Biol Rep 2019; 46: 4953–4965. [DOI] [PubMed] [Google Scholar]
- 22. Baumann MU, Schneider H, Male KA et al Regulation of human trophoblast GLUT1 glucose transporter by insulin‐like growth factor I (IGF‐I). PLoS One 2014; 9: 106. [DOI] [PMC free article] [PubMed] [Google Scholar]


