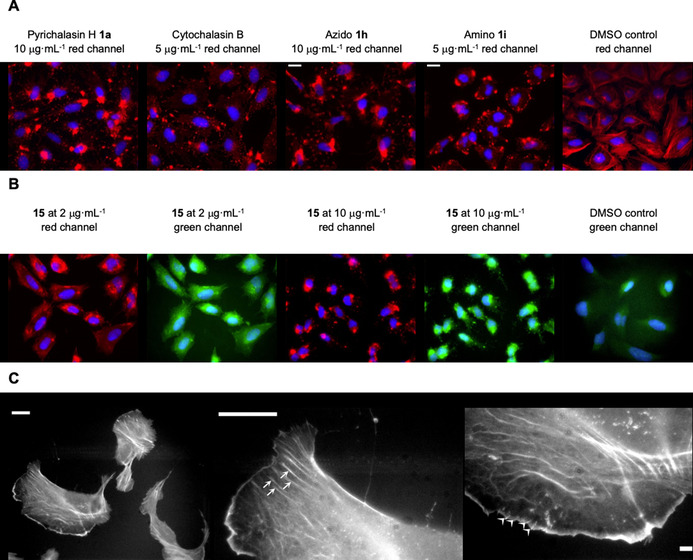
Figure 1.

Cell treatment and staining assays with cytochalasin derivatives. A) Actin disruption assay with selected compounds (or DMSO as control), treated at concentrations as indicated and for 1 h, followed by cell fixation and staining of the actin cytoskeleton with fluorescently labelled phalloidin (red) and DAPI for cell nuclei (blue). B) Actin cytoskeleton disruption with the coumarin‐tagged cytochalasin derivative (compound 15) at different concentrations, as indicated. Panels show coumarin fluorescence (pseudo‐coloured in green) and phalloidin (red) as well as DAPI in blue. Note significant co‐localization of the coumarin derivative with phalloidin‐stained actin aggregates. C) Single‐staining experiment with 17 after fixation of non‐treated U2OS cells. The left panel shows an overview image of several cells, whereas the middle and right panels display close‐ups of parts of a selected cell in the left panel. Stress fibres (middle panel) and microspike bundles embedded into lamellipodia (right) are highlighted with arrows and arrowheads, respectively. All scale bars in A)–C) correspond to 20 μm.
