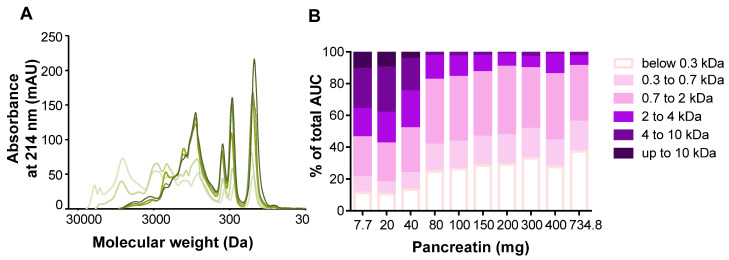
Figure 1.
Molecular weight profiles and distributions of W intestinal digests: optimization of the static gastrointestinal digestion (SGID). (A) Peptide profiles were obtained by size exclusion chromatography-fast protein liquid chromatography (SEC-FPLC): 7.7, 20, 200, 400, and 734.8 mg of pancreatin (light to dark green curves). (B) The apparent molecular weight distribution of peptides, expressed in percentage of total area under the curve (AUC), was calculated from the linear regression relationship, which correlates the Log of known molecular weight standard peptides and the elution volume.

