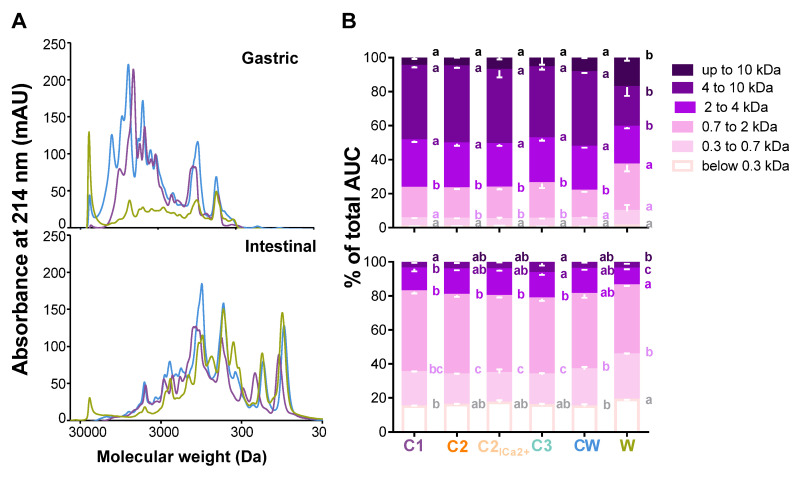
Figure 3.
Molecular weight profiles and distributions of the gastric and intestinal digests of the different matrices: (A) peptide profiles were obtained by size-exclusion chromatography-fast protein liquid chromatography (SEC-FPLC): W (green curve), CW (dark blue curve), C1 (purple curve), 2-h gastric digests (top), and 2-h intestinal digests (bottom). (B) The mean (±SD) molecular weight distribution of peptides in the different compartment of the SGID, expressed in percentage of total area under the curve (AUC), was calculated from the linear regression relationship which correlates the Log of known molecular weight standard peptides and the elution volume. In a same molecular weight range, bars with different lowercase letters are significantly different (p < 0.05, one-way ANOVA).

