Abstract
Novel coronavirus (COVID-19) is started from Wuhan (City in China), and is rapidly spreading among people living in other countries. Today, around 215 countries are affected by COVID-19 disease. WHO announced approximately number of cases 11,274,600 worldwide. Due to rapidly rising cases daily in the hospitals, there are a limited number of resources available to control COVID-19 disease. Therefore, it is essential to develop an accurate diagnosis of COVID-19 disease. Early diagnosis of COVID-19 patients is important for preventing the disease from spreading to others. In this paper, we proposed a deep learning based approach that can differentiate COVID- 19 disease patients from viral pneumonia, bacterial pneumonia, and healthy (normal) cases. In this approach, deep transfer learning is adopted. We used binary and multi-class dataset which is categorized in four types for experimentation: (i) Collection of 728 X-ray images including 224 images with confirmed COVID-19 disease and 504 normal condition images (ii) Collection of 1428 X-ray images including 224 images with confirmed COVID-19 disease, 700 images with confirmed common bacterial pneumonia, and 504 normal condition images. (iii) Collections of 1442 X- ray images including 224 images with confirmed COVID-19 disease, 714 images with confirmed bacterial and viral pneumonia, and 504 images of normal conditions (iv) Collections of 5232 X- ray images including 2358 images with confirmed bacterial and 1345 with viral pneumonia, and 1346 images of normal conditions. In this paper, we have used nine convolutional neural network based architecture (AlexNet, GoogleNet, ResNet-50, Se-ResNet-50, DenseNet121, Inception V4, Inception ResNet V2, ResNeXt-50, and Se-ResNeXt-50). Experimental results indicate that the pre trained model Se-ResNeXt-50 achieves the highest classification accuracy of 99.32% for binary class and 97.55% for multi-class among all pre-trained models.
Keywords: Automatic detections, Coronavirus, Pneumonia, Chest X-ray radiographs, Convolutional neural network, Deep transfer learning
Introduction
In December 2019 the novel coronavirus disease (COVID-19) originated as a new species which is not previously found in humans. The new COVID-19 virus increases the serious pneumonia infections, and has spread widely from Wuhan City, across China, and now to more than 215 countries. Now it is becoming a worldwide serious public health issue [1]. WHO announced the COVID-19 outbreak a pandemic on March 11, the first of its kind since the 2009 Swine Flu. Internationally, as of mid-March, 2020, because of COVID-19 more than 150,000 cases found and nearly 6000 people died (https://www.who.int/emergencies/diseases/novel-coronavirus-2019). Currently, the total number of confirmed coronavirus cases is approximately 11,274,600, died are 530,522, and recovered are 6,387,345. Also, number of infected patients’ is 4,356,733. On the other hand, disease surviving the number of infected patients are 4,297,914 (99%) and serious or critical condition patients are 58,819 (1%) (https://www.worldometers.info/coronavirus/).
COVID-19 is currently the biggest health, economical, and survival threat to the entire human race. We are in urgent need to find solutions, treatment, and develop vaccines to combat it. One challenge in developing effective antibodies and vaccines for COVID-19 is that we do not yet understand this virus. How far away is it from other coronaviruses? Has it undergone any changes since its first discovery? These questions are critical for us to find cures and design effective vaccines and critical for managing this virus.
Infection signs involve symptoms of nausea, cough, and inhalation. In progressively genuine cases, the disease can be a reason for pneumonia, serious intense respiratory disorder, multi-organ disappointment, and sometimes death in bad conditions (https://www.who.int/emergencies/diseases/novel-coronavirus-2019) [2]. The rate of COVID-19 pneumonia cases is very faster than normal flue people [3]. Therefore many developed countries are facing breakdown due to the increasing requirement of intensive care units for health systems. The isolation ward and care units of hospitals are occupied with COVID-19 patients.
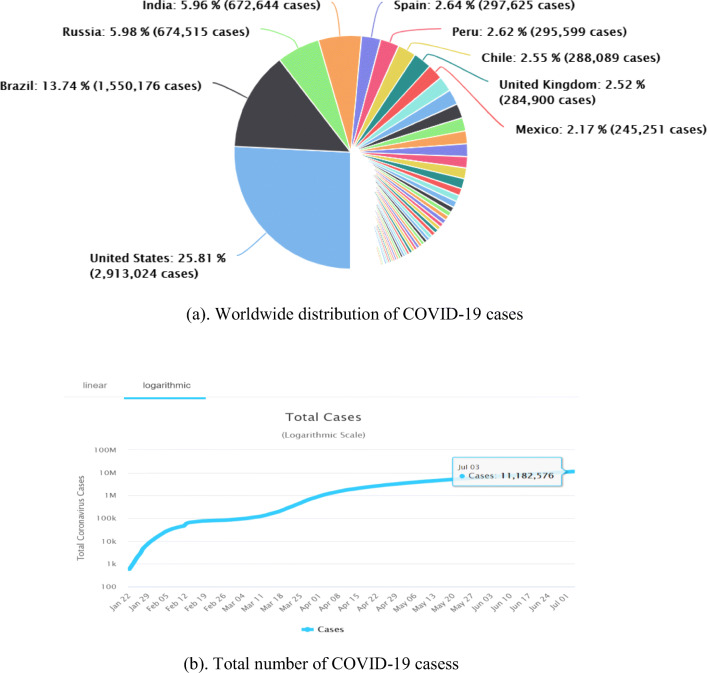
The distribution of COVID-19 cases are showing in Fig. 1 between the days of 22nd January to 3rd July 2020 for worldwide.
Fig. 1.
Worldwide distribution of COVID-19 cases (22nd January to 3rd July 2020). (a). Worldwide distribution of COVID-19 cases. (b). Total number of COVID-19 cases
Severe acute respiratory syndrome coronavirus 2 (SARS-CoV-2) is a positive-sense single-stranded RNA virus and that virus caused COVID-19 pandemic disease (https://www.worldometers.info/coronavirus/). Coronaviruses (CoV) contains a huge number of viruses which results in cold-related illnesses including Middle East Respiratory Syndrome (MERS-CoV) as well as Severe Acute Respiratory Syndrome (SARS-CoV) viruses (https://www.who.int/emergencies/diseases/novel-coronavirus-2019) [3].
In the Deep Learning approach, deep convolutional neural networks are the most famous network which is used for feature extraction. Feature extraction can be retrieved by the convolution process. The nonlinear information is stored in layers [5]. The revolution of the data into a more abstract and higher level is involved in each layer of CNN. The more composite information and knowledge can be discovered in the deep network.
Deep learning (DL) approaches on chest X-ray for COVID-19 classification have been actively explored [4]–[10]. Especially, Wang et al. [4] proposed an open source deep convolutional neural network platform called COVIDNet that is tailored for the detection of COVID-19 cases from chest radiography images. They claimed that COVIDNet can achieve good sensitivity for COVID-19 cases with 80% sensitivity. In [48], proposed CovidGAN: Data Augmentation Using Auxiliary Classifier GAN for Improved Covid-19 Detection. They have used convolutional neural networks (CNNs) to improve performance. Inspired by this early success, in these papers we aim to further investigate deep convolutional neural network and evaluate its feasibility for COVID-19 diagnosis. The motivation behind this exploration is to evaluate the performance of available convolutional neural networks introduced by researchers, related to the automatic diagnosis of COVID-19 from thoracic X-rays. Additionally, the motivation behind this investigation is to determine the practicality of top-tier pre-designed convolutionary neural frameworks which is discovered by knowledgeable researchers.
To accomplish this, a group of 6674 thoracic X-ray scans is being processed and used to train and test the CNNs. Since, the size of the COVID-19 related samples is small (224 images), deep transfer learning is the best strategy for deep CNNs training. This is because the state-of-the-art CNNs are complex methods that require huge datasets to achieve precise feature extraction and classification.
The findings are promising and validate the efficiency of deep learning, and more precisely transfer learning with CNNs to automatically detect irregular X-ray images from COVID-19 disease small datasets. Despite the drawbacks of the present analysis is that the unavailability of COVID-19 disease data which is opening the horizons for more advanced studies into the possible presence of COVID-19 related biomarkers in X-ray images. Datasets are now being identified and annotated in the case of a new disease, such as the coronavirus. There are very few information sources are available for coronavirus data. Similarly, very few experts are available for identifying the data from a particular new strain of the infection in people.
Our aim is to propose automated coronavirus CT image analysis tools using deep-learning approaches. Results show that the differentiation of coronavirus affected patients from normal patient who are infected by normal flu only. These findings help in the location, estimations, and following of infection movement among people. A result of, continuously increasing the COVID-19 cases daily, available test equipment’s are not enough in hospitals/clinics. Therefore, it is essential to develop an automatic detection system as a fast solution to avoid transmission of COVID-19 between humans.
Rest of this paper is organized as follows: In Section 2, we discuss background of the work. Pre-trained neural networks and deep transfer learning models are discussed in Section 3. Dataset, experimental results, comparisons and contributions are described in Section 4. Finally, conclusion, limitations, and future works are summarized in Section 5.
Literature review
Coronavirus outbreak and spreading across the world since December 2019, and has become common in a variety of countries. Planning and actions from the government in response to the pandemic varied from country to country, and their role in impacting disease transmission was addressed.
Machine learning methods have been carried out to identify and detect COVID-19 disease from the last few months. Some of these are as follows: Fei et al. proposed a “VB-Net” deep learning system for automated segmentation of all lung and infection sites using CT in the chest [6]. A chest scan with computed tomography (CT) is one of the good methods used for the treatment of pneumonia. Automatic COVID-19 CT image analysis tools using artificial intelligence methods can be used to identify, measure, and monitor coronavirus disease. It helps to differentiate coronavirus patients from healthy people. To discriminate COVID-19 pneumonia and Influenza-A viral pneumonia from disease-free people, Xiaowei et al. discovered an early screening model. This model is based on pulmonary CT images and deep learning techniques [7]. It gives 86.7% maximum overall accuracy using deep learning CNN model. Shuai et al. developed a deep learning method that can extract COVID-19’s graphical characteristics. They analyzed COVID-19 radiographic changes from CT images. This method is used to provide clinical conclusions before pathogenic testing and in this way, we can save critical time for the disease diagnosis [8]. They obtained 89.5% accuracy with 88.0% precision and 87.0% sensitivity.
Prabira et al. [9] introduced an approach for the identification of COVID-19 based on deep feature and SVM using X-ray images. X-ray images are collected from GitHub, Open-I repository, and Kaggle. They extracted the deep feature of CNN models and fed them to the SVM classifier individually. It results in 95.38% accuracy for ResNet-50 and SVM. COVID-19 cousins are represented as MERS-CoV and SARS-CoV. The analysis of MERS-CoV and SARS-CoV, chest X-ray images are used in many work of literatures. Ahmet Hamimi’s analysed MERS-CoV and demonstrated that available chest X-ray and CT features are like pneumonia manifestations [10]. Data mining methods used by Xuanyang et al. to separate SARS and traditional pneumonia based on X-ray images [11]. Huang et al. described the spectrum of clinical presentation of 41 Chinese patients from Wuhan [4]. The commonest symptoms were fever (98%), cough (76%), and myalgia (44%), while sputum production, headache, and diarrhea were rare presentations. Acute respiratory distress syndrome (ARDS), anemia, secondary infection, and acute cardiac injury were common complications noted more in patients needing intensive care. Wang et al. described clinical characteristics of 138 cases of NCIP (novel Coronavirus infected pneumonia) admitted in Zhongnan Hospital of Wuhan [12]. They reiterated that fever, fatigue, and dry cough were the commonest symptoms. The majority of the patients were in their fifth decade. 26% of patients needed intensive care, with ARDS, shock, and arrhythmia being the major complications.
The epidemic has been the second most severe in Italy so far. Albarello et al. have discussed two of the cases from Italy which helped to understand some diagnostic aspects of the disease [13]. These two cases travelled from Wuhan, China. In both cases, the increased diameter of the perilesional pulmonary vessels grew by extending the pulmonary alterations. The follow-up with chest X-Rays and CT scans was also included, showing a progressive adult respiratory distress syndrome (ARDS). Holshue et al. reported that in the United States first case of 2019-nCoV found [14]. They describe the identification, diagnosis, clinical course, and management of the case, including the patient’s initial mild symptoms at presentation with progression to pneumonia on day 9 of illness. This case highlights the importance of close coordination between clinicians and public health authorities at the local, state, and federal levels, as well as the need for rapid dissemination of clinical information related to the care of patients with this emerging infection. Li et al. described the early transmission dynamics of the disease among initially affected Chinese population [15]. They described the characteristics of the cases and estimated the key epidemiologic time-delay distributions. In the early period of exponential growth, estimated the epidemic doubling time and the basic reproductive number. Distribution of the incubation period estimated and suggested incubation period which indicates a 14-day medical observation period or quarantine for infected persons.
Zhu et al. very recently published a systematic review of all ongoing clinical drug trials relating to this pandemic [16]. Among many drugs studied so far, hydroxychloroquine, though pending FDA approval, appears promising and its use is supported by multiple studies like Gao et al. and Cortegiani et al. [17, 18]. Though the development of targeted vaccines in this mutating virus may be effective in halting future epidemics, their use in the current emergent scenario seems to be limited, as it may take months or years to develop an effective, widely tested vaccine. The epidemic spreading wildly, there has been a surge of statistical studies to predict the number of cases affected by the virus. Anastassopoulou et al., Gamero et al. and Wu et al. are a few notable examples in this regard [19–21]. Elsewhere, Lin et al. researched the effect of person’s reaction and policy intervention (holiday extension, urban shutdown, hospitalization, and quarantine) on the spread of the infection [22]. Chinazzi et al. studied the effect of travel restrictions on the same [23]. Butt et al. reviewed a study in which they have compared multiple convolutional neural network (CNN) models to classify COVID-19 CT samples with viral pneumonia, or no-infection [24].
From the above literature we can observed the following issues:
Due to the emergent nature of the COVID-19 pandemic, a systematic collection of CXR data set for deep neural network training is difficult [7–9, 12, 17, 18].
Most of the literature uses the convolutional neural network (CNN) models to detect COVID-19 [6–8, 24].
To address the above problems, Yujin et al. proposed a patch-based convolutional neural network approach with a relatively small number of trainable parameters for COVID-19 diagnosis [46]. The proposed method is inspired by a statistical analysis of the potential imaging biomarkers of the CXR radiographs. The main focus of this paper is to develop a neural network architecture that is suitable for training with limited training data set, which can still produce radiologically interpretable results.
Sarkodie et al. showed a report which focuses on the role of chest X-ray in the diagnosis of the disease [47]. Chest X-ray can be used as an effective, fast, and affordable way to immediately triage COVID-19 patients when suspected and should be encouraged as a diagnostic tool for isolation until PCR testing is done for confirmation.
Abdul et al. present a method to generate synthetic chest X-ray (CXR) images by developing an Auxiliary Classifier Generative Adversarial Network (ACGAN) based model called CovidGAN. They concentrated on the unavailability of a significant number of radiographic images. In addition, they demonstrated that the synthetic images produced from CovidGAN can be utilized to enhance the performance of CNN for COVID-19 detection. Classification using CNN alone yielded 85% accuracy. By adding synthetic images produced by CovidGAN, the accuracy increased to 95% [48].
So, inspired by this early success, in these papers we aim to further investigate deep convolutional neural network and evaluate its feasibility for COVID-19 diagnosis. The motivation behind this exploration is to evaluate the performance of available convolutional neural networks introduced by researchers, related to the automatic diagnosis of COVID-19 from thoracic X-rays. Additionally, the motivation behind this investigation is to determine the practicality of top-tier pre-designed convolutionary neural frameworks which is discovered by knowledgeable researchers.
Since the pandemic is recent, there are only a limited number of CXR images available for study. The lack of data in medical imaging led us to explore ways of expanding image datasets. To solve the limitations of the current study, we are focusing on improvements in COVID-19 detection. For evaluation, we also used a dataset provided by the author [45]. The dataset consist of an aggregate of 5232 images, where normal category has 1346 images, 3883 images delineated pneumonia, out of which 2538 images have a place with bacterial pneumonia and 1345 images delineated viral pneumonia.
In this study, we have introduced deep convolution neural network based transfer models (specially Se-ResNet-50 and Se-ResNeXt-50) for automatic detection of COVID-19 on the Chest X-ray images. In this approach we have used nine pre-trained models AlexNet, GoogleNet, ResNet-50, Se-ResNet-50, DenseNet121, Inception V4, Inception ResNet V2, ResNeXt-50, and Se-ResNeXt-50 to achieve maximum accuracy for CT images datasets.
Based on the results, it is demonstrated that deep learning with CNNs may have significant effects on the automatic detection and automatic extraction of essential features from X-ray images, related to the diagnosis of the Covid-19.
The innovation of this proposed work is summarized as follows:
-
i)
We can perform automatic operations without manual intervention and selection methods.
-
ii)
We have demonstrated that Se-ResNeXt-50 is a powerful pre-prepared model as compared with other used pre-prepared models.
-
iii)
X-ray images of the chest can be used as an identification tool to detect COVID-19.
-
iv)
The selected pre-trained models coupled with transfer learning are showing high accuracy results for all four datasets.
-
v)
According to our knowledge, this is the first paper in which squeeze and excitation based architecture Se-ResNet-50 and Se-ResNeXt-50 is used to detect COVID-19.
Methods
Proposed approach framework
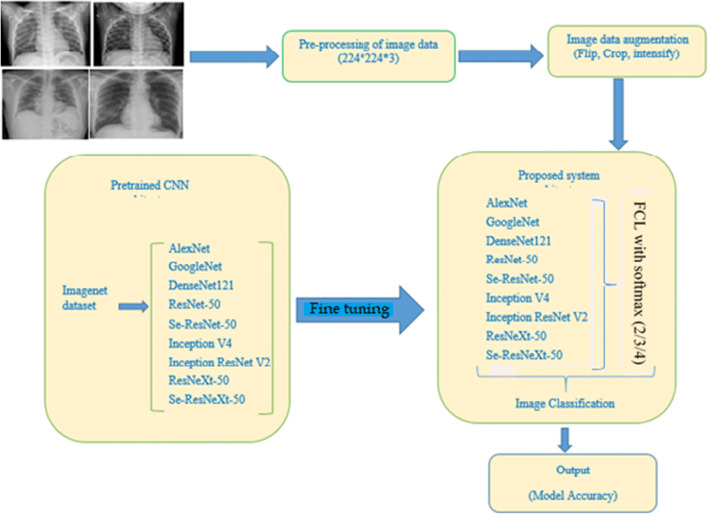
The proposed approach of this work is encapsulated in Fig. 2. This approach is divided into various phases: Chest X-ray image pre-processing, augmentation, pre-trained models, Deep Transfer Learning (Training phase), feature extraction, and accurate prediction of models. Involve phases are discussed in the next sections.
Fig. 2.
Framework of the proposed system approach
Chest X-ray data pre-processing and enhancement
In actual pre-trained CNN, models are big enough in size to capture this X-ray dataset, which creates overfitting problems. To solve this issue some kind of noise may be added with the used dataset; this addition of noise at the initial stage (input) in a neural network, shows momentous changes in dataset generalization for few cases. Noise addition task performs a kind of augmentation on the dataset as well. As one of the difficulties which is faced by the researcher working in the medical area is dataset limitation. So, we also applied some other augmentation techniques. We prepared the Chest X-ray image dataset as follows: Initially, we changed the size of the images to 224 × 224 × 3, next applied augmentation techniques: Random Horizontal Flip (helps in pneumonia presence identification by its chest symptom), Random Resized Crop (helps in deeper identification of pixels relationship), and at the end image augmentation by changing image intensity.
CNN architecture and need of deep transfer learning
Recently, CNN architecture based deep learning models used to solve computer vision problems. We used deep CNN architecture based AlexNet, GoogleNet, ResNet-50, Se-ResNet-50, DenseNet121, Inception V4, Inception ResNet V2, ResNeXt-50, and Se-ResNeXt-50 models coupled with transfer learning techniques to classify COVID-19 Chest X-ray image data between normal and COVID- 19 patient. Transfer learning also helps to deal with inadequate data and model execution time.
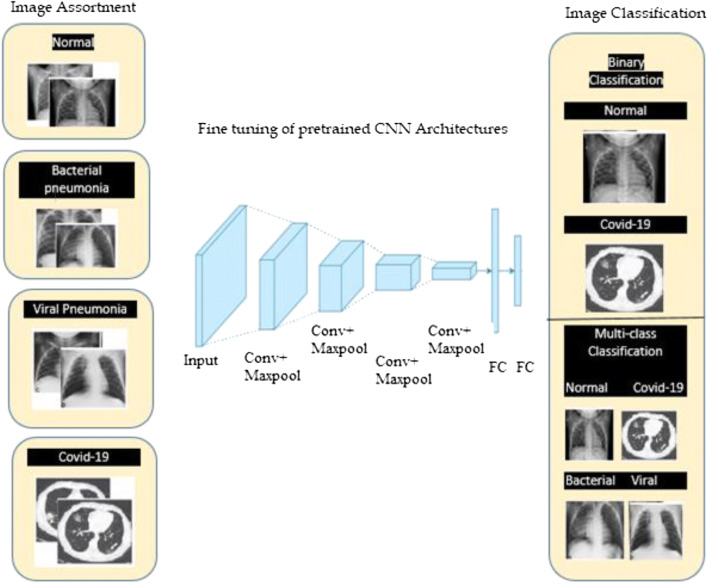
The schematic illustration of used CNN architectures along with pre-trained AlexNet, GoogleNet, ResNet-50, Se-ResNet-50, DenseNet121, Inception V4, Inception ResNet V2, ResNeXt-50, and Se-ResNeXt-50 models shown in Fig. 3.
Fig. 3.
Schematic illustration of CNN models for COVID-19 and normal patients’ prediction
Pretrained models are first fine-tuned on a new dataset and then classification is performed.
Transfer learning is an important tool in machine learning to solve the basic problem i.e. insufficient training data. This technique’s objective is to utilizes acquired knowledge from one task (problem) and use it to solve similar work by solving isolation learning problems. This gathered knowledge gives the motivation to solve the problem of numerous domains that involve difficulties in improvement due to inadequate or incomplete training data. The transfer learning process represented in Fig. 4.
Fig. 4.
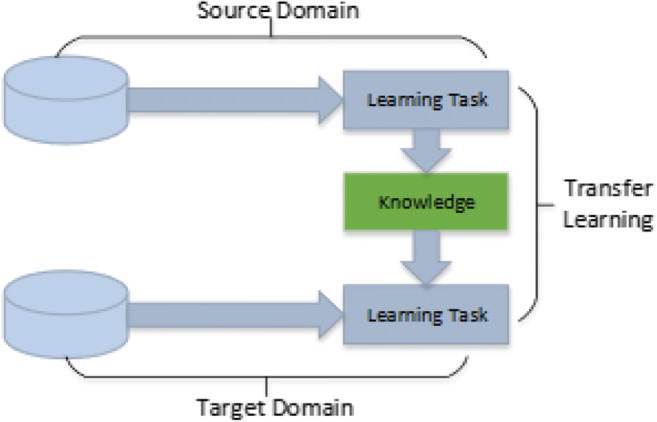
Transfer learning process
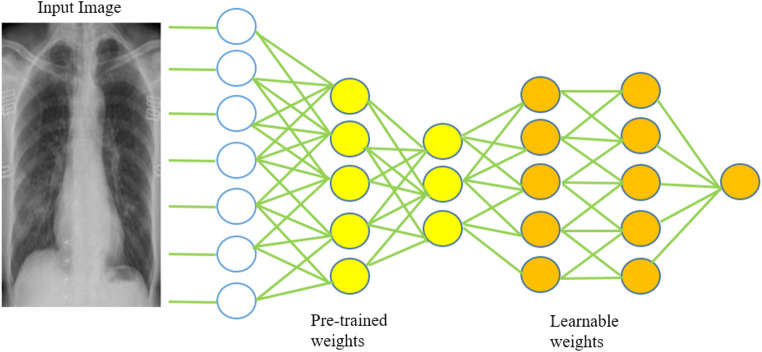
To work with the Chest X-ray image dataset, we are using nine pre-trained architecture, in place of performing the lengthy process of training from scratch. In this transfer learning technique, the weights of network layers are reused to train a model for a new field, shown in Fig. 5. The transfer learning technique has achieved useful and important results in numerous domains of computer vision [25–28].
Fig. 5.
Deep Transfer Learning with Pre-trained and Learnable weights
We used pre-trained CNN architecture weights, and fine-tune the whole model with suitable learning rates. The key idea is to leverage the pre-trained model weights to extract low level features from images and to update the higher level weights according to our dataset for the detection of COVID-19.
Pre-trained CNN architectures
We have chosen nine distinct architectures as AlexNet [29], GoogLeNet [33] DenseNet121 [30], ResNet-50 [31], Inception V4 [32], Inception-ResNet V2 [37], ResNeXt-50 [43], Se-ResNet-50 [44] and Se-ResNeXt-50 [44] for classification task on Chest X-ray images dataset. Utilizing these architectures by fine tuning the network with modified classification layer, enables us to extract features for our target task based on the knowledge of source task.
AlexNet architecture
AlexNet, CNN architecture is identical in design with LeNet [34], although some minor significant variation still exists. AlexNet network is deeper than the LeNet architecture, AlexNet evolves eight layers: 5 convolutional (conv) layers, 3 fully-connected (FC) dense layer. To compute non-linearity the sigmoid function is replaced with a ReLU: Rectified Linear Unit. It evolves more convolution (10 times) channels than LeNet. The Overfitting issue is resolved using dropout layers and to reduce network size max pooling is used. The AlexNet architecture used for the proposed approach is shown in Fig. 6.
Fig. 6.
AlexNet architecture for COVID-19 Chest X-ray image classification
GoogleNet architecture
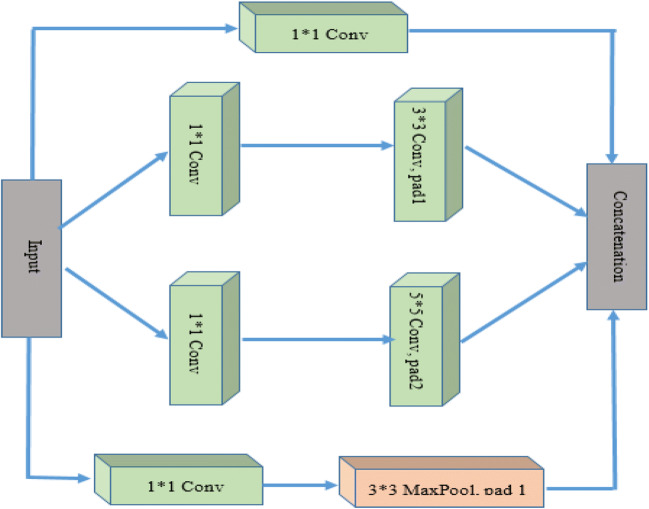
GoogleNet and AlexNet CNN architectures are different from each other. This architecture uses global average pooling along with max pooling. The inception block shown in Fig. 7 is the basic convolutional block.
Fig. 7.
Inception block
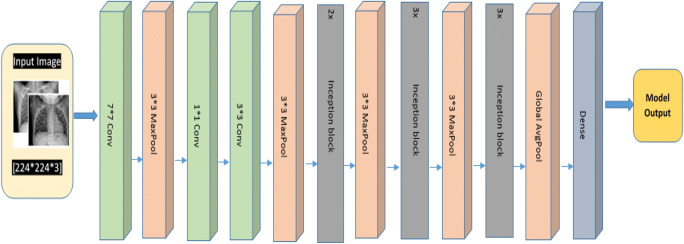
As shown in Fig. 7, four parallel paths are present in inception block which performs a different convolution of 1 × 1(to reduce architecture complexity), 3 × 3, and 5 × 5 window sizes for information extraction of numerous spatial sizes. Complete GoogleNet architecture is shown in Fig. 8. Each cubic bar represents a layer. Convolution layer includes Conv+ReLU. Inception block is used three times with frequencies 2, 3, and 3 respectively. The first and second time used inception blocks are followed by 3*3 max pooling and the third time it is followed by a global average pool that is connected with a fully connected dense layer.
Fig. 8.
GoogleNet architecture for COVID-19 Chest X-ray image classification
ResNet-50
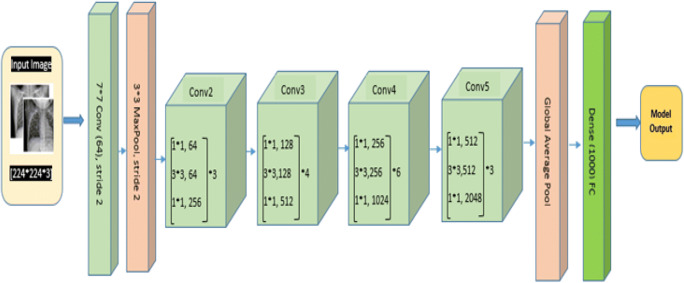
To simplify the training task of deep networks a new architecture comes with a residual learning framework known as ResNet. In this architecture network layers are reformulated by learning using residual functions in respect of layer inputs. ResNet [31, 35] is also called a residual network that introduces skip connection concept to deal vanishing gradient problem. This prevents the distortion which appears as the network becomes deeper and complex. ResNet variant ResNet-50 is used as one of the models. ResNet-50 architecture is shown in Fig. 9. This makes use of a 50-layer network and trained using ImageNet (http://www.image-net.org/) dataset. The ResNet-50 architecture evolves convolutional layer, 4 convolutional blocks, max pool, and average pool to address the degradation of the accuracy. This helps to generate deeper CNNs by maintaining accuracy. The ResNet-50 architecture provided a way for developers to build even deeper CNNs without compromising accuracy. ResNet-50 was among the first CNNs which make use of batch normalization feature.
Fig. 9.
ResNet-50 architecture for Covid-19 Chest X-ray image classification
ResNeXt-50
The ResNeXt-50 is an advancement over ResNet-50. Millions of images from the ImageNet dataset were used to train ResNeXt-50. This CNN architecture is deeply modularized and simple for image classification tasks. This architecture makes use of a building block which involves transformation steps with a similar design. This concept introduces a uniform and multi-branch network architecture where only some parameters need to be set and this concept brings a new dimension cardinality associated with depth and width dimensions of transformation step. The model architecture is shown in Fig. 10.
Fig. 10.
ResNeXt-50 architecture for COVID-19 Chest X-ray image classification
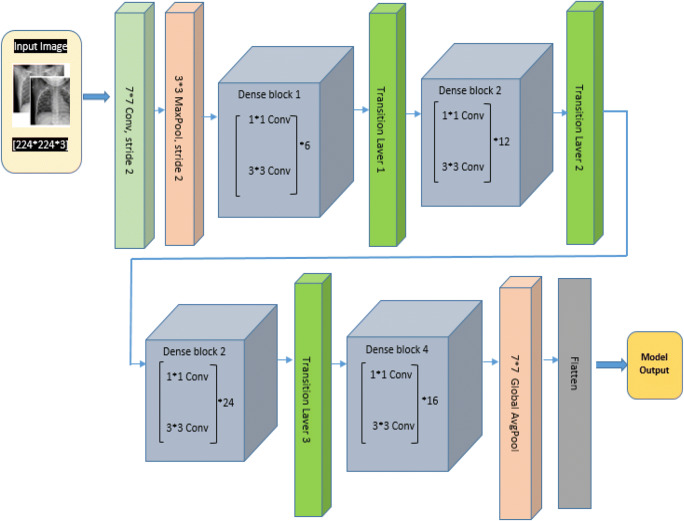
Densenet121
Although ResNet has modified the way in which deep neural network functions are parameterized, still some conceptual extension may exist which is performed by DenseNet architecture. So this architecture is the logical extension of ResNet. DenseNet121 architecture is shown in Fig. 11. As shown in Fig. 11, DenseNet121 uses convolutional layers, max pool, global average (avg) pool, dense block, and transition layer. Dense block evolves convolutions of 1*1 and 3*3 to reduce the number of parameters required for model tuning. Transaction layers use a 1*1 convolution layer and 2*2 average pool layer shown in Fig. 12. DenseNet121 solves training time issues (each layer output is used by the next layer as input) by using loss function gradient values which help to reduce the computation time and cost by making this architecture a good option.
Fig. 11.
DenseNet121 architecture for COVID-19 Chest X-ray image classification
Fig. 12.
Transition layer architecture
Inception architecture
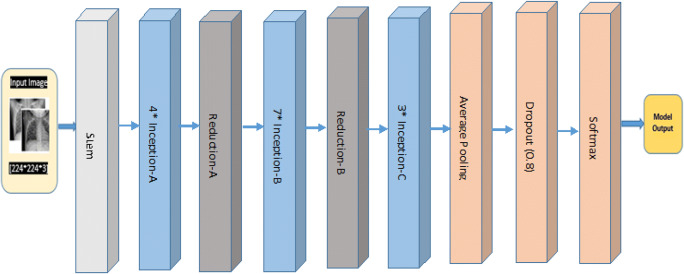
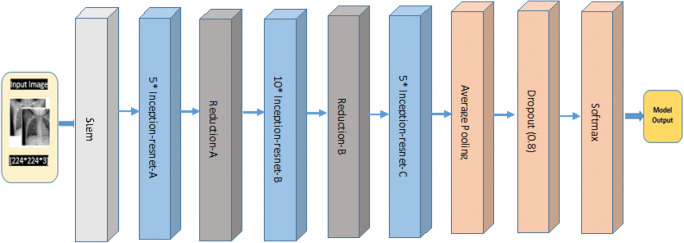
In image recognition highly deep CNN architectures are central demand for the greatest advances. One of the architecture is Inception which shows good performance at comparatively low computation cost. Inception deep network architecture was brought into existence by the researcher [36] as Inception-v1. Further, this Inception-v1 architecture was modified with the concept of batch normalization by the author [43], named as Inception-v2. Then the factorization idea is also added in the next iterations and that architecture will be introduced as Inception-v3, Inception –v4, Inception ResNet V1, and Inception ResNet V2. The technical difference between the Inception model and Inception ResNet model is because of Inception variants as residual and non-residual. This difference indicates that the batch-normalization concept is used on top of the traditional layer only not above the residual summations.
In our methodology, we are using 2 variants of Inception name as Inception V4 and Inception ResNet V2. Inception ResNet V2 training time is less (i.e. much master) and gives better was training much faster and achieved final accuracy is marginally improved than Inception-v4. Inception v4 and Inception ResNet V2 architecture are shown in below Figs. 13 and 14.
Fig. 13.
Inception v4 architecture base diagram
Fig. 14.
Inception ResNet V2 base diagram
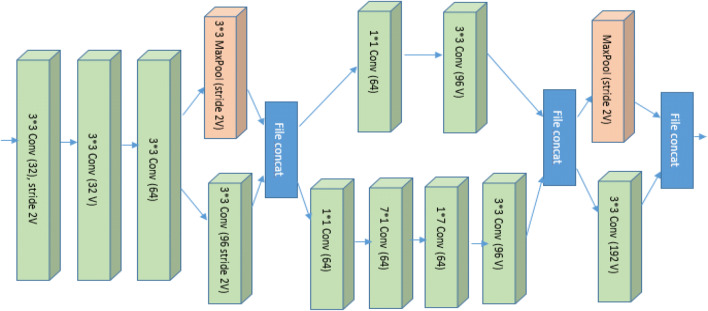
Figures 13 and 14 represent the base diagram of Inception v4 and Inception ResNet V2. Both the architecture follow the same stem composition. In both architecture, V denotes: ‘Valid’ padding otherwise architecture uses the same padding. Stem architecture is shown in Fig. 15. The schema of both models differs with respect to interior grid modules [37].
Fig. 15.
Inception v4 and Inception ResNet v2 stem architecture
SE-ResNet-50 and SE-ResNeXt-50
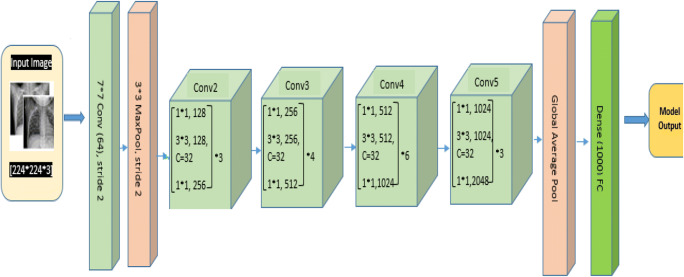
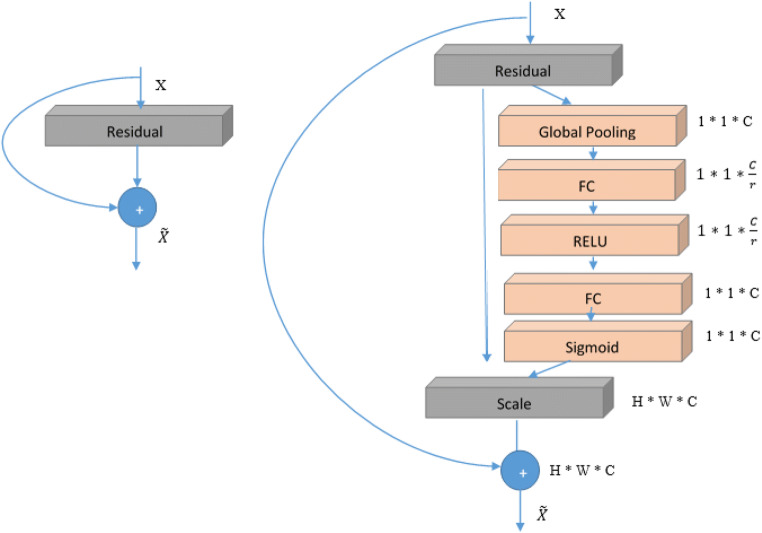
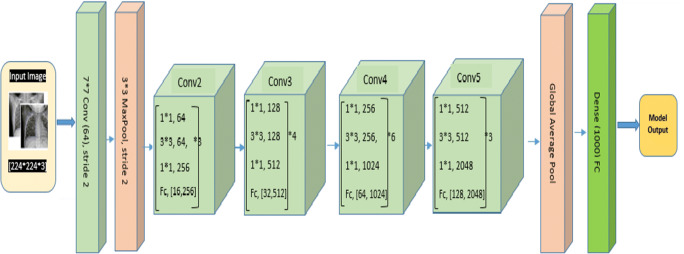
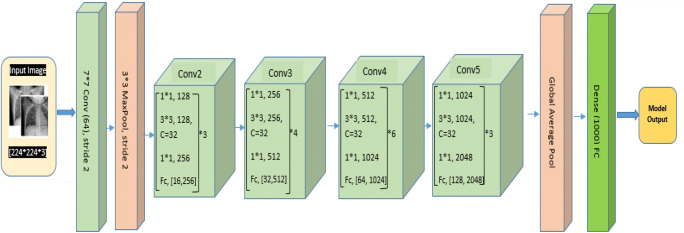
In these architecture squeeze-and-excitation (SE) block is applied at the end of each non-identity branch of residual block. A SE block is a computational unit which is based upon a transformation Ftr mapping an input to feature maps U ϵ RH ∗ W ∗ C. This SE block can be integrated with various CNN architectures. SE blocks can be used directly with residual networks. Fig. 16, shows the Se-ResNet module architecture [44]. Here, the SE block transformation Ftr is taken to be the non-identity branch of a residual module. Squeeze and Excitation both act before summation with the identity branch. In our work we are using SE blocks with ResNet-50 and ResNeXt-50. This SE block slightly increases the computational burden on basic ResNet-50 and ResNeXt-50 architecture, however the accuracy of Se-ResNet-50 and Se-ResNeXt-50 surpasses that of ResNet-50 and ResNeXt-50. The slight additional computational cost acquire by the SE block is validated by its contribution to architecture performance. Both the architectures Se-ResNet-50 and Se-ResNeXt-50 are shown in Figs. 17 and 18.
Fig. 16.
Original Residual module (left) and the Se-ResNet module (right)
Fig. 17.
Se-ResNet-50 Architecture for COVID-19 X-ray image classification
Fig. 18.
Se-ResNeXt-50 architecture
All the above discussed CNN architectures are used in our proposed approach and the performance of each model is evaluated based on 5 evaluation parameters.
Finally, we compare various configuration of CNN architecture to determine the best configured pre-trained model for the chest X-ray images classification of the COVID −19 dataset.
Performance metrics
We use five metrics to measure the performance of pre-rained CNN architectures in this paper to classify the Chest X-ray images. All the metrics use four important terms as True Positives (TP), True Negatives (TN), False Positives (FP) and False Negatives (FN). The accuracy measure is shown below:
| 1 |
This accuracy measure will only work well shown in the equation when we have an equal number of images belongs to both classes. So, to predict the accurate performance of models we also use other metrics.
In addition to accuracy, we further evaluate our proposed system with four evaluation measures: sensitivity (recall), specificity, precision, and F-score. The performance evaluation metrics are shown in Eqs. 2 to 5 as follows:
| 2 |
| 3 |
| 4 |
| 5 |
Experimental setup and results
Dataset description
To perform the experimentation, we identify the several Chest X-rays sources from the Github repository for similar types of datasets and Cohen [38], collection of Chest X-ray images. This repository is an important resource of most researchers managing with COVID-19. It contains 144 images of frontal x-ray images of positive patients to COVID-19. The Author extracted the images from online published research documents, websites, or directly from the PDF using the tool as pdf images. This image resource consists of chest X-ray images of mainly patients with acute respiratory distress syndrome (ARDS), COVID-19, Middle East respiratory syndrome (MERS), pneumonia, severe acute respiratory syndrome (SARS). Deeply examine some websites also and then we analysed, identified, and prepare the datasets.
Some group of Chest X-ray image data is collected from internet sources [39]. We added a group of X-ray scanned images belong to common bacterial-pneumonia in our dataset, for training purposes of the CNN model to differentiate between COVID-19 patients and common pneumonia patients. This group of a dataset is collected from the website hosted by the author [40]. We refer to this group of images as Dataset1 and Dataset2.
Dataset1 includes only two categories of images as confirmed COVID-19: 224 and normal or healthy condition: 504.
Dataset2 includes three categories of images as confirmed COVID-19: 224, confirmed common bacterial pneumonia: 700 and normal condition: 504.
We performed some changes on the dataset because Dataset2 only includes a case of bacterial pneumonia, so it’s difficult to observe the CNN model’s performance to differentiate between COVID −19 diseases and pneumonia cases. Hence we added cases of viral pneumonia and refer this group of images as Dataset3 which includes images for confirmed COVID -19: 224, confirmed bacterial pneumonia: 400, viral pneumonia: 314 and normal condition: 504.
For evaluation, we also used a dataset provided by the author [45]. The dataset consist of an aggregate of 5232 images, where normal category has 1346 images, 3883 images delineated pneumonia, out of which 2538 images have a place with bacterial pneumonia and 1345 images delineated viral pneumonia. We refer to this dataset as Dataset-4.
Experimental environment
We employ fine-tuned pretrained CNN architectures for classification and detection of COVID-19. The pre-trained architectures used in our study for classification are: AlexNet, GoogleNet, ResNet-50, Se-ResNet-50, DenseNet121, Inception V4, Inception ResNet V2, ResNeXt-50 and Se-ResNeXt-50. Each of these architecture makes use of fully connected (FC) layers, where the last FC layer is used for the classification. We set the number of neurons of the last FC layer according to the target dataset.
The parameters of fine-tuning method are not set by the network architecture itself, and it is essential to set and optimize these parameters according to the results of training the images in improving the performance. In our case, each network architecture is trained with Adam optimizer in maximum of 30 epochs. The value of train and test batch size is set to 32 and 8 with the initial learning rate of 1e-5.
We use python as a programming language to train the CNN models. The whole experimentation was performed on a Google Colaboratory with GPU NVIDIA CUDA Version: 10.1 with Tesla P100. We use deep learning library PyTorch 1.5 (https://pytorch.org/) to perform experimentation on pre-trained CNN models (AlexNet, GoogleNet, ResNet-50, Se-ResNet-50, DenseNet121, Inception V4, Inception ResNet V2, ResNeXt-50 and Se-ResNeXt-50) by randomly initializing weights. Each of the used CNN architecture makes use of some hyper-parameters for deep transfer learning, parameters, and their values are shown in Table 1.
Table 1.
Parameter setting of CNN architectures
| Parameters | AlexNet | GoogleNet | ResNet-50 | Se- ResNet-50 | DenseNet121 | Inception-V4 | Inception ResNet –V2 |
ResNeXt-50 | Se- ResNeXt-50 |
|---|---|---|---|---|---|---|---|---|---|
| Optimizer | ADAM | ADAM | ADAM | ADAM | ADAM | ADAM | ADAM | ADAM | ADAM |
| Base learning rate | 1e-5 | 1e-5 | 1e-5 | 1e-5 | 1e-5 | 1e-5 | 1e-5 | 1e-5 | 1e-5 |
| Learning decay rate | .1 | .1 | .1 | .1 | .1 | .1 | .1 | .1 | .1 |
| Momentum β1 | .9 | .9 | .9 | .9 | .9 | .9 | .9 | .9 | .9 |
| RMSprop β2 | .999 | .999 | .999 | .999 | .999 | .999 | .999 | .999 | .999 |
| Dropout rate | .5 | .5 | .5 | .5 | .5 | .5 | .5 | .5 | .5 |
| No of epochs | 30 | 30 | 30 | 30 | 30 | 30 | 30 | 30 | 30 |
| Train batch Size | 32 | 32 | 32 | 32 | 32 | 32 | 32 | 32 | 32 |
| Test batch size | 8 | 8 | 8 | 8 | 8 | 8 | 8 | 8 | 8 |
| Total No of parameters | 60 M | 4 M | 25 M | 27.5 M | 7.97 M | 43 M | 56 M | 25 M | 27.56 M |
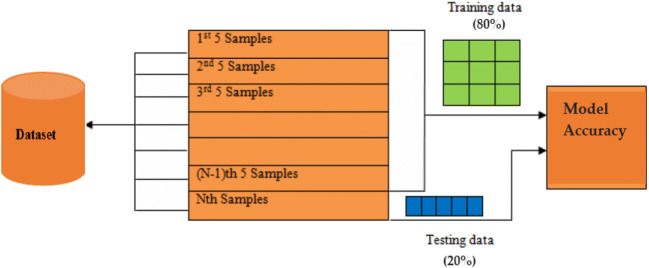
Dataset is divided randomly using the K-Fold cross-validation method for training: 80% and testing: 20%, shown in Fig. 19, and calculate results for different values of k (k = 1 to 5). Dataset splitting criteria for all categories of datasets is shown in Table 2.
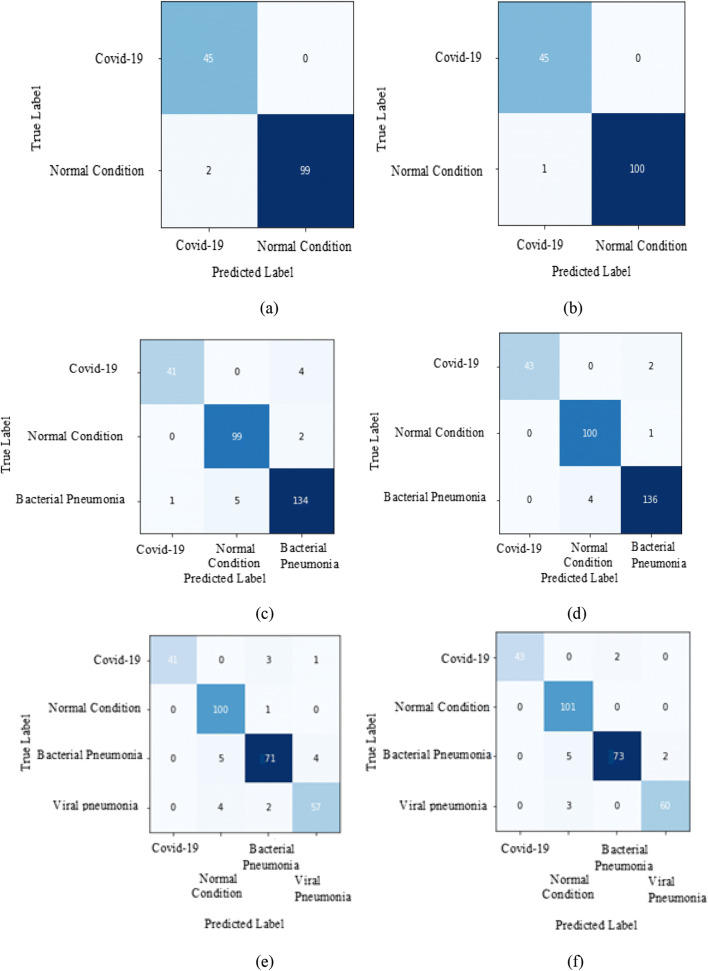
Fig. 20.
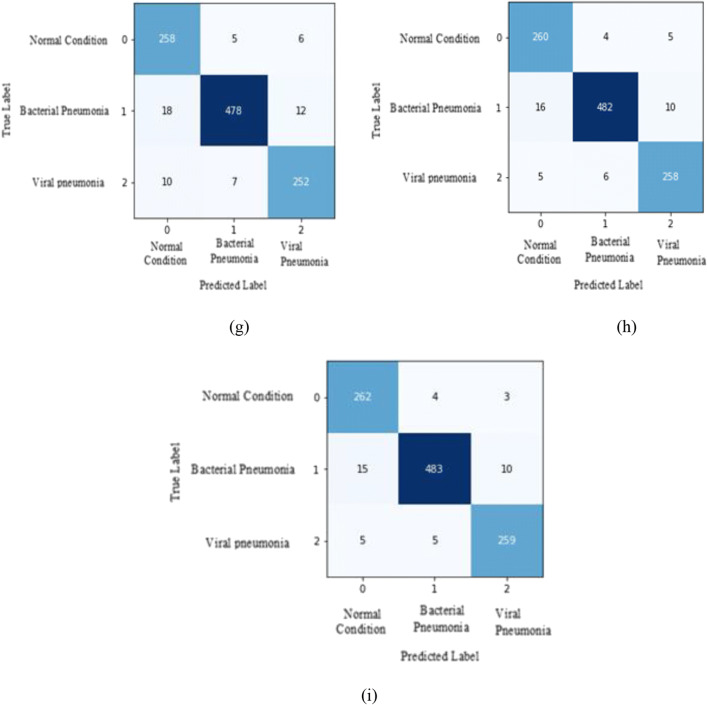
Confusion matrix for ResNet-50, ResNeXt-50 and Se-ResNeXt-50 model for all four categories of datasets: Binary class (a) ResNet-50 and (b) ResNeXt-50 & Se-ResNeXt-50), Multi-class1 (c) ResNet-50 and (d) ResNeXt-50 & Se-ResNeXt-50), Multi-class2 (e) ResNet-50 and (f) ResNeXt-50 & Se-ResNeXt-50), Multi-class3 (g) ResNet-50, (h) ResNeXt-50 and (i) Se-ResNeXt-50)
Fig. 19.
Training and testing data formulation for 5-fold cross validation
Table 2.
Data Splitting Criteria
| Binary Data Set | Multiclass Dataset-1 | Multiclass Dataset-2 | Multiclass Dataset-4 | |||||
|---|---|---|---|---|---|---|---|---|
| Class | Train | Test | Train | Test | Train | Test | Train | Test |
| COVID −19 | 179 | 45 | 179 | 45 | 179 | 45 | ||
| Normal Condition | 403 | 101 | 403 | 101 | 403 | 101 | 1077 | 269 |
| Bacterial pneumonia | – | – | 560 | 140 | 320 | 80 | 2030 | 508 |
| Viral pneumonia | – | – | – | – | 251 | 63 | 1076 | 269 |
Result analysis and discussions
We evaluate the effectiveness of our proposed methodology based on metrics results calculated by conducting the experiments and explores the finetuning technique of transfer learning by extracting the features of pretrained CNN networks. As discussed in the dataset Section 4.1, the experimental study is performed on 4 publicly available datasets. The effectiveness of the proposed system is evaluated using performance metrics discussed in Section 3.5.
Initially, we evaluate the accuracy for all categories such as a binary and multi-class dataset of the proposed system. Next, we use the k-fold measure to evaluate average classification accuracy. We calculate average accuracy by using accuracy achieved by each one of the 5 fold. We have performed experimentation on binary class and multi-class datasets in our proposed system. Experiments are performed in all four datasets using nine pre-trained CNN networks i.e. AlexNet, GoogleNet, ResNet-50, Se-ResNet-50, DenseNet121, Inception V4, Inception ResNet V2, ResNeXt-50, and Se-ResNeXt-50. Our outcome shows the exploration of deep transfer learning techniques by feature extraction of pre-trained models (CNN networks). From the Tables 3, 4, 5 and 6 results are observed that the performance of the fine-tuned each pre-trained architectures used in this study is comparable with one another. We also observed that the Se-ResNeXt-50 model achieves the highest accuracy in all categories of datasets.
Table 3.
Results obtained from pre-trained CNN models for Binary Class Dataset1
| Models/Folds(F) | Performance Evaluation based on four metrics | |||||||||
|---|---|---|---|---|---|---|---|---|---|---|
| TP | TN | FP | FN | Test set (%) Acc | Rec | Spec | Prec | F1 | ||
| AlexNet | F-1 | 42 | 92 | 9 | 3 | 91.78 | 93.33 | 91.09 | 82.35 | 87.5 |
| F-2 | 44 | 98 | 3 | 1 | 97.26 | 97.78 | 97.03 | 93.62 | 95.65 | |
| F-3 | 45 | 98 | 3 | 0 | 97.95 | 100 | 97.03 | 93.75 | 96.77 | |
| F-4 | 45 | 98 | 3 | 0 | 97.95 | 100 | 97.03 | 93.75 | 96.77 | |
| F-5 | 45 | 98 | 3 | 0 | 97.95 | 100 | 97.03 | 93.75 | 96.77 | |
| Average | 96.58 | 98.22 | 95.84 | 91.44 | 94.69 | |||||
| GoogleNet | F-1 | 42 | 93 | 8 | 3 | 92.47 | 93.33 | 92.08 | 84 | 88.42 |
| F-2 | 45 | 97 | 4 | 0 | 97.26 | 100 | 96.04 | 91.84 | 95.74 | |
| F-3 | 45 | 99 | 2 | 0 | 98.63 | 100 | 98.02 | 95.74 | 97.83 | |
| F-4 | 45 | 99 | 2 | 0 | 98.63 | 100 | 98.02 | 95.74 | 97.83 | |
| F-5 | 45 | 99 | 2 | 0 | 98.63 | 100 | 98.02 | 95.74 | 97.83 | |
| Average | 97.12 | 98.67 | 96.44 | 92.61 | 95.53 | |||||
| DenseNet121 | F-1 | 43 | 91 | 10 | 2 | 91.78 | 95.56 | 90.1 | 81.13 | 87.76 |
| F-2 | 44 | 97 | 4 | 1 | 96.58 | 97.78 | 96.04 | 91.67 | 94.62 | |
| F-3 | 44 | 100 | 1 | 1 | 98.63 | 97.78 | 99.01 | 97.78 | 97.78 | |
| F-4 | 44 | 100 | 1 | 1 | 98.63 | 97.78 | 99.01 | 97.78 | 97.78 | |
| F-5 | 44 | 100 | 1 | 1 | 98.63 | 97.78 | 99.01 | 97.78 | 97.78 | |
| Average | 96.85 | 97.33 | 96.63 | 93.23 | 95.14 | |||||
| ResNet-50 | F-1 | 43 | 93 | 8 | 2 | 93.15 | 95.56 | 92.08 | 84.31 | 89.58 |
| F-2 | 45 | 98 | 3 | 0 | 97.95 | 100 | 97.03 | 93.75 | 96.77 | |
| F-3 | 45 | 99 | 2 | 0 | 98.63 | 100 | 98.02 | 95.74 | 97.83 | |
| F-4 | 45 | 99 | 2 | 0 | 98.63 | 100 | 98.02 | 95.74 | 97.83 | |
| F-5 | 45 | 99 | 2 | 0 | 98.63 | 100 | 98.02 | 95.74 | 97.83 | |
| Average | 97.4 | 99.11 | 96.63 | 93.06 | 95.97 | |||||
| Se-ResNet 50 | F-1 | 43 | 94 | 7 | 2 | 93.84 | 95.56 | 93.07 | 86 | 90.53 |
| F-2 | 44 | 99 | 2 | 1 | 97.95 | 97.78 | 98.02 | 95.65 | 96.7 | |
| F-3 | 45 | 99 | 2 | 0 | 98.63 | 100 | 98.02 | 95.74 | 97.83 | |
| F-4 | 45 | 99 | 2 | 0 | 98.63 | 100 | 98.02 | 95.74 | 97.83 | |
| F-5 | 45 | 99 | 2 | 0 | 98.63 | 100 | 98.02 | 95.74 | 97.83 | |
| Average | 97.53 | 98.67 | 97.03 | 93.78 | 96.14 | |||||
| Inception ResNet v2 | F-1 | 41 | 87 | 14 | 4 | 87.67 | 91.11 | 86.14 | 74.55 | 82 |
| F-2 | 43 | 90 | 11 | 2 | 91.1 | 95.56 | 89.11 | 79.63 | 86.87 | |
| F-3 | 43 | 90 | 11 | 2 | 91.1 | 95.56 | 89.11 | 79.63 | 86.87 | |
| F-4 | 41 | 88 | 13 | 4 | 88.36 | 91.11 | 87.13 | 75.93 | 82.83 | |
| F-5 | 41 | 89 | 12 | 4 | 89.04 | 91.11 | 88.12 | 77.36 | 83.67 | |
| Average | 89.45 | 92.89 | 87.92 | 77.42 | 84.45 | |||||
| ResNeXt-50 | F-1 | 43 | 95 | 6 | 2 | 94.52 | 95.56 | 94.06 | 87.76 | 91.49 |
| F-2 | 45 | 98 | 3 | 0 | 97.95 | 100 | 97.03 | 93.75 | 96.77 | |
| F-3 | 45 | 100 | 1 | 0 | 99.32 | 100 | 99.01 | 97.83 | 98.9 | |
| F-4 | 45 | 100 | 1 | 0 | 99.32 | 100 | 99.01 | 97.83 | 98.9 | |
| F-5 | 45 | 100 | 1 | 0 | 99.32 | 100 | 99.01 | 97.83 | 98.9 | |
| Average | 98.08 | 99.11 | 97.62 | 95 | 96.99 | |||||
| Se-ResNeXt-50 | F-1 | 43 | 96 | 5 | 2 | 95.21 | 95.56 | 95.05 | 89.58 | 92.47 |
| F-2 | 45 | 99 | 2 | 0 | 98.63 | 100 | 98.02 | 95.74 | 97.83 | |
| F-3 | 45 | 100 | 1 | 0 | 99.32 | 100 | 99.01 | 97.83 | 98.9 | |
| F-4 | 45 | 100 | 1 | 0 | 99.32 | 100 | 99.01 | 97.83 | 98.9 | |
| F-5 | 45 | 100 | 1 | 0 | 99.32 | 100 | 99.01 | 97.83 | 98.9 | |
| Average | 98.36 | 99.11 | 98.02 | 95.76 | 97.4 | |||||
Bold indicates highest accuracy
Table 4.
Results obtained from pre-trained CNN models for Multi-class1 Dataset 2
| Models/Folds(F) | Performance Evaluation based on four metrics | |||||||||
|---|---|---|---|---|---|---|---|---|---|---|
| TP | TN | FP | FN |
Test set (%) Acc |
Rec | Spe | Pre | F1 | ||
| AlexNet | F-1 | 36 | 207 | 34 | 9 | 84.97 | 80 | 85.89 | 51.43 | 62.61 |
| F-2 | 36 | 208 | 33 | 9 | 85.31 | 80 | 86.31 | 52.17 | 63.16 | |
| F-3 | 38 | 215 | 26 | 7 | 88.46 | 84.44 | 89.21 | 59.38 | 69.72 | |
| F-4 | 38 | 215 | 26 | 7 | 88.46 | 84.44 | 89.21 | 59.38 | 69.72 | |
| F-5 | 38 | 215 | 26 | 7 | 88.46 | 84.44 | 89.21 | 59.38 | 69.72 | |
| Average | 87.13 | 82.67 | 87.97 | 56.35 | 66.99 | |||||
| GoogleNet | F-1 | 39 | 220 | 21 | 6 | 90.56 | 86.67 | 91.29 | 65 | 74.29 |
| F-2 | 39 | 222 | 19 | 6 | 91.26 | 86.67 | 92.12 | 67.24 | 75.73 | |
| F-3 | 40 | 224 | 17 | 5 | 92.31 | 88.89 | 92.95 | 70.18 | 78.43 | |
| F-4 | 40 | 224 | 17 | 5 | 92.31 | 88.89 | 92.95 | 70.18 | 78.43 | |
| F-5 | 40 | 224 | 17 | 5 | 92.31 | 88.89 | 92.95 | 70.18 | 78.43 | |
| Average | 91.75 | 88 | 92.45 | 68.55 | 77.06 | |||||
| DenseNet121 | F-1 | 39 | 226 | 15 | 6 | 92.66 | 86.67 | 93.78 | 72.22 | 78.79 |
| F-2 | 39 | 228 | 13 | 6 | 93.36 | 86.67 | 94.61 | 75 | 80.41 | |
| F-3 | 40 | 230 | 11 | 5 | 94.41 | 88.89 | 95.44 | 78.43 | 83.33 | |
| F-4 | 40 | 230 | 11 | 5 | 94.41 | 88.89 | 95.44 | 78.43 | 83.33 | |
| F-5 | 40 | 230 | 11 | 5 | 94.41 | 88.89 | 95.44 | 78.43 | 83.33 | |
| Average | 93.85 | 88 | 94.94 | 76.5 | 81.84 | |||||
| ResNet-50 | F-1 | 40 | 228 | 13 | 5 | 93.71 | 88.89 | 94.61 | 75.47 | 81.63 |
| F-2 | 40 | 229 | 12 | 5 | 94.06 | 88.89 | 95.02 | 76.92 | 82.47 | |
| F-3 | 41 | 233 | 8 | 4 | 95.8 | 91.11 | 96.68 | 83.67 | 87.23 | |
| F-4 | 41 | 233 | 8 | 4 | 95.8 | 91.11 | 96.68 | 83.67 | 87.23 | |
| F-5 | 41 | 233 | 8 | 4 | 95.8 | 91.11 | 96.68 | 83.67 | 87.23 | |
| Average | 95.03 | 90.22 | 95.93 | 80.68 | 85.16 | |||||
| Se-ResNet-50 | F-1 | 40 | 228 | 13 | 5 | 93.71 | 88.89 | 94.61 | 75.47 | 81.63 |
| F-2 | 40 | 229 | 12 | 5 | 94.06 | 88.89 | 95.02 | 76.92 | 82.47 | |
| F-3 | 41 | 234 | 7 | 4 | 96.15 | 91.11 | 97.1 | 85.42 | 88.17 | |
| F-4 | 41 | 234 | 7 | 4 | 96.15 | 91.11 | 97.1 | 85.42 | 88.17 | |
| F-5 | 41 | 234 | 7 | 4 | 96.15 | 91.11 | 97.1 | 85.42 | 88.17 | |
| Average | 95.24 | 90.22 | 96.18 | 81.73 | 85.72 | |||||
| Inception v4 | F-1 | 39 | 221 | 20 | 6 | 90.91 | 86.67 | 91.7 | 66.1 | 75 |
| F-2 | 39 | 225 | 16 | 6 | 92.31 | 86.67 | 93.36 | 70.91 | 78 | |
| F-3 | 39 | 226 | 15 | 6 | 92.66 | 86.67 | 93.78 | 72.22 | 78.79 | |
| F-4 | 39 | 223 | 18 | 6 | 91.61 | 86.67 | 92.53 | 68.42 | 76.47 | |
| F-5 | 39 | 221 | 20 | 6 | 90.91 | 86.67 | 91.7 | 66.1 | 75 | |
| Average | 91.68 | 86.67 | 92.61 | 68.75 | 76.65 | |||||
| Inception ResNet v2 | F-1 | 39 | 222 | 19 | 6 | 91.26 | 86.67 | 92.12 | 67.24 | 75.73 |
| F-2 | 39 | 227 | 14 | 6 | 93.01 | 86.67 | 94.19 | 73.58 | 79.59 | |
| F-3 | 40 | 228 | 13 | 5 | 93.71 | 88.89 | 94.61 | 75.47 | 81.63 | |
| F-4 | 40 | 227 | 14 | 5 | 93.36 | 88.89 | 94.19 | 74.07 | 80.81 | |
| F-5 | 39 | 222 | 19 | 6 | 91.26 | 86.67 | 92.12 | 67.24 | 75.73 | |
| Average | 92.52 | 87.56 | 93.44 | 71.52 | 78.7 | |||||
| ResNeXt-50 | F-1 | 41 | 232 | 9 | 4 | 95.45 | 91.11 | 96.27 | 82 | 86.32 |
| F-2 | 41 | 234 | 7 | 4 | 96.15 | 91.11 | 97.1 | 85.42 | 88.17 | |
| F-3 | 43 | 236 | 5 | 2 | 97.55 | 95.56 | 97.93 | 89.58 | 92.47 | |
| F-4 | 43 | 236 | 5 | 2 | 97.55 | 95.56 | 97.93 | 89.58 | 92.47 | |
| F-5 | 43 | 236 | 5 | 2 | 97.55 | 95.56 | 97.93 | 89.58 | 92.47 | |
| Average | 96.85 | 93.78 | 97.43 | 87.23 | 90.38 | |||||
| Se-ResNeXt-50 | F-1 | 42 | 232 | 9 | 3 | 95.80 | 93.33 | 96.27 | 82.35 | 87.5 |
| F-2 | 42 | 234 | 7 | 3 | 96.50 | 93.33 | 97.1 | 85.71 | 89.36 | |
| F-3 | 43 | 236 | 5 | 2 | 97.55 | 95.56 | 97.93 | 89.58 | 92.47 | |
| F-4 | 43 | 236 | 5 | 2 | 97.55 | 95.56 | 97.93 | 89.58 | 92.47 | |
| F-5 | 43 | 236 | 5 | 2 | 97.55 | 95.56 | 97.93 | 89.58 | 92.47 | |
| Average | 96.99 | 94.67 | 97.43 | 87.36 | 90.86 | |||||
Bold indicates highest accuracy
Table 5.
Results obtained from pre-trained CNN models for Multi-class2 Dataset 3
| Models/Folds(F) | Performance Evaluation based on Four Metrics | |||||||||
|---|---|---|---|---|---|---|---|---|---|---|
| TP | TN | FP | FN |
Test set (%) Acc |
Rec | Spe | Pre | F1 | ||
| AlexNet | F-1 | 35 | 201 | 43 | 10 | 81.66 | 77.78 | 82.38 | 44.87 | 56.91 |
| F-2 | 35 | 207 | 37 | 10 | 83.74 | 77.78 | 84.84 | 48.61 | 59.83 | |
| F-3 | 36 | 209 | 35 | 9 | 84.78 | 80 | 85.66 | 50.7 | 62.07 | |
| F-4 | 36 | 209 | 35 | 9 | 84.78 | 80 | 85.66 | 50.7 | 62.07 | |
| F-5 | 36 | 209 | 35 | 9 | 84.78 | 80 | 85.66 | 50.7 | 62.07 | |
| Average | 83.94 | 79.11 | 84.84 | 49.12 | 60.59 | |||||
| GoogleNet | F-1 | 36 | 213 | 31 | 9 | 86.16 | 80 | 87.3 | 53.73 | 64.29 |
| F-2 | 36 | 214 | 30 | 9 | 86.51 | 80 | 87.7 | 54.55 | 64.86 | |
| F-3 | 38 | 216 | 28 | 7 | 87.89 | 84.44 | 88.52 | 57.58 | 68.47 | |
| F-4 | 38 | 216 | 28 | 7 | 87.89 | 84.44 | 88.52 | 57.58 | 68.47 | |
| F-5 | 38 | 216 | 28 | 7 | 87.89 | 84.44 | 88.52 | 57.58 | 68.47 | |
| Average | 87.27 | 82.67 | 88.11 | 56.2 | 66.91 | |||||
| DenseNet121 | F-1 | 38 | 215 | 29 | 7 | 87.54 | 84.44 | 88.11 | 56.72 | 67.86 |
| F-2 | 38 | 216 | 28 | 7 | 87.89 | 84.44 | 88.52 | 57.58 | 68.47 | |
| F-3 | 39 | 217 | 27 | 6 | 88.58 | 86.67 | 88.93 | 59.09 | 70.27 | |
| F-4 | 39 | 217 | 27 | 6 | 88.58 | 86.67 | 88.93 | 59.09 | 70.27 | |
| F-5 | 39 | 217 | 27 | 6 | 88.58 | 86.67 | 88.93 | 59.09 | 70.27 | |
| Average | 88.24 | 85.78 | 88.69 | 58.31 | 69.43 | |||||
| ResNet-50 | F-1 | 41 | 228 | 16 | 4 | 93.08 | 91.11 | 93.44 | 71.93 | 80.39 |
| F-2 | 41 | 231 | 13 | 4 | 94.12 | 91.11 | 94.67 | 75.93 | 82.83 | |
| F-3 | 41 | 234 | 10 | 4 | 95.16 | 91.11 | 95.9 | 80.39 | 85.42 | |
| F-4 | 41 | 234 | 10 | 4 | 95.16 | 91.11 | 95.9 | 80.39 | 85.42 | |
| F-5 | 41 | 234 | 10 | 4 | 95.16 | 91.11 | 95.9 | 80.39 | 85.42 | |
| Average | 94.53 | 91.11 | 95.16 | 77.81 | 83.89 | |||||
| Se-ResNet-50 | F-1 | 41 | 229 | 15 | 4 | 93.43 | 91.11 | 93.85 | 73.21 | 81.19 |
| F-2 | 41 | 232 | 12 | 4 | 94.46 | 91.11 | 95.08 | 77.36 | 83.67 | |
| F-3 | 41 | 234 | 10 | 4 | 95.16 | 91.11 | 95.9 | 80.39 | 85.42 | |
| F-4 | 41 | 234 | 10 | 4 | 95.16 | 91.11 | 95.9 | 80.39 | 85.42 | |
| F-5 | 41 | 234 | 10 | 4 | 95.16 | 91.11 | 95.9 | 80.39 | 85.42 | |
| Average | 94.67 | 91.11 | 95.33 | 78.35 | 84.22 | |||||
| Inception v4 | F-1 | 38 | 215 | 29 | 7 | 87.54 | 84.44 | 88.11 | 56.72 | 67.86 |
| F-2 | 39 | 227 | 17 | 6 | 92.04 | 86.67 | 93.03 | 69.64 | 77.23 | |
| F-3 | 39 | 228 | 16 | 6 | 92.39 | 86.67 | 93.44 | 70.91 | 78 | |
| F-4 | 38 | 215 | 29 | 7 | 87.54 | 84.44 | 88.11 | 56.72 | 67.86 | |
| F-5 | 36 | 214 | 30 | 9 | 86.51 | 80 | 87.7 | 54.55 | 64.86 | |
| Average | 89.2 | 84.44 | 90.08 | 61.71 | 71.16 | |||||
| Inception ResNet v2 | F-1 | 38 | 216 | 28 | 7 | 87.89 | 84.44 | 88.52 | 57.58 | 68.47 |
| F-2 | 39 | 226 | 18 | 6 | 91.7 | 86.67 | 92.62 | 68.42 | 76.47 | |
| F-3 | 39 | 229 | 15 | 6 | 92.73 | 86.67 | 93.85 | 72.22 | 78.79 | |
| F-4 | 39 | 215 | 29 | 6 | 87.89 | 86.67 | 88.11 | 57.35 | 69.03 | |
| F-5 | 39 | 215 | 29 | 6 | 87.89 | 86.67 | 88.11 | 57.35 | 69.03 | |
| Average | 89.62 | 86.22 | 90.25 | 62.58 | 72.36 | |||||
| ResNeXt-50 | F-1 | 41 | 234 | 10 | 4 | 95.16 | 91.11 | 95.9 | 80.39 | 85.42 |
| F-2 | 41 | 235 | 9 | 4 | 95.5 | 91.11 | 96.31 | 82 | 86.32 | |
| F-3 | 43 | 237 | 7 | 2 | 96.89 | 95.56 | 97.13 | 86 | 90.53 | |
| F-4 | 43 | 237 | 7 | 2 | 96.89 | 95.56 | 97.13 | 86 | 90.53 | |
| F-5 | 43 | 237 | 7 | 2 | 96.89 | 95.56 | 97.13 | 86 | 90.53 | |
| Average | 96.26 | 93.78 | 96.72 | 84.08 | 88.66 | |||||
| Se-ResNeXt-50 | F-1 | 42 | 234 | 10 | 3 | 95.5 | 93.33 | 95.9 | 80.77 | 86.6 |
| F-2 | 42 | 235 | 9 | 3 | 95.85 | 93.33 | 96.31 | 82.35 | 87.5 | |
| F-3 | 43 | 237 | 7 | 2 | 96.89 | 95.56 | 97.13 | 86 | 90.53 | |
| F-4 | 43 | 237 | 7 | 2 | 96.89 | 95.56 | 97.13 | 86 | 90.53 | |
| F-5 | 43 | 237 | 7 | 2 | 96.89 | 95.56 | 97.13 | 86 | 90.53 | |
| Average | 96.40 | 94.67 | 96.72 | 84.22 | 89.14 | |||||
Bold indicates highest accuracy
Table 6.
Results obtained from pre-trained CNN models for Multi-class3 Dataset 4
| Models/Folds(F) | Performance Evaluation based on Four Metrics | |||||||||
|---|---|---|---|---|---|---|---|---|---|---|
| TP | TN | FP | FN |
Test set (%) Acc |
Rec | Spe | Pre | F1 | ||
| AlexNet | F-1 | 235 | 643 | 134 | 34 | 83.94 | 87.36 | 82.75 | 63.69 | 73.67 |
| F-2 | 238 | 643 | 134 | 31 | 84.23 | 88.48 | 82.75 | 63.98 | 74.26 | |
| F-3 | 240 | 660 | 117 | 29 | 86.04 | 89.22 | 84.94 | 67.23 | 76.68 | |
| F-4 | 240 | 660 | 117 | 29 | 86.04 | 89.22 | 84.94 | 67.23 | 76.68 | |
| F-5 | 240 | 660 | 117 | 29 | 86.04 | 89.22 | 84.94 | 67.23 | 76.68 | |
| Average | 85.26 | 88.7 | 84.07 | 65.87 | 75.59 | |||||
| GoogleNet | F-1 | 245 | 688 | 89 | 24 | 89.20 | 91.08 | 88.55 | 73.35 | 81.26 |
| F-2 | 245 | 698 | 79 | 24 | 90.15 | 91.08 | 89.83 | 75.62 | 82.63 | |
| F-3 | 249 | 704 | 73 | 20 | 91.11 | 92.57 | 90.6 | 77.33 | 84.26 | |
| F-4 | 249 | 704 | 73 | 20 | 91.11 | 92.57 | 90.6 | 77.33 | 84.26 | |
| F-5 | 249 | 704 | 73 | 20 | 91.11 | 92.57 | 90.6 | 77.33 | 84.26 | |
| Average | 90.54 | 91.97 | 90.04 | 76.19 | 83.34 | |||||
| DenseNet121 | F-1 | 249 | 709 | 68 | 20 | 91.59 | 92.57 | 91.25 | 78.55 | 84.98 |
| F-2 | 251 | 713 | 64 | 18 | 92.16 | 93.31 | 91.76 | 79.68 | 85.96 | |
| F-3 | 255 | 720 | 57 | 14 | 93.21 | 94.8 | 92.66 | 81.73 | 87.78 | |
| F-4 | 255 | 720 | 57 | 14 | 93.21 | 94.8 | 92.66 | 81.73 | 87.78 | |
| F-5 | 255 | 720 | 57 | 14 | 93.21 | 94.8 | 92.66 | 81.73 | 87.78 | |
| Average | 92.68 | 94.05 | 92.2 | 80.68 | 86.86 | |||||
| ResNet 50 | F-1 | 255 | 720 | 57 | 14 | 93.21 | 94.8 | 92.66 | 81.73 | 87.78 |
| F-2 | 255 | 722 | 55 | 14 | 93.40 | 94.8 | 92.92 | 82.26 | 88.08 | |
| F-3 | 258 | 730 | 47 | 11 | 94.46 | 95.91 | 93.95 | 84.59 | 89.9 | |
| F-4 | 258 | 730 | 47 | 11 | 94.46 | 95.91 | 93.95 | 84.59 | 89.9 | |
| F-5 | 258 | 730 | 47 | 11 | 94.46 | 95.91 | 93.95 | 84.59 | 89.9 | |
| Average | 94.00 | 95.46 | 93.49 | 83.55 | 89.11 | |||||
| Se-ResNet-50 | F-1 | 257 | 720 | 57 | 12 | 93.40 | 95.54 | 92.66 | 81.85 | 88.16 |
| F-2 | 257 | 722 | 55 | 12 | 93.59 | 95.54 | 92.92 | 82.37 | 88.47 | |
| F-3 | 259 | 732 | 45 | 10 | 94.74 | 96.28 | 94.21 | 85.2 | 90.4 | |
| F-4 | 258 | 730 | 47 | 11 | 94.46 | 95.91 | 93.95 | 84.59 | 89.9 | |
| F-5 | 258 | 730 | 47 | 11 | 94.46 | 95.91 | 93.95 | 84.59 | 89.9 | |
| Average | 94.13 | 95.84 | 93.54 | 83.72 | 89.37 | |||||
| Inception v4 | F-1 | 245 | 698 | 79 | 24 | 90.15 | 91.08 | 89.83 | 75.62 | 82.63 |
| F-2 | 248 | 698 | 79 | 21 | 90.44 | 92.19 | 89.83 | 75.84 | 83.22 | |
| F-3 | 248 | 704 | 75 | 21 | 90.84 | 92.19 | 90.37 | 76.78 | 83.78 | |
| F-4 | 245 | 700 | 77 | 24 | 90.34 | 91.08 | 90.09 | 76.09 | 82.91 | |
| F-5 | 245 | 698 | 79 | 24 | 90.15 | 91.08 | 89.83 | 75.62 | 82.63 | |
| Average | 90.39 | 91.52 | 89.99 | 75.99 | 83.04 | |||||
| Inception ResNet v2 | F-1 | 247 | 698 | 79 | 22 | 90.34 | 91.82 | 89.83 | 75.77 | 83.03 |
| F-2 | 251 | 700 | 77 | 17 | 91.00 | 93.66 | 90.09 | 76.52 | 84.23 | |
| F-3 | 251 | 714 | 63 | 17 | 92.34 | 93.66 | 91.89 | 79.94 | 86.25 | |
| F-4 | 251 | 710 | 67 | 17 | 91.96 | 93.66 | 91.38 | 78.93 | 85.67 | |
| F-5 | 247 | 698 | 79 | 22 | 90.34 | 91.82 | 89.83 | 75.77 | 83.03 | |
| Average | 91.2 | 92.92 | 90.6 | 77.39 | 84.44 | |||||
| ResNeXt-50 | F-1 | 258 | 730 | 47 | 11 | 94.46 | 95.91 | 93.95 | 84.59 | 89.9 |
| F-2 | 260 | 732 | 45 | 9 | 94.84 | 96.65 | 94.21 | 85.25 | 90.59 | |
| F-3 | 260 | 740 | 37 | 9 | 95.60 | 96.65 | 95.24 | 87.54 | 91.87 | |
| F-4 | 260 | 740 | 37 | 9 | 95.60 | 96.65 | 95.24 | 87.54 | 91.87 | |
| F-5 | 260 | 740 | 37 | 9 | 95.60 | 96.65 | 95.24 | 87.54 | 91.87 | |
| Average | 95.22 | 96.51 | 94.77 | 86.49 | 91.22 | |||||
| Se-ResNeXt-50 | F-1 | 260 | 732 | 45 | 9 | 94.84 | 96.65 | 94.21 | 85.25 | 90.59 |
| F-2 | 261 | 733 | 44 | 8 | 95.03 | 97.03 | 94.34 | 85.57 | 90.94 | |
| F-3 | 262 | 742 | 35 | 7 | 95.98 | 97.4 | 95.5 | 88.22 | 92.58 | |
| F-4 | 262 | 742 | 35 | 7 | 95.98 | 97.4 | 95.5 | 88.22 | 92.58 | |
| F-5 | 262 | 742 | 35 | 7 | 95.98 | 97.4 | 95.5 | 88.22 | 92.58 | |
| Average | 95.56 | 97.17 | 95.01 | 87.09 | 91.85 | |||||
Bold indicates highest accuracy
Binary dataset (Dataset1: 2-class)
Accuracy calculation for all the used pre-trained models are shown in Table 3 for all k-folds. This dataset achieves the highest accuracy of 99.32% from fold-3 (i.e. fold-4 and fold-5 also achieve the same accuracy) for two models ResNeXt-50 and Se-ResNeXt-50 however average accuracy of Se-ResNeXt-50 is higher than ResNeXt-50. This dataset lowest achieved accuracy is 87.04% for Inception ResNet V2, however, its average accuracy is similar to Inception V4. Dataset1 achieve highest average accuracy of 98.36% for Se-ResNeXt-50. For other pre-trained models highest achieved accuracy as AlexNet: 97.95%, GoogleNet: 98.63%, DenseNet121: 98.63%, ResNet-50: 98.63%, Se-ResNet-50: 98.63%, Inception V4: 90.41%, Inception ResNet V2:91.10% and ResNeXt-50: 98.08%.
Multi-class dataset (Dataset2: 3-class)
Accuracy calculation for all the used pre-trained models are shown in Table 4 for all k-folds. This dataset achieves the highest accuracy of 97.55% from fold-3 (i.e. fold-4 and fold-5 also achieve the same accuracy) for two models ResNeXt-50 and Se-ResNeXt-50. Dataset2 lowest accuracy is 84.97% for the AlexNet model. Its highest average accuracy is 96.99% for model Se-ResNeXt-50. For other pre trained models highest achieved accuracy as AlexNet: 88.46%, GoogleNet: 92.31%, DenseNet121: 94.41%, ResNet-50: 95.80%, Se-ResNet-50: 96.15% Inception V4: 92.66%, Inception ResNet V2:93.71% and ResNeXt-50: 96.85%.
Multi-class dataset (Dataset3: 4-class)
Accuracy calculation for all the used pre-trained models are shown in Table 5 for all k-folds. This dataset achieve highest accuracy of 96.89% from fold-3 (i.e. fold-4 and fold-5 also achieve the same accuracy) for two models ResNeXt-50 and Se-ResNeXt-50. Its lowest accuracy is 81.66% for AlexNet model. Dataset3 highest average accuracy is 96.40% for model Se-ResNeXt-50. For other pre trained models highest achieved accuracy as AlexNet: 84.78%, GoogleNet: 87.89%, DenseNet121: 88.58%, ResNet-50: 95.16%, Se-ResNet-50: 95.16%, Inception V4: 92.39%, Inception ResNet V2: 92.73% and ResNeXt-50: 96.26%.
Multiclass dataset (Dataset4: 3-class)
Accuracy calculation for all the used pre-trained models are shown in Table 6 for all k-folds. This dataset achieve highest accuracy of 95.98% from fold-3 (i.e. fold-4 and fold-5 also achieve the same accuracy) for model Se-ResNeXt-50. Its lowest accuracy is 83.94% for AlexNet model. Its highest mean accuracy is 95.56% for Se-ResNeXt-50. For other pre trained models highest achieved accuracy as AlexNet: 85.26%, GoogleNet: 90.54%, DenseNet121: 92.68%, ResNet-50: 94.00%, Se-ResNet-50: 94.13%, Inception V4: 90.39%, Inception ResNet V2: 91.20% and ResNeXt-50: 95.22%.
We observed that for all datasets pre-trained models AlexNet, GoogleNet, ResNet-50, Se-ResNet-50, DenseNet121, Inception V4, Inception ResNet V2, ResNeXt-50 and Se-ResNeXt-50 achieves similar accuracy after fold-2 i.e. for fold-3, fold-4 and fold-5. Models Inception V4 and Inception ResNet V2 achieves the highest accuracy for fold-3 but its accuracy again reduces for fold-4 and fold-5.
We can observe from Tables 3, 4, 5 and 6 that even after increasing the no of classification classes in the dataset, the Se-ResNeXt-50 model achieves higher accuracy i.e. it performs better than other models in all dataset categories. So, we can conclude that Se-ResNeXt-50 performs well in all datasets and the top 2 pre-trained models are Se-ResNeXt-50 and ResNeXt-50. As the highest accuracy is achieved by the same pre-trained model Se-ResNeXt-50 for all the datasets but lowest accuracy is not achieved by the same model Se-ResNeXt-50. For example in the case of binary class Inception ResNet V2 and in multiclass AlexNet pre-trained model gives the lowest accuracy. Finally, we observed that the SE blocks consistently improve performance across different depths with very little increment in computational complexity.
Abbreviations used in Tables 3, 4, 5 and 6 are: Acc: Accuracy, rec: Recall, spec: Specificity, Prec: Precision, F1: F1-score. The highest, average, and lowest accuracy of each model is represented with bold text.
The proposed setup is classifying COVID-19 disease patients correctly. For deeper explanation confusion matrix of all datasets for ResNet-50, ResNeXt-50 and Se-ResNeXt-50 model is shown in Fig. 20. We have considered fold-3, because it achieves the highest accuracy.
The dataset1 accurate classification of fold-3 for models are:
ResNet-50: COVID-19 with a 100% classification rate and misclassify two instances of normal or healthy condition with an overall mean accuracy of 97.4%.
ResNeXt-50 and Se-ResNeXt-50: COVID 19 with a 100% classification rate and misclassify one instance of normal or healthy condition with an overall mean accuracy of 98.08% and 98.36%. However, both the architectures achieve the same accuracy for fold-3.
The dataset2 accurate classification of fold-3 for models are:
ResNet-50: COVID-19 with 91% classification rate by misclassify 4 as bacterial. For normal it misclassifies 2 instances as bacterial pneumonia, and for bacterial pneumonia, it misclassifies 1 instance as COVID −19 and 5 instances as normal with an overall mean accuracy of 95.03%.
ResNeXt-50 and Se- ResNeXt-50: COVID-19 with 93% classification rate by misclassify 2 as bacterial. For normal it misclassifies 1 instance as bacterial pneumonia and for bacterial pneumonia, it misclassifies 4 instances as normal with an overall mean accuracy of 96.85% and 96.99%. However, both the architectures achieve the same accuracy for fold-3.
The dataset3 accurate classification of fold-3 for models are:
ResNet-50: COVID-19 with a 91% classification rate by misclassifying 3 instances as bacterial pneumonia and 1 instance as viral pneumonia. For normal it misclassifies 1 instance as bacterial pneumonia, for bacterial pneumonia it misclassifies 5 instances as normal and 4 instances as viral pneumonia, and for viral pneumonia it misclassifies 4 instances as normal and 2 instances as bacterial pneumonia with an overall mean accuracy of 94.34%.
ResNeXt-50 and Se-ResNeXt-50: COVID-19 with 93% classification rate by misclassify 2 as bacterial pneumonia. For bacterial pneumonia, it misclassifies 5 instances as normal and 2 instances as viral pneumonia and for viral pneumonia, it misclassifies 3 instances as normal with an overall mean accuracy of 96.26% and 96.40%. However, both the architectures achieve the same accuracy for fold-3.
The dataset4 accurate classification of fold-3 for models are:
ResNet-50: Normal condition with a 95.91% classification rate by misclassifying 5 instances as bacterial pneumonia and 6 instances as viral pneumonia. For bacterial pneumonia, it misclassifies 18 instances as normal and 12 instances as viral pneumonia and, for viral pneumonia it misclassifies 10 instances as normal and 7 instances as bacterial pneumonia with an overall mean accuracy of 94.00%.
ResNeXt-50: Normal condition with a 96.65% classification rate by misclassifying 4 instances as bacterial pneumonia and 5 instances as viral pneumonia. For bacterial pneumonia, it misclassifies 16 instances as normal and 10 instances as viral pneumonia and, for viral pneumonia it misclassifies 5 instances as normal and 6 instances as bacterial pneumonia with an overall mean accuracy of 95.22%.
Se-ResNeXt-50: Normal condition with a 97.39% classification rate by misclassifying 4 instances as bacterial pneumonia and 3 instances as viral pneumonia. For bacterial pneumonia, it misclassifies 15 instances as normal and 10 instances as viral pneumonia and, for viral pneumonia it misclassifies 5 instances as normal and 5 instances as bacterial pneumonia with an overall mean accuracy of 95.56%.
In multiclass datasets misclassifies instances are: normal as bacterial, bacterial as viral pneumonia and viral pneumonia are misclassified as normal or bacterial. Human being’s immunity system is the main reason for this misclassification because when people effected by viral or virus normally they don’t go for chest-X-ray every time. Viral pneumonia is also misclassified as bacterial pneumonia because of non-clarity of X-ray images and non-availability of pediatric X-ray images as it attacks child after their birth first time. In some cases, our proposed system misclassified some images of COVID-19 as bacterial pneumonia and viral pneumonia. In the case of COVID-19, a lot of changes can be seen in the X-ray image of the patient because bacterial pneumonia and the human immunity system are not developed to fight against this coronavirus. The COVID-19 patient X-ray images are classified accurately by distinct architectures of CNN. This architecture performance may be improved by finely tune the transfer learning process and by increasing the amount of data.
Performance evaluation
Performance evaluation of the proposed approach is performed using 5 evaluation metrics discussed in Section 3.5. Evaluation is performed on 20% test data for all four datasets. Evaluation values are shown in Table 7.
Table 7.
Accuracy Comparison of proposed work with other researchers work
| Methods | Features | Model | Classes | Data Samples | Performance |
|---|---|---|---|---|---|
| Xu et al. [7] | Automated | ResNet | 2 | 618 | 86.7% |
| Wang et al. [8] | Automated | Inception model | 2 | 453 | 89.5% |
| Apostolopoulos et al. [41] | Automated | MobileNet | 3 | 1427 | 96.78 (train data accuracy) |
| Ali Narin et al. [42] | Automated | ResNet-50 | 2 | 20 | 98% (test data- average accuracy) |
| Proposed System | Automated | Se-ResNeXt-50 | 2,3,4 | 6674 | 98.36%, 96.99%, 96.40% (test data- average accuracy) |
We performed a comparative analysis to show the effectiveness of our proposed system. We have compared the results of our proposed system with some previously existing techniques [7, 8, 41, 42] as shown in Table 7. Wang et al. [8] perform an evaluation using the Inception model on 453 CT scans confirmed COVID-19 cases of pathogen and achieved 89.5% accuracy to classify data in healthy and COVID-19 patients. Xu et al. [7] proposed another deep learning-based system on 618 CT samples and differentiates between COVID-19 patients, pneumonia, and Influenza-A viral pneumonia using the ResNet-50 model and achieved 86.7% accuracy. Similarly, other authors of paper [41, 42] achieve accuracy of 96.78% and 98% respectively by classifying data (k-fold techniques) in 2 and 3 classes respectively. Table 7 we have shown the average accuracy of the model (Se-ResNeXt-50) which gives the highest accuracy.
From evaluation scores, we can say that the proposed approach accurately classifies images in all classes as COVID-19, normal, bacterial pneumonia, and viral pneumonia. So we can conclude that fine-tuning of pre-trained CNN architecture can be deployed as one of the useful techniques in the medical field for the classification of Chest X-ray images.
Application of the proposed approach
From results, we can state that this proposed approach can be deployed as one of the useful techniques in the medical field for classification of Chest X-ray images to identify COVID-19 patients. This can be used as a pre-assessment process to reduce physician workload, to reveal internal structures, to diagnose and treat diseases at early stages. These techniques can be used to detect the characteristics of metastatic cancer with higher accuracy than a human radiologist. For example, if breast cancer is diagnosed early it is highly curable because it involves comparing two mammogram images to identify points of abnormal breast tissue which can be facilitated by deep transfer learning techniques. We can also apply this approach to process MRI images. Standard MRI analysis requires hours of computing time to analyse data of large number of patients. So by applying CNN architectures desired output may be produced early. In medical imaging fields, this approach can speed up the diagnosis process to provide a solution for children with chronic pain, detection of early diabetes, tumour, and cancers, etc. So we can conclude that this approach can be used by doctors and practitioners to determine the status of the organ and what treatments would be required for the recovery.
Conclusion
Early diagnosis of COVID-19 patients is important for preventing the disease from spreading to others. In this paper, we introduced a deep CNN based approach using transfer learning to differentiate COVID-19 patients from bacterial pneumonia, viral pneumonia, and normal. We have deployed nine pre-trained CNN models to explore the transfer learning techniques and conclude that fine tuning the pre-trained CNN models can be successfully deployed to a limited class dataset.CT imaging is an important method for diagnosing and assessing COVID-19. We have used pre-trained expertise to improve COVID-19’s diagnostic efficiency. The proposed system produced a maximum accuracy of 99.32% for binary class and 97.55% for multi-class among all the seven models. Our high accuracy findings can be helpful to the doctors and researchers to make decisions in clinical practice.
Our study has several limitations that can be overcome in future research. In particular, a more in-depth analysis requires much more patient data, especially those suffering from COVID-19. A more interesting approach for future research would focus on distinguishing patients showing mild symptoms, rather than pneumonia symptoms, while these symptoms may not be accurately visualized on X-rays, or may not be visualized at all.
Furthermore, we will try to use our approach on bigger datasets, to solve other medical problems like cancer, tumors, etc. and also on other computer vision fields as energy, agriculture, and transport in the upcoming days. Future research directions will include the exploration of image data augmentation techniques to improve accuracy even more while avoiding overfitting. We observed that performance could be improved further, by increasing dataset size, using a data augmentation approach, and using hand-crafted features, in the future.
Biographies
Swati Hira
is currently an Assistant Professor at Shri Ramdeo Baba College of Engineering and Management, Nagpur. She received her PhD from Visvesvaraya National Institute of Technology India and MTech degree from Devi Ahilya Vishwa Vidyalaya, Indore. She has co-authored a number of research articles in various journals, conferences, and book chapters. She is a member of ACM and IAENG. Her research interest Multidimensional Modelling, Statistical Data mining, Deep Learning, Computer Vision and Machine Learning.
Anita Bai
is currently an Associate Professor with the Department of Computer Science and Engineering at K L University Hyderabad, India. She received her PhD from Visvesvaraya National Institute of Technology, Nagpur, India and M.Tech degree from National Institute of Technology, Rourkela, India. She has co-authored a number of research articles in various journals, conferences, and book chapters. She is a member of IEEE and IAENG. Her research interests include data mining, soft computing and machine learning.
Sanchit Hira
Student of Laboratory for Computational Sensing and Robotics, Johns Hopkins University 3400 N. Charles Street, Baltimore, MD 21218, USA.
Compliance with ethical standards
Conflict of interest
There is no conflict of interest.
Footnotes
Publisher’s note
Springer Nature remains neutral with regard to jurisdictional claims in published maps and institutional affiliations.
Swati Hira and Anita Bai contributed equally to this work.
Contributor Information
Swati Hira, Email: hiras@rknec.edu, Email: swati.hira@gmail.com.
Anita Bai, Email: anitabai@klh.edu.in, Email: anitaahirwarnitr@gmail.com.
References
- 1.Stoecklin SB, Rolland P, Silue Y, Mailles A, Campese C, Simondon A, Mechain M, Meurice L, Nguyen M, Bassi C, Yamani E. First cases of coronavirus disease 2019 (COVID-19) in France: surveillance, investigations and control measures. Eurosurveillance. 2020;13;25(6):2000094. doi: 10.2807/1560-7917.ES.2020.25.6.2000094. [DOI] [PMC free article] [PubMed] [Google Scholar]
- 2.Mahase E. Coronavirus: Covid-19 has killed more people than SARS and MERS combined, despite lower case fatality rate. The BMJ. 2020;368:m641. doi: 10.1136/bmj.m641. [DOI] [PubMed] [Google Scholar]
- 3.Wang Y, Hu M, Li Q, Zhang X P, Zhai G, Yao N (2020) Abnormal respiratory patterns classifier may contribute to large-scale screening of people infected with COVID-19 in an accurate and unobtrusive manner. arXiv preprint arXiv : 2002.05534, 1-6
- 4.Huang C, Wang Y, Li X, Ren L, Zhao J, Hu Y, Zhang L, Fan G, Xu J, Gu X, Cheng Z, Yu T, Xia J, Wei Y, Wu W, Xie X, Yin W, Li H, Liu M, Xiao Y, Gao H, Guo L, Xie J, Wang G, Jiang R, Gao Z, Jin Q, Wang J, Cao B. Clinical features of patients infected with 2019 novel coronavirus in Wuhan, China. Lancet. 2020;395(10223):497–506. doi: 10.1016/S0140-6736(20)30183-5. [DOI] [PMC free article] [PubMed] [Google Scholar]
- 5.Deng L, Yu D, et al. Deep learning: methods and applications. Found Trends® Signal Proc. 2014;7(3–4):197–387. doi: 10.1561/2000000039. [DOI] [Google Scholar]
- 6.Shan F, Gao Y, Wang J, Shi W, Shi N, Han M, Xue Z, Shi Y (2020) Lung infection quantification of COVID-19 in CT images with deep learning. arXiv preprint arXiv:2003.04655, 1–19
- 7.Xu X, Jiang X, Ma C, Du P, Li X, Lv S, Yu L, Chen Y, Su J, Lang G, Li Y, Zhao H, Xu K, Ruan L, Wu W (2020) Deep learning system to screen coronavirus disease 2019 pneumonia. arXiv preprint arXiv:2002.09334, 1–29 [DOI] [PMC free article] [PubMed]
- 8.Wang S, Kang B, Ma J, Zeng X, Xiao M, Guo J, Cai M, Yang J, Li Y, Meng X, Xu B (2020) A deep learning algorithm using CT images to screen for Corona virus disease (COVID-19). medRxiv preprint. 10.1101/2020.02.14.20023028, 1–26 [DOI] [PMC free article] [PubMed]
- 9.Sethy P K, Behera S K (2020) Detection of coronavirus disease (COVID-19) based on deep features. Preprints 2020, 2020030300. 10.20944/preprints202003.0300.v1)
- 10.Hamimi A. MERS-CoV: Middle East respiratory syndrome corona virus: can radiology be of help? Initial single center experience. Egypt J Radiol Nucl Med. 2016;47(1):95–106. doi: 10.1016/j.ejrnm.2015.11.004. [DOI] [Google Scholar]
- 11.Xie X, Li X, Wan S, Gong Y. In: Mining X-ray images of SARS patients. Data mining: theory, methodology, techniques, and applications. Williams GJ, Simoff SJ, editors. Berlin, Heidelberg: springer-Verlag; 2006. pp. 282–294. [Google Scholar]
- 12.Wang D, Hu B, Hu C, Zhu F, Liu X, Zhang J, Wang B, Xiang H, Cheng Z, Xiong Y, et al. Clinical characteristics of 138 hospitalized patients with 2019 novel coronavirus-infected pneumonia in Wuhan, China. Jama. 2020;17;323(11):1061–1069. doi: 10.1001/jama.2020.1585. [DOI] [PMC free article] [PubMed] [Google Scholar]
- 13.Albarello F, Pianura E, Di Stefano F, Cristofaro M, Petrone A, Marchioni L, Palazzolo C, Vincenzo Schinin_a, Emanuele Nicastri, Nicola Petrosillo, et al. 2019-novel coronavirus severe adult respiratory distress syndrome in two cases in Italy: an uncommon radiological presentation. Int J Infect Dis. 2020;93:192–197. doi: 10.1016/j.ijid.2020.02.043. [DOI] [PMC free article] [PubMed] [Google Scholar]
- 14.Holshue ML, DeBolt C, Lindquist S, Lofy KH, Wiesman J, Bruce H, Spitters C, Ericson K, Wilkerson S, Tural A, Diaz G (2020) First case of 2019 novel coronavirus in the United States. N Engl J Med 382(10):929–936 [DOI] [PMC free article] [PubMed]
- 15.Li Q, Guan X, Wu P, Wang X, Zhou L, Tong Y, Ren R, Kathy SM Leung, Eric HY Lau, Jessica Y Wong, et al. Early transmission dynamics in Wuhan, China, of novel coronavirus-infected pneumonia. N Engl J Med. 2020;382:1199–1207. doi: 10.1056/NEJMoa2001316. [DOI] [PMC free article] [PubMed] [Google Scholar]
- 16.Zhu R-F, Gao R-L, Robert S-H, Gao J-P, Yang S-G, Zhu C (2020) Systematic review of the registered clinical trials of coronavirus diseases 2019 (Covid-19). medRxiv [DOI] [PMC free article] [PubMed]
- 17.Gao J, Tian Z, Xu Y (2020) Breakthrough: Chloroquine phosphate has shown apparent efficacy in treatment of Covid-19 associated pneumonia in clinical studies. Bioscience trends [DOI] [PubMed]
- 18.Cortegiani A, Ingoglia G, Ippolito M, Giarratano A, Einav S (2020) A systematic review on the efficacy and safety of chloroquine for the treatment of Covid-19. J Crit Care 57:279–283 [DOI] [PMC free article] [PubMed]
- 19.Anastassopoulou C, Russo L, Tsakris A, Siettos C (2020) Data-based analysis, modelling and forecasting of the novel coronavirus (2019-ncov) outbreak. medRxiv. 10.1101/2020.02.11.20022186 [DOI] [PMC free article] [PubMed]
- 20.Gamero J, Tamayo J A, Martinez-Roman J A (2020) Forecast of the evolution of the contagious disease caused by novel coronavirus (2019-ncov) in china. arXiv preprint arXiv:2002.04739
- 21.Joseph TW, Leung K, Leung GM. Nowcasting and forecasting the potential domestic and international spread of the 2019-ncov outbreak originating in Wuhan, China: a modelling study. Lancet. 2020;395(10225):689–697. doi: 10.1016/S0140-6736(20)30260-9. [DOI] [PMC free article] [PubMed] [Google Scholar]
- 22.Lin Q, Zhao S, Gao D, Lou Y, Yang S, Musa SS, Wang MH, Cai Y, Wang W, Yang L, et al. A conceptual model for the outbreak of coronavirus disease 2019 (Covid-19) in Wuhan, China with individual reaction and governmental action. Int J Infect Dis. 2020;93:211–216. doi: 10.1016/j.ijid.2020.02.058. [DOI] [PMC free article] [PubMed] [Google Scholar]
- 23.Chinazzi M, Davis J T, Ajelli M, Gioannini C, Litvinova M, Merler S, Piontti A P, Mu K, Rossi L, Sun K, et al (2020) The effect of travel restrictions on the spread of the 2019 novel coronavirus (Covid-19) outbreak. Science [DOI] [PMC free article] [PubMed]
- 24.Butt C, Gill J, Chun D, Babu BA (2020) Deep learning system to screen coronavirus disease 2019 pneumonia. Appl Intell 24:1. 10.1007/s10489-020-01714-3 [DOI] [PMC free article] [PubMed]
- 25.Yosinski J, Clune J, Bengio Y, Lipson H, Ghahramani Z, Welling M, Cortes C, Lawrence N D, Weinberger KQ (2014) How transferable are features in deep neural networks? In advances in neural information processing systems 27, proceedings of the neural information processing systems 2014, Montreal, QC, Canada, 8–13 December neural information processing Systems Foundation, Inc. (NIPS): Montreal, QC, Canada, 3320–3328
- 26.Dai W, Chen Y, Xue Gr, Yang Q, Yu Y, Koller D, Schuurmans D, Bengio Y, Bottou L (2008) Translated Learning: Transfer Learning across Different Feature Spaces. In Advances in Neural Information Processing Systems 21, Proceedings of the Neural Information Processing Systems 2008, Vancouver, BC, Canada, 8–10 December 2008; Neural Information Processing Systems Foundation, Inc. (NIPS): Vancouver, BC, Canada, 353–360
- 27.Raghu M, Zhang C, Kleinberg JM, Bengio S (2019) Transfusion: understanding transfer learning with applications to medical imaging. arXiv, arXiv:1902.07208
- 28.Ravishankar H, Sudhakar P, Venkataramani R, Thiruvenkadam S, Annangi P, Babu N, Vaidya V. Understanding the Mechanisms of Deep Transfer Learning for Medical Images. In: Carneiro G, editor. Deep Learning and Data Labeling for Medical Applications; DLMIA 2016, LABELS 2016. Cham, Switzerland: Springer; 2016. p. 10008. [Google Scholar]
- 29.Krizhevsky A, Sutskever I, Hinton GE. ImageNet classification with deep convolutional neural networks. Commun ACM. 2017;60:84–90. doi: 10.1145/3065386. [DOI] [Google Scholar]
- 30.Huang G, Liu Z, van der Maaten L, Weinberger KQ (2016) Densely connected convolutional networks arXiv:1608.06993
- 31.He K, Zhang X, Ren S, Sun J (2016) Deep residual learning for image recognition. In: Proceedings of the IEEE conference on computer vision and pattern recognition, 770–778
- 32.Szegedy C, Vanhoucke V, Ioffe S, Shlens J, Wojna Z (2015) Rethinking the inception architecture for computer vision arXiv:1512.00567
- 33.Szegedy C, Liu W, Jia Y, Sermanet P, Reed S, Anguelov D, Erhan D, Vanhoucke V, Rabinovich A (2014) Going deeper with convolutions. In proceedings of the IEEE conference on computer vision and pattern recognition, 1–9 arXiv:1409.4842
- 34.Lecun Y, Bottou L, Bengio Y, Haffner P. Gradient-based learning applied to document recognition. Proc IEEE. 1998;86(11):2278–2324. doi: 10.1109/5.726791. [DOI] [Google Scholar]
- 35.Targ S, Almeida D, Lyman K (2016) ResNet in ResNet: generalizing residual architectures. arXiv preprint arXiv:1603.08029
- 36.Ioffe S, and Szegedy C (2015) Batch normalization: accelerating deep network training by reducing internal covariate shift. In proceedings of 32nd international conference on machine learning, 448–456
- 37.Szegedy C, Ioffe S, Vanhoucke V, Alemi AA (2017) Inception-v4, inception-ResNet and the impact of residual connections on learning. In Thirty-first AAAI conference on artificial intelligence. arXiv preprint arXiv:1602.07261
- 38.Cohen JP (2020) COVID-19 image data collection. arXiv:2003.11597. https://github.com/ieee8023/Covid-chestxray-dataset. Accessed 25 Mar 2020
- 39.Kaggle. https://www.kaggle.com/andrewmvd/convid19-X-rays. Accessed Mar 2020
- 40.Kermany DS, Goldbaum M, Cai W et al (2018) Identifying medical diagnoses and treatable diseases by image-based deep learning. Cell 172:1122–1131.e9. 10.1016/j.cell.2018.02.010 [DOI] [PubMed]
- 41.Apostolopoulos ID, Mpesiana TA (2020) Covid-19: automatic detection from x-ray images utilizing transfer learning with convolutional neural networks. Phys Eng Sci Med 43:635–640. 10.1007/s13246-020-00865-4 [DOI] [PMC free article] [PubMed]
- 42.Narin A, Kaya C, Pamuk Z (2020) Automatic detection of coronavirus disease (Covid-19) using x-ray images and deep convolutional neural networks. arXiv preprint arXiv:2003.10849 [DOI] [PMC free article] [PubMed]
- 43.Xie S, Girshick R, Dollár P, Tu Z, He K (2017) Aggregated residual transformations for deep neural networks. In proceedings of the IEEE conference on computer vision and pattern recognition.1492–1500
- 44.Hu J, Shen L, Sun G (2018) Squeeze-and-excitation networks. In Proceedings of the IEEE conference on computer vision and pattern recognition .7132–7141
- 45.Kermany DS, Goldbaum M, Cai W, Valentim CC, Liang H, Baxter SL, McKeown A, Yang G, Wu X, Yan F, Dong J (2018) Identifying medical diagnoses and treatable diseases by image-based deep learning. Cell. 1122–31 [DOI] [PubMed]
- 46.Oh Y, Park S, Ye JC. Deep learning covid-19 features on cxr using limited training data sets. IEEE Trans Med Imaging. 2020;39:2688–2700. doi: 10.1109/TMI.2020.2993291. [DOI] [PubMed] [Google Scholar]
- 47.Sarkodie BD, Osei-Poku K, Brakohiapa E. Diagnosing COVID-19 from chest X-ray in resource limited environment-case report. Med Case Rep. 2020;6(2):135. [Google Scholar]
- 48.Waheed A, Goyal M, Gupta D, Khanna A, Al-Turjman F, Pinheiro PR. Covidgan: data augmentation using auxiliary classifier Gan for improved covid-19 detection. IEEE Access. 2020;8:91916–91923. doi: 10.1109/ACCESS.2020.2994762. [DOI] [PMC free article] [PubMed] [Google Scholar]


